Relative Strength Strategies – Meb Faber

Today’s post looks at a 2010 paper from Meb Faber on the subject of Relative Strength Strategies.
Contents
Tactical Asset Allocation

Meb runs Cambria Asset Management, which offers a range of ETFs in the States.
- He’s also written a number of books and he has a podcast.
A couple of weeks ago, we looked at a very old paper of his called ” A Quantitative Approach to Tactical Asset Allocation”.
The purpose of the paper was:
To present a simple quantitative method that improves the risk-adjusted returns across various asset classes.
That method was to cycle between cash and five assets in an equal-weight portfolio, depending on whether each asset was above its 200-day MA.
As well as better returns, GTAA gives lower volatility and max drawdowns, and a higher Sharpe ratio.
- Meb also shows that any MA from 3 months to 12 months works well.
In the 2013 update to the paper, Meb provides some alternatives to the original GTAA approach:
- More asset classes (moving from GTAA-5 top GTAA-13).
- Using 10-year Treasuries as the asset alternative instead of cash
- A conservative GTAA with 40% in bonds
- An aggressive portfolio that selects the top 6 from the GTAA-13 ( ranked by an average of 1, 3, 6, and 12-month total returns/momentum)
- An (optionally) levered version using just the top 3 assets
These last two variations are covered in more detail in today’s paper, called “Relative Strength Strategies for Investing”.
Relative Strength Strategies
The purpose of today’s paper is:
To describe some simple methods that an everyday investor can use to implement momentum models in trading.
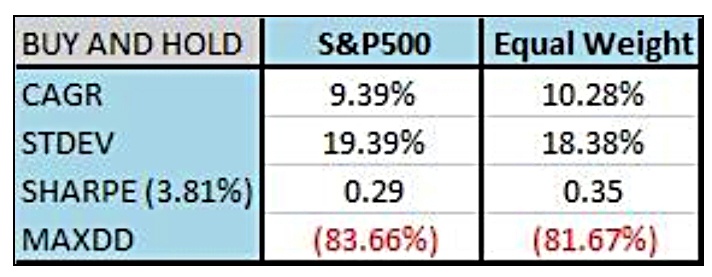
The control portfolio is a version of the S&P 500 formed from equal-weighted sector allocations.
- This has slightly better returns and Sharpe, and lower volatility and drawdown than the main index.
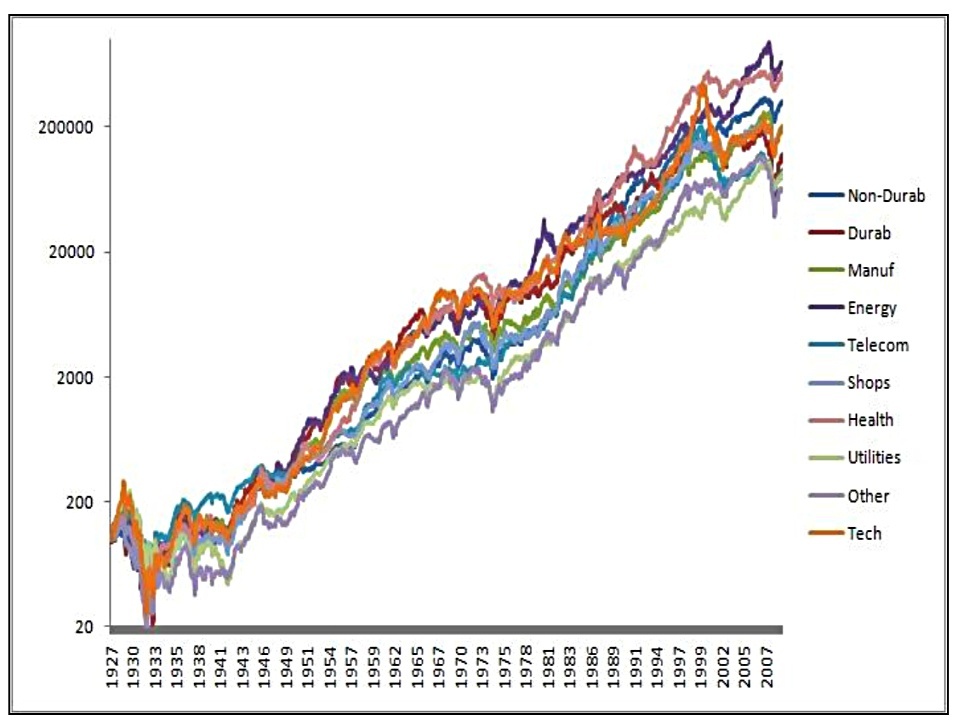
The sectors are:
- Consumer Non-Durables — Food, Tobacco, Textiles, Apparel, Leather, Toys
- Consumer Durables — Cars, TV’s, Furniture, Household Appliances
- Manufacturing — Machinery, Trucks, Planes, Chemicals, Office Furniture, Paper, Commercial Printing
- Energy — Oil, Gas, and Coal Extraction and Products
- Technology — Computers, Software, and Electronic Equipment
- Telecommunications — Telephone and Television Transmission
- Shops — Wholesale, Retail, and Some Services (Laundries, Repair Shops)
- Health — Healthcare, Medical Equipment, and Drugs
- Utilities
- Other — Mines, Construction, Transportation, Hotels, Business Services, Entertainment, Finance
The test system
The test portfolio uses a monthly ranking of sectors based on trailing total returns, looking back from one to twelve months (plus a combination of periods).
- The system invests in the top N sectors, where N could be anything from 1 to 9.
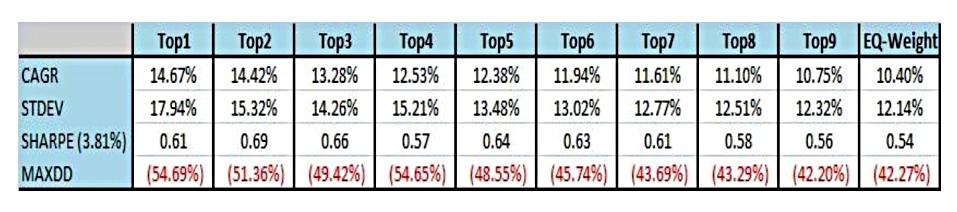
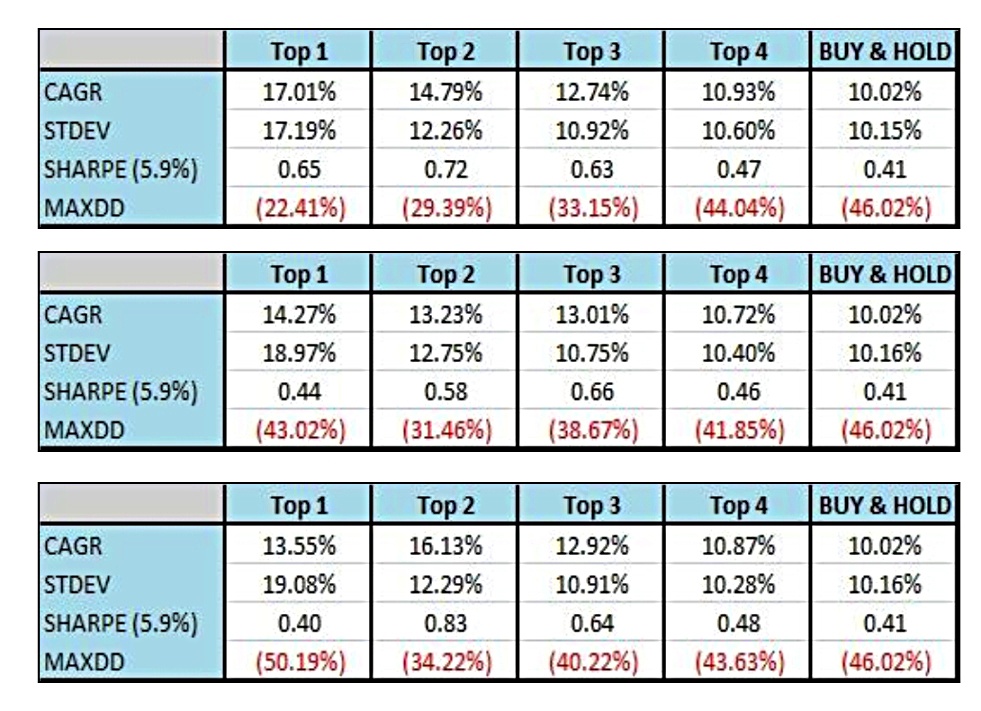
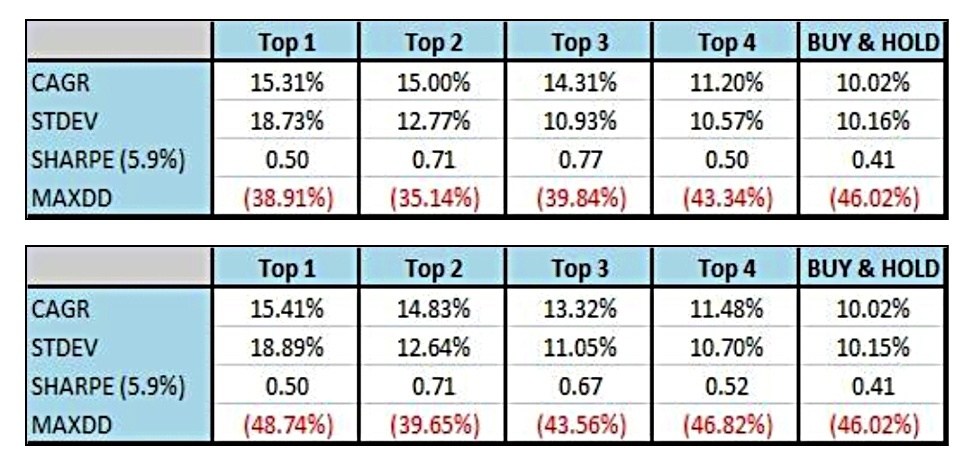
The tables below show the results when looking back 1, 3, 6, 9 and 12 months:
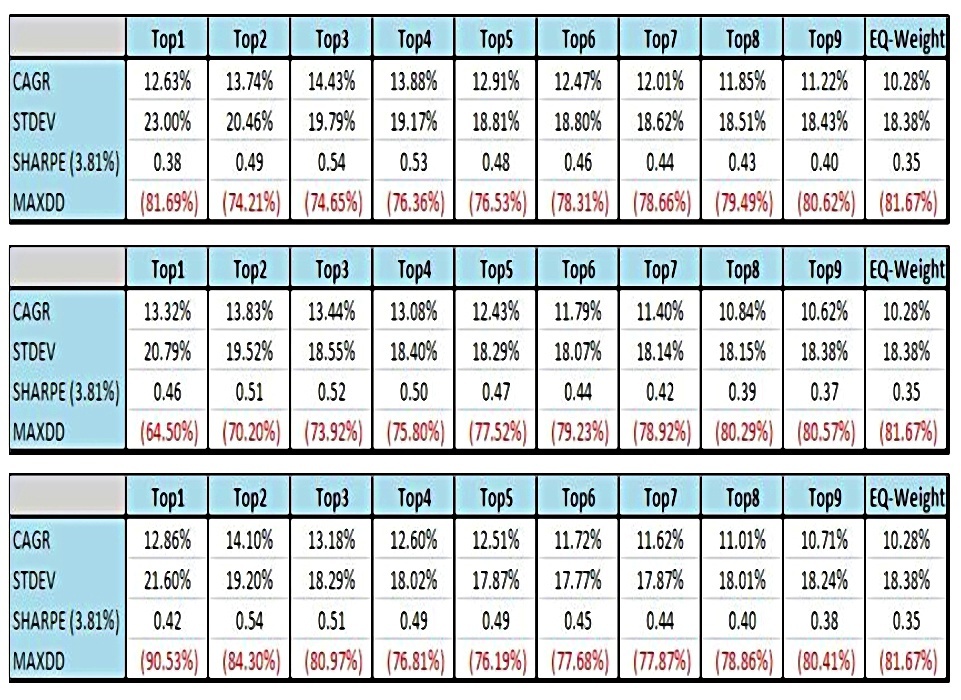
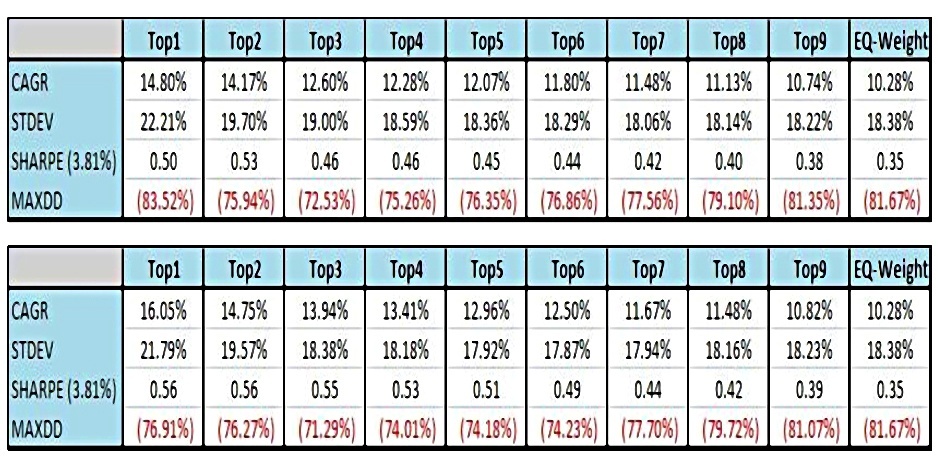
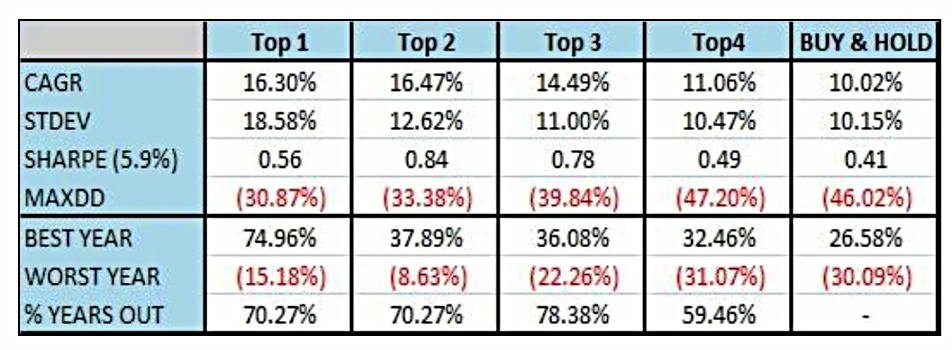
The final table is for a combination of all periods:
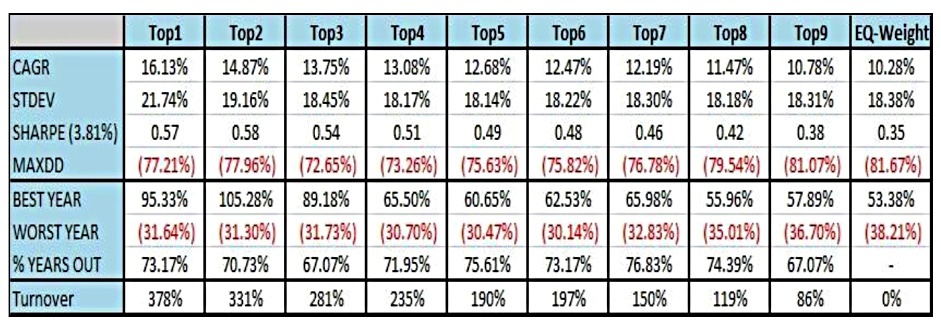
The system works for all periods.
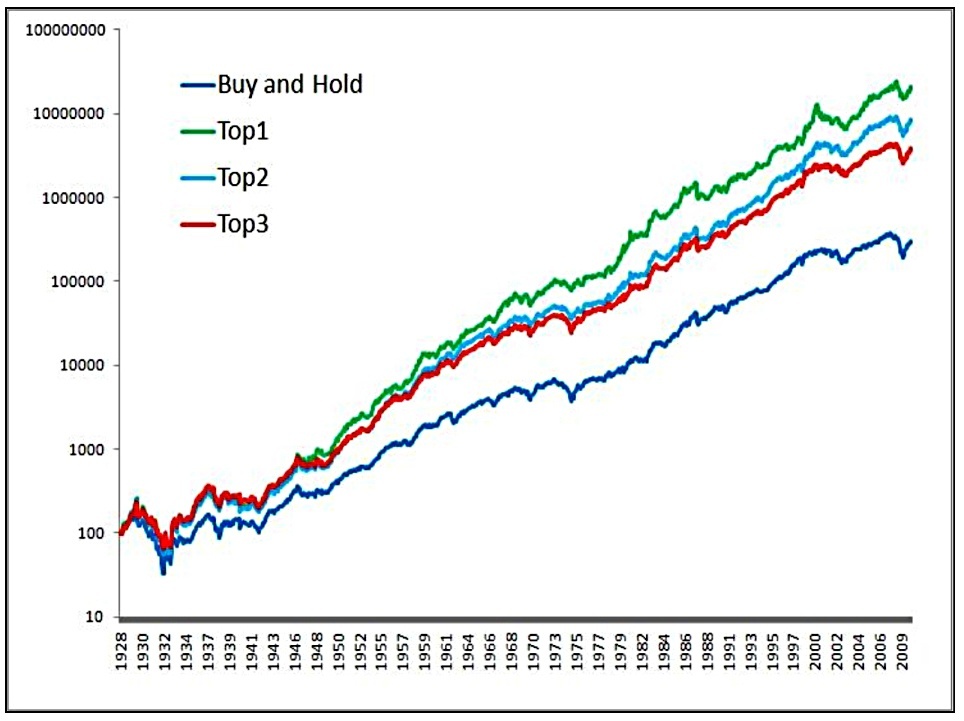
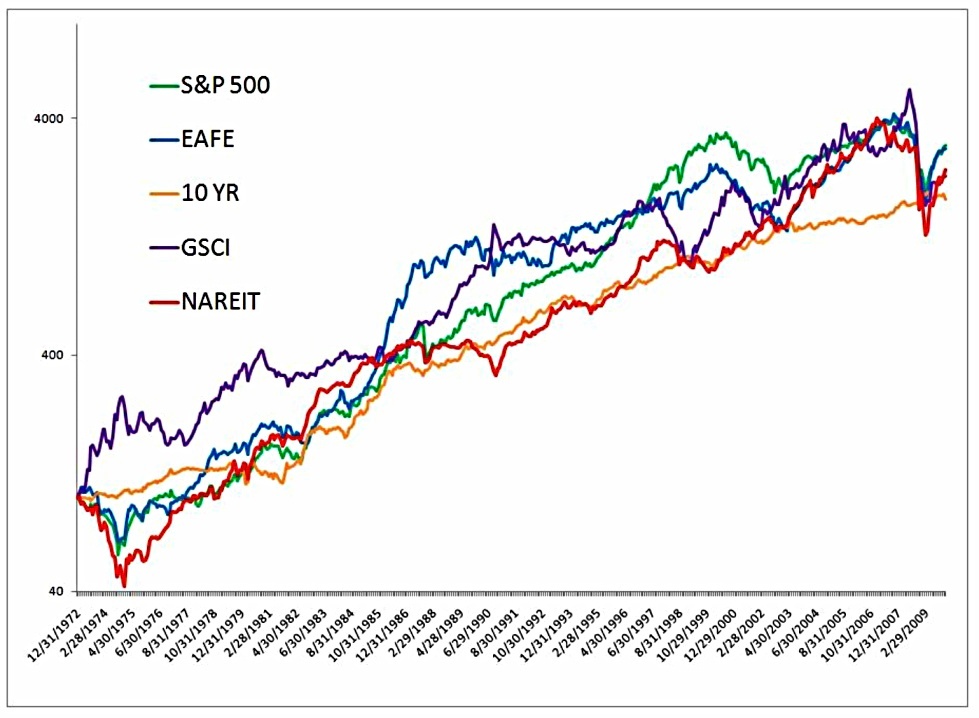
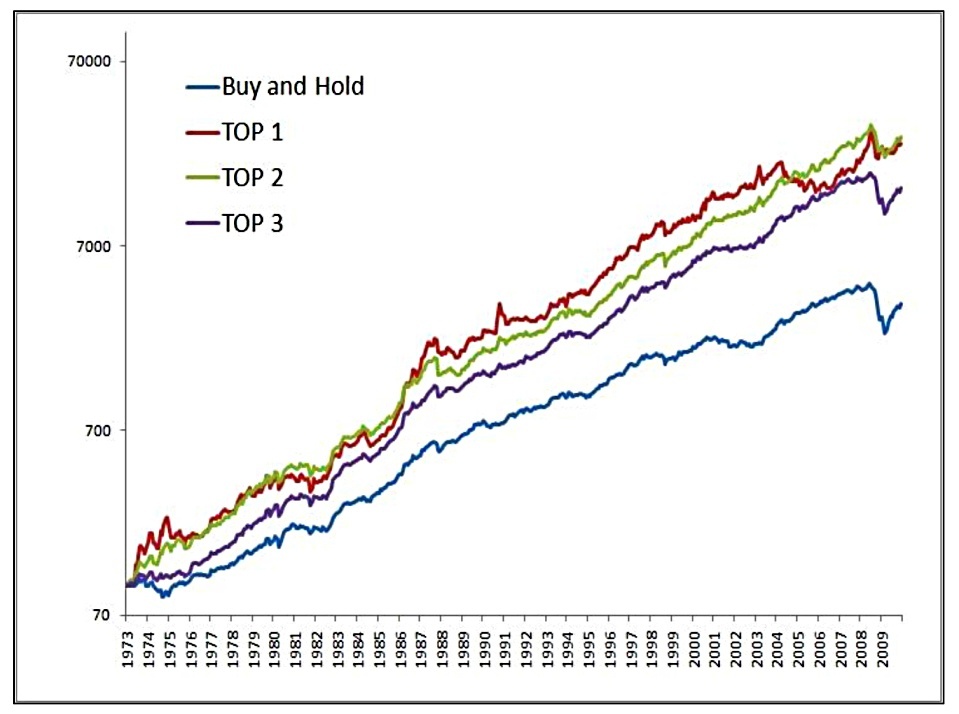
The chart shows the performance of the combination system.
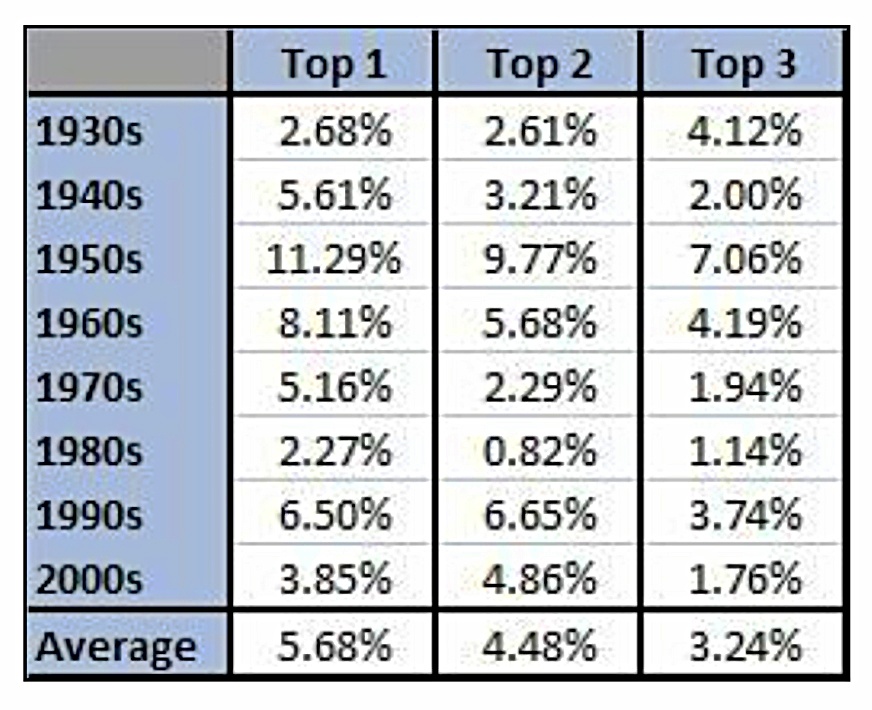
Meb also looks back across the decades, to demonstrate an average outperformance of more than 4% pa in CAGR.
Hedging
The system is long-only, and so exposed to a crash in the underlying assets (in this case, US stocks).
Meb looks at two fixes:
- Hedging (move to cash or use shorts)
- Add non-correlated asset classes
Not surprisingly, the version of hedging Meb prefers is the “dynamic hedging” using moving averages that we saw in the earlier paper.
The portfolios move entirely to 100% cash (T-Bills) when the S&P 500 is below its 10 month Simple Moving Average (SMA).
The hedging largely preserves returns but reduces volatility and drawdowns (though drawdowns are still large).
- Meb says there are similar results from hedging the individual sectors rather than the entire portfolio.

![]()
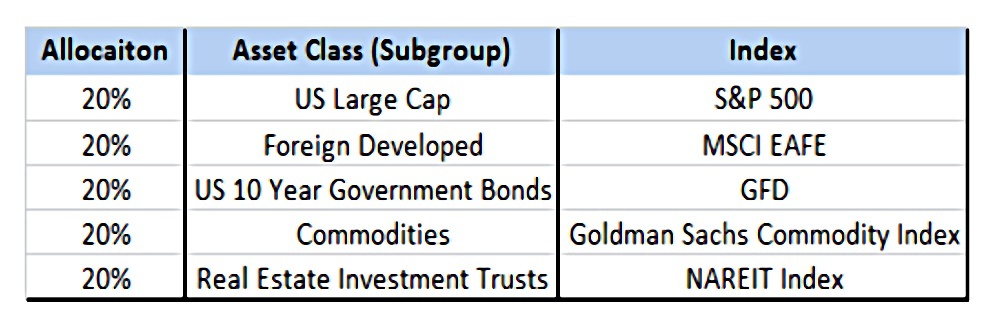
The second fix is to add diversifying global asset classes, as per the previous paper, and as also explained in Meb’s book “The Ivy Portfolio” – the GTAA-5.
- The assets are foreign stocks, bonds, REITs, and commodities.
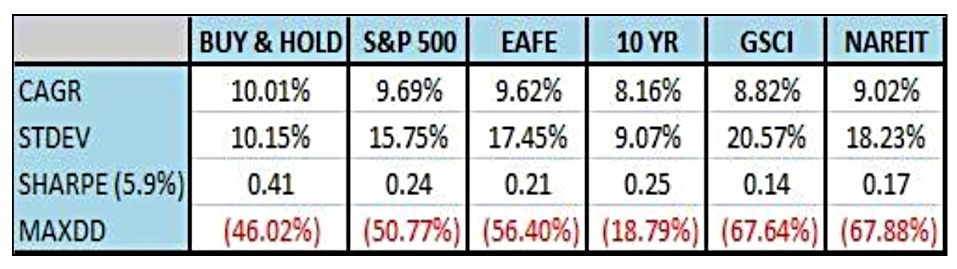
The control portfolio now becomes equal-weighted buy and hold across the five assets.
Here are the results, for 1, 3, 6, 9 and 12 months and the combined version:
The modified system works across all periods.
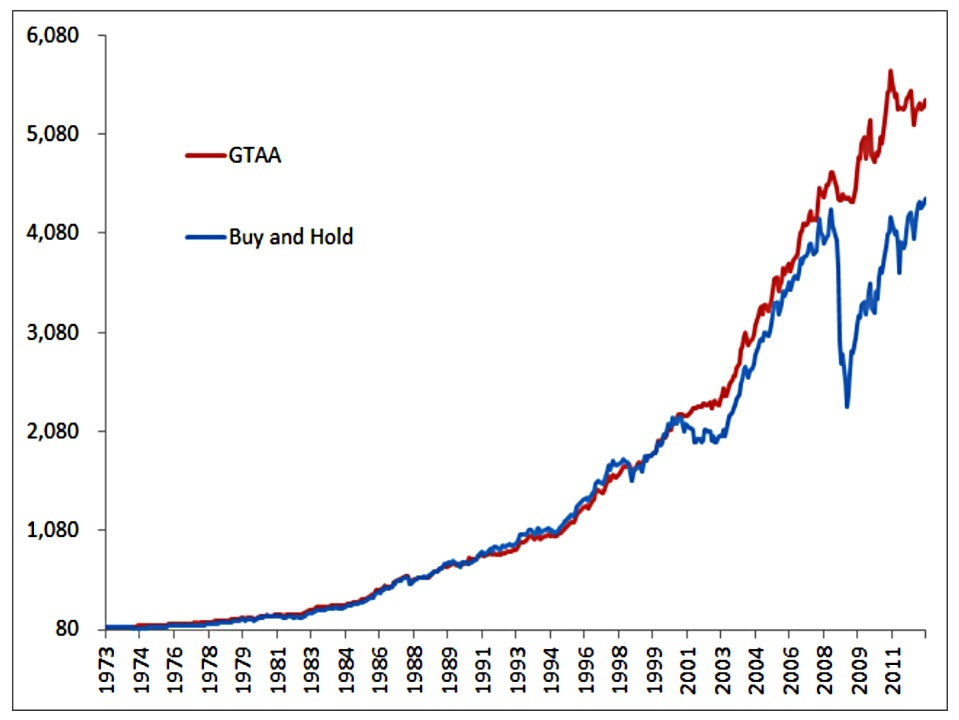
The equity curve is for the combined time periods.
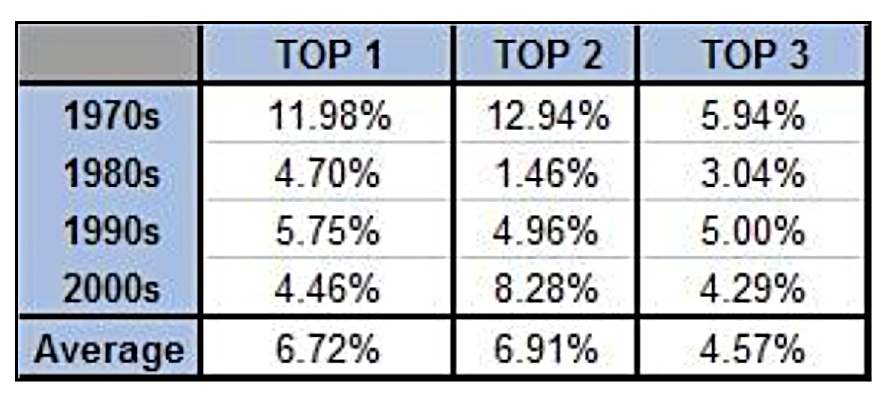
The by-decade table shows an average outperformance of around 6% pa in CAGR.
Conclusion
This paper extends Meb’s earlier paper to a “top N” version of the GTAA-5.
- There’s no mention of leverage and the top-N version of GTAA-13 is not examined.
In practice, I would be tempted to use as many asset classes as possible, and a modest amount of leverage.
- The further you go down this route, the further you move from Meb’s simple GTAA system, and the closer you are to a traditional CTA trend-following system.
But wherever you are on that spectrum, you should do better than buy and hold.
- Until next time.
Mike Rawson
Mike is the owner of 7 Circles, and a private investor living in London. He has been managing his own money for 40 years, with some success.