Rob Arnott – The Two Percent Solution

Today’s post is a profile of Guru investor Rob Arnott, who appears in John Mauldin’s book Just One Thing. His chapter is called The Two Percent Solution.
Contents
Rob Arnott

Rob Arnott is the chairman of Research Affiliates.
- He runs several funds, including hedge funds.
He is also the editor of the Financial Analysts Journal, and has written more than sixty journal articles.

He appears in John Mauldin’s book Just One Thing, in a chapter called the Two Percent Solution.
- It’s about how to get 2% pa more out of the stock market using alternative weightings.
Cap-weighted indices
Rob doesn’t much like the Capital Asset Pricing Model, or the way that is pushes people into market-cap weighted index trackers.
He imagines a crystal ball that provides the future cash flows from any investment we choose.
It lets us calculate the true fair value of every asset in the market, as the discounted net present value of all of these future cash flows.
- Note that we still need to decide what interest rate / rate of return to use in order to justify the risk of holding a stock (and therefore to discount the future cash flows).
But if we don’t know all the future cash flows, each individual asset will be trading above or below fair value.
So the problem with cap-weighted indices (CWIs) is that they over-expose you to assets that are above fair value, and under-expose you to assets that are trading below fair value.
- Since the vast majority of index-trackers are cap-weighted, this is a serious issue.
Equal-weighted indices
With an equal-weighted index (EWI), the same amount of money is put into each stock.
- Using an EWI can eliminate the “return drag” from a CWI, which amounts to 2% to 4% pa.
Rob points out that EWIs don’t outperform CWIs because of any small-cap bias.
- Rather, it’s a valuation thing.
Rob imagines a world with two groups of stocks, each with a fair value of $100.
- One is valued at $50 and the other at $150.
The CWI puts 75% of the money into the overvalued group.
- The EWI buys 50% of each group.
Over the next 10 years, the valuation errors both correct (within the original groups).
- At the same time, other errors are introduced, forming two new groups of overvalued and undervalued stocks.
In this scenario, the CWI returns a net zero.
- The overvalued group loses 33% and the undervalued group gains 100%.
- 75% * 67% + 25% * 200% = 50% + 50% = 100%
The EWI gains 33% (2.8% pa compounded):
- 50% * 67% + 50% * 200% = 33% + 100% = 133%
Size effect
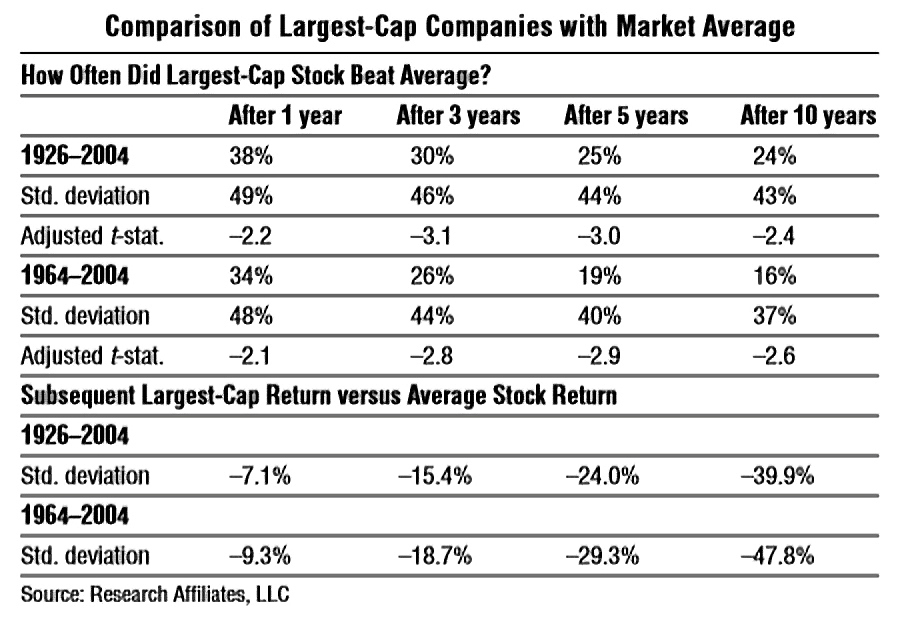
Rob predicts that a size effect will follow:
- Large caps should under-perform small caps, since large caps are more likely to be over-priced.
Indeed the data shows that the largest company usually underperforms (about 80% of the time).
- Over 10 years the underperformance is 40% to 50%.
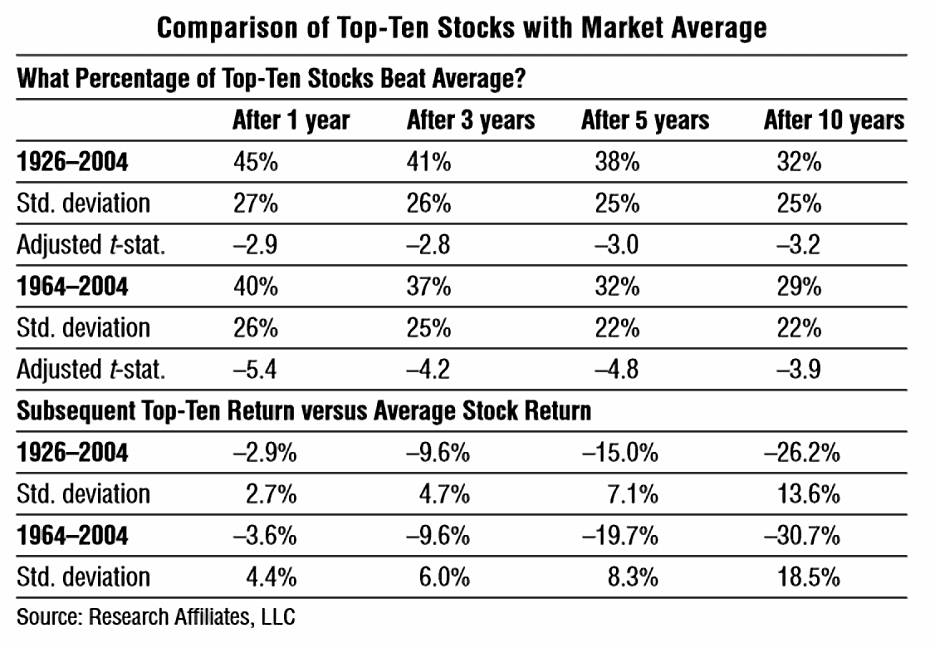
The same is true of the largest ten firms taken as a group.
- On average, seven out of the ten underperform over the next 10 years.
- The average underperformance for the group is 26% over a decade.
CAPM
CAPM proves (subject to some assumptions) that a market clearing portfolio (one that covers the entire market in the right proportions) should be “mean-variance efficient”.
- This means that it is the “ideal portfolio” and cannot be outperformed at lower risk.
The CAPM also says that every asset will have a return that is predicted by the market return.
Rob suggests that the problem with CAPM is that no index that includes everything:
The net present value of all of our respective labors, going into the future. There’s no index like that; it doesn’t exist and it never will.
Such an index would include all infrasructure, and even human capital.
The S&P 500 is not the market, and anyone who says that it’s efficient because it is the market is missing the point: it’s not the market.
Rob also criticises the simplifying assumptions:
- All investors are rational.
- All share the same tolerance for risk.
- Investors can borrow and lend at the same risk-free rate – without limit.
- Investors are all indifferent regarding the amount of leverage in their portfolio.
- There are no taxes.
Beating cap-weighting
Rob makes a few suggestions of how to get away from price, valuation and market capitalisation:
- Book value
- Sales / revenues
- Cash flow
- Dividends
- Head count (( Probably not such a good idea as when Rob wrote the original article ))
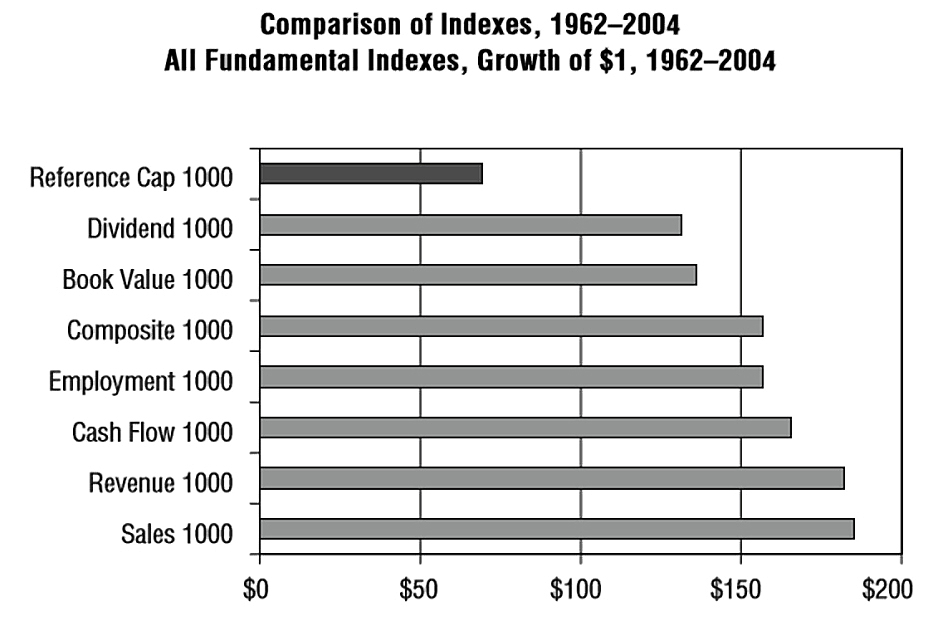
He provides a table comparing such indexes to the market cap 1000 from 1962 to 2004.
- They all beat the market-cap index, which turned $1 into $70.
- The average of the other five returned more than $160.
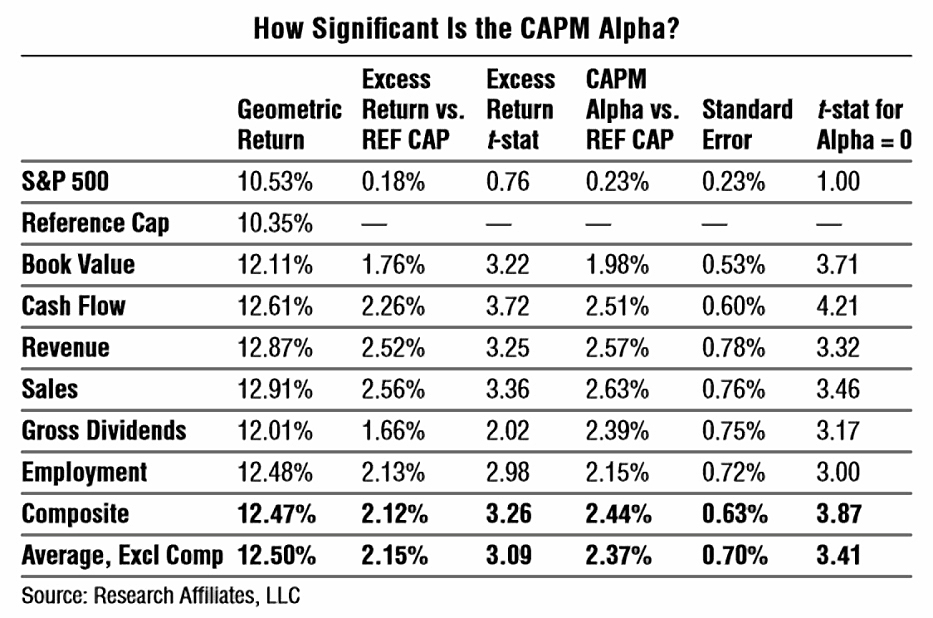
The market cap annual return was 10.4% pa.
- The average of the fundamental indices returned 12.5% pa.
Since the fundamental indices are less risky than the market cap index, the risk-adjusted additional return is close to 2.5% pa.
Market conditions
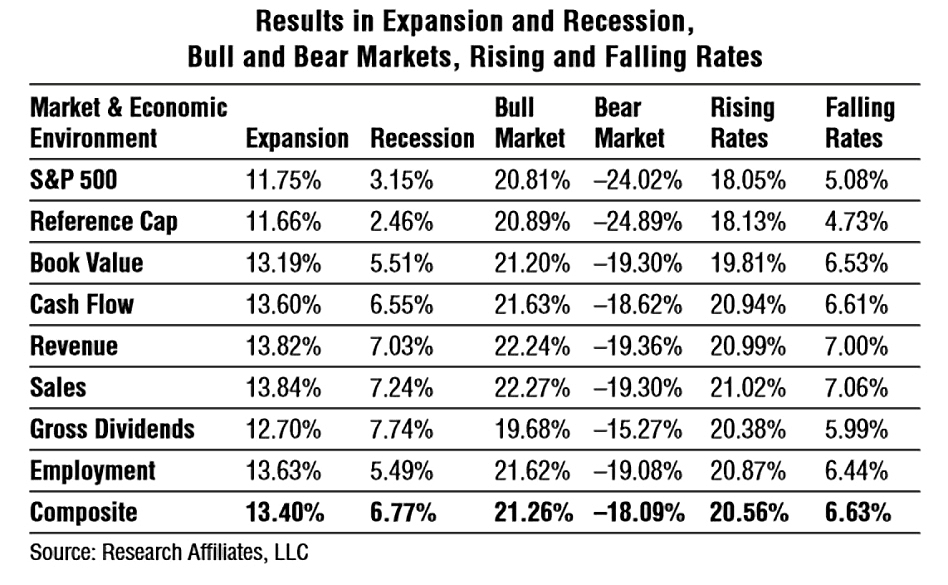
Even better, the excess returns are “only” 2% pa during economic expansions, but are 3.5% pa during recessions.
During a bull market (when psychology takes over from fundamentals) the value add is only 0.4% pa.
- During a bear market the excess returns are 0.65% pa.
When interest rates are rising, the approach adds 2.5% pa.
- When rates are falling, the value add is 1.5% pa.
Thus fundamental indexing compares favourably with value investing, which does not add value during expansions, bull markets, or periods of rising rates.
Conclusions
Rob offers convincing evidence for what was at the time a new type of index.
- He calls fundamental indexing a passive approach, but nowadays it would be lumped into the grey area between passive and active that is known as smart beta.
He is also persuasive that CAPM is flawed because no perfect index exists, and the underlying assumptions are unrealistic.
So where you can, use fundamental indexing rather than market cap indexing.
- It adds 2% pa on average, and works best under difficult conditions.
- Over 36 years, an extra 2% pa doubles your return.
The only situation where you might prefer not to is say in a bull market, when the extra fees on the fundamental fund are more than 0.4% pa.
- But in general it’s a no brainer.
In your portfolios of individual stocks, you should also equal-weight your positions.
- Or at least not cap-weight them.
Until next time.
Mike Rawson
Mike is the owner of 7 Circles, and a private investor living in London. He has been managing his own money for 40 years, with some success.