Transitory Inflation – Research Affiliates

Today’s post looks at a recent paper from Research Associates which examines whether inflation is likely to be transitory from here.
Research Affiliates
The report was published by Research Associates (RA) in November 2022 and was written by Rob Arnott and Omid Shakernia.
History lessons
The report argues that the Fed is being too optimistic about how quickly inflation will return to the 2% target:
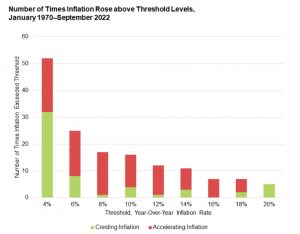
- Whilst 4% inflation often reverts quickly, once inflation is over 8%, it has a 70% chance of heading higher.
- Cresting inflation will usually revert from 4% or 6% by half in around a year.
- RA views 3% pa as the upper bound for “benign sustained inflation”.
- Accelerating inflation takes an average (median) of seven years to revert from 6% to 3%.
- Above 8%, reverting to 3% usually takes from six to twenty years (with a median of more than ten years).
Starting in 1979, Volcker raised rates to 20% – 5% higher than the previous inflation peak.
- It still took two years to halve inflation (to 7%) and six years to get it back down to 2%.
Havranek and Ruskan (2013) found that across 198 instances of policy rate hikes of 1% or more, in developed economies the average lag until a 1% decrease in inflation was achieved was between roughly two and four years.
RA study
RA looked at all inflation surges beyond 4% in 14 OECD countries from 1970 to 2022.
- This lower bound excludes inflation rises that are really a recovery from deflation.
They measure the time taken to:
- Get back to half of the threshold (from 4% to 20%, in two per cent steps)
- To get back below 3%
There are 52 instances of inflation above 4%, of which 6 went on to reach 20%.
The good news is that 60% of the time, 4% inflation doesn’t turn into 6% inflation.
- RA terms these failures to reach the next threshold “cresting” inflation.
- When inflation does reach the next barrier, it is “accelerating”.
The bad news is that above 6%, there is more acceleration than cresting.
- Above 8% (which is where we were in the US at the time the report was written – and even higher in the UK) there was a 70% chance of acceleration.
RA noted in passing that hyperinflation has historically been controlled quickly by ditching the currency in favour of gold or the international reserve currency (dollars at present).
Money is a medium of exchange to buy or sell labor, goods and services, either contemporaneously or intertemporally. Money cannot serve multiple masters.
Nevertheless, central bankers seem eager to promote an array of goals they hope to achieve through monetary policy: price stability, full employment, low servicing costs of government debt, bear market disruption, and so forth.
The halving
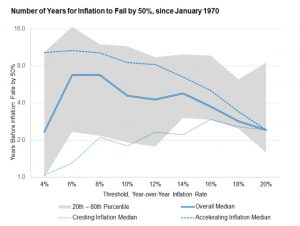
The first test is time for inflation to halve.
The chart shows the middle three quintiles of the distribution (from 20% to 80%) in grey.
- The heavy blue line is the median case.
When inflation was already crossing 4% in April 2021, what were Powell and Yellen thinking in declaring the inflation transitory?
The median at that point was 2.5 years.
The recovery periods for cresting and accelerating inflation are very different.
Cases of cresting inflation dominate the lower reaches of the distribution, while cases of accelerating inflation dominate the top of the distribution.
Cresting 4% halves in one year, but accelerating 4% has a median halving period of ten years!
- Cresting 6% reverts to 3% in 15 months, but accelerating 3% takes 11 years.
So for US inflation to have been described as transitory in April 2021 (when it crossed 4%), we would have had to be confident it was cresting.
Once inflation crossed 8% in March 2022, had we been sure it would not exceed 10%, we could reasonably have expected a return to 4% in about two years. If the next move from here is to new highs, we would be looking at an average decade-long wait to recede to 4%.
The peak “median half-life” for inflation is 7 years in the 6% to 8% range (where we were at the time the report was written).
Back to 3%
Once inflation is above 8%, halving is not really the goal.
- We want to get back to a tolerable level, say 3% pa.
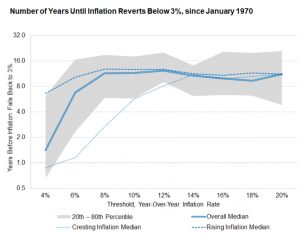
The median time to achieve this rises from 18 months at 4% to more than a decade at 8%.
- From 8% up to 20%, the median ranges between 9 and 12 years.
Given the recent US inflation rate, which has been above 6% for the last 12 months and above 8% for the last 7 months, history tells us that the median number of years to reduce inflation below 3% is 10 years, with a 20 to 80 percentile range of 6 to 19 years.
This risk – of six years of high inflation – doesn’t get much airtime in the financial media.
Behind the curve
The next section of the report digs into the detail of how the Fed has been behind the curve on inflation.
- This will be of interest to those not already aware of the Fed’s failings (and those of all the other central banks).
It was a mistake for the Fed to declare inflation transitory when it was rising rapidly and when history tells us that, even at a relatively modest 4% rate, it often is not transitory.
The Fed inflicted serious damage, both to the macroeconomy and to its own credibility, by following a too-easy policy for a dozen years and then continuing its transitory messaging as inflation lofted past 6%, then 8%. The same messaging continues today, albeit in different words.
Conclusions
We all know that history doesn’t repeat, but there is clearly a non-negligible risk that high inflation hangs around for longer than anyone would like.
- More worryingly, consensus projections for interest rate peaks are now in the 5% area.
Since high inflation is usually only defeated when rates are higher than inflation, we must hope for a natural decline in core inflation to these levels over the next year.
- Until next time.

