Klement on Cassandras

Today’s post looks at a series of articles from Joachim Klement on forecasts of doom and gloom.
Against Cassandras

There are eight articles in total, written over the summer of 2023, so we might need more than one post to look at them all.
The introductory article quotes John Stuart Mill:
I have observed that not the man who hopes when others despair, but the man who despairs when others hope, is admired by a large class of persons as a sage.
In other words, doomsters sell.
The best way to get attention is to make outrageous forecasts of impending catastrophe. That will trigger loss aversion in your audience, and they will pay close attention to your advice because you are the one who knows what the establishment doesn’t.
He also quotes Seneca:
There are more things to alarm us than to harm us, and we suffer more often in apprehension than reality.
Joachim thinks that most doomy predictions are unlikely to materialise.
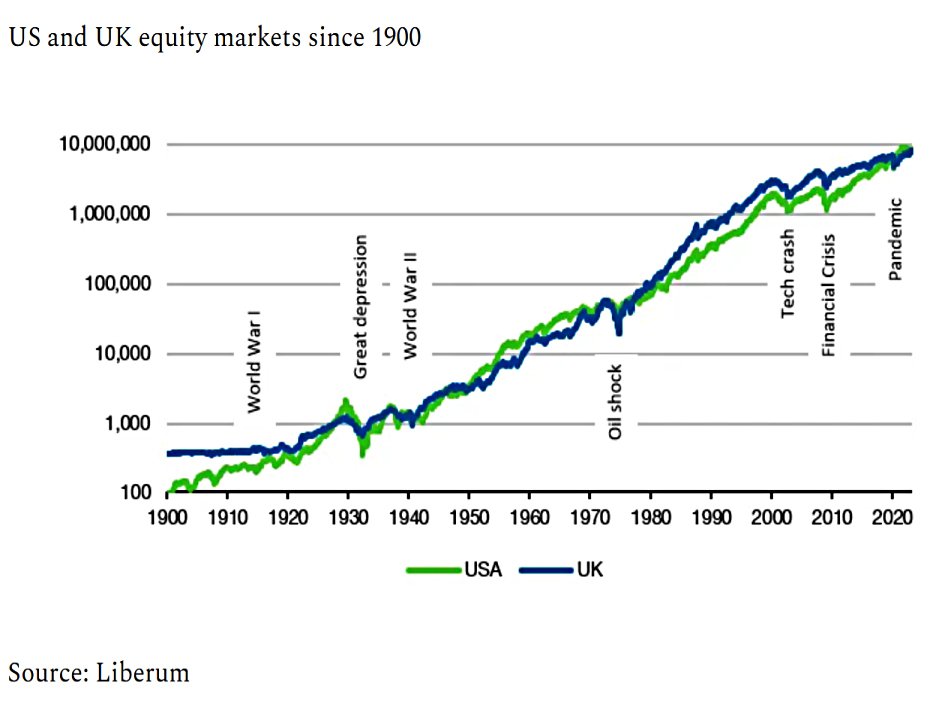
The log scale chart of US and UK stock markets since 1900 shows few bumps:
The only doom-and-gloom events that actually materialised were the Great Depression, World War II, and the Global Financial Crisis of 2008. That is three major events that happened andhad a significant negative impact in 123 years, or roughly once every 40 years.
The dot come bubble of 2000 was widely anticipated, and the oil crisis and 1980s inflation were seen by nobody (including the doomsters). The rule that doomsters forget is:
We rarely fall off a cliff. People often change their habits at the last minute before a catastrophe happens, but for behavioural change to happen the catastrophe must be salient, the outcome must be certain, and the solution must be simple.
Or as he puts it more simply, what cannot happen will not happen.
Joachim makes us a promise:
I will become shamelessly optimistic and give you all the reasons why it is unreasonable to be pessimistic. Call it a good news summer.
I could do with some optimism, so let’s get started.
Interest rate normalisation
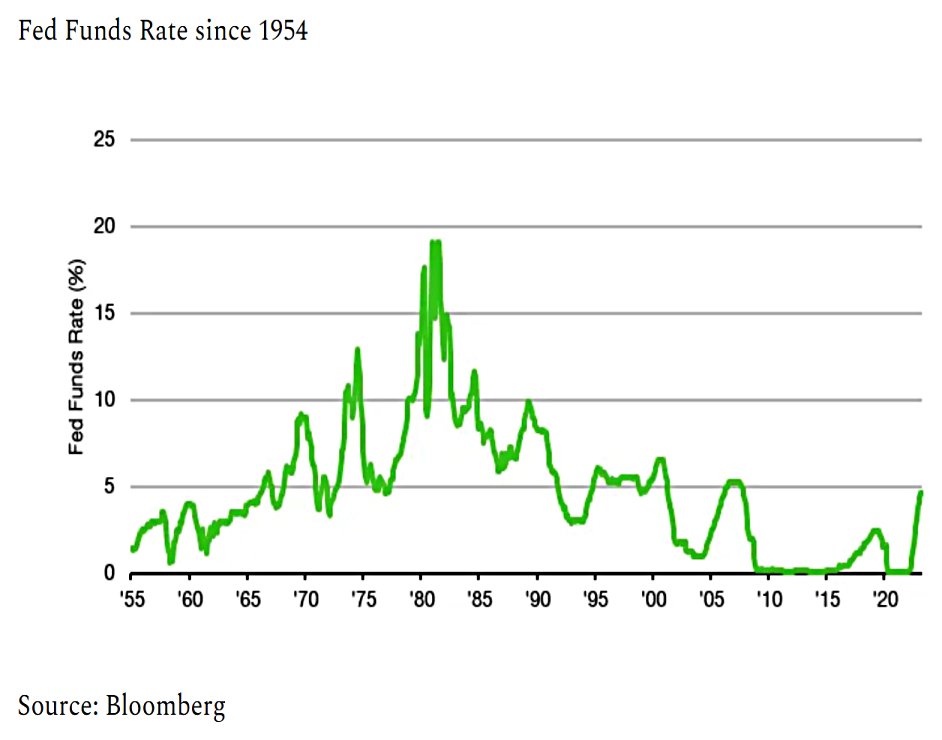
The second article looks at whether short-term interest rates can “normalise” back to 5% or more, as in the 1970s to 1990s.
Joachim is of the opinion that the consequences of such normalisation would be too severe for it to happen.
I think that inflation will decline slowly (slower than the market expects at the moment) and that the Fed will eventually cut interest rates.
The danger is that the Fed cuts too soon (whilst inflation is still high):
It will likely create a spike in demand-driven inflation in 2024 that forces the Fed to hike
interest rates once again, but this time starting from levels around 3-4%, not 0%.
This is what happened in the 1970s, leading to sky-high interest rates in the 1980s to fix things.
- Of course, the Fed knows this and has publicly stated that they want to avoid repeating this mistake.
If the Fed doesn’t cut for many years (perhaps because inflation doesn’t fall), the problem is that we have higher debt today than we had in the 1970s and 1980s.
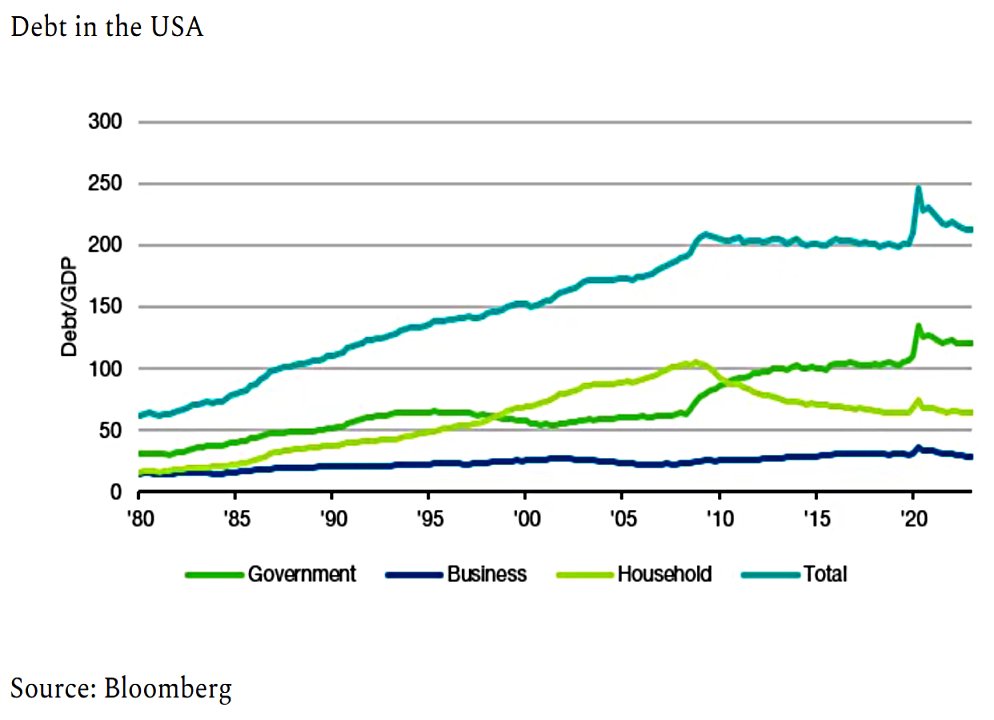
Government debt and household debt have quadrupled since 1980 while business debt has doubled. The true weakness lies in business debt. The government can print money to pay for its debt while businesses and households cannot.
With high-interest rates, businesses have low profits (from repayments) and/or carry out less investment.
- Households have lower disposable income and thus consume less.
Joachim compared investment at Fed Funds rates of 3%, 5% and 10%:
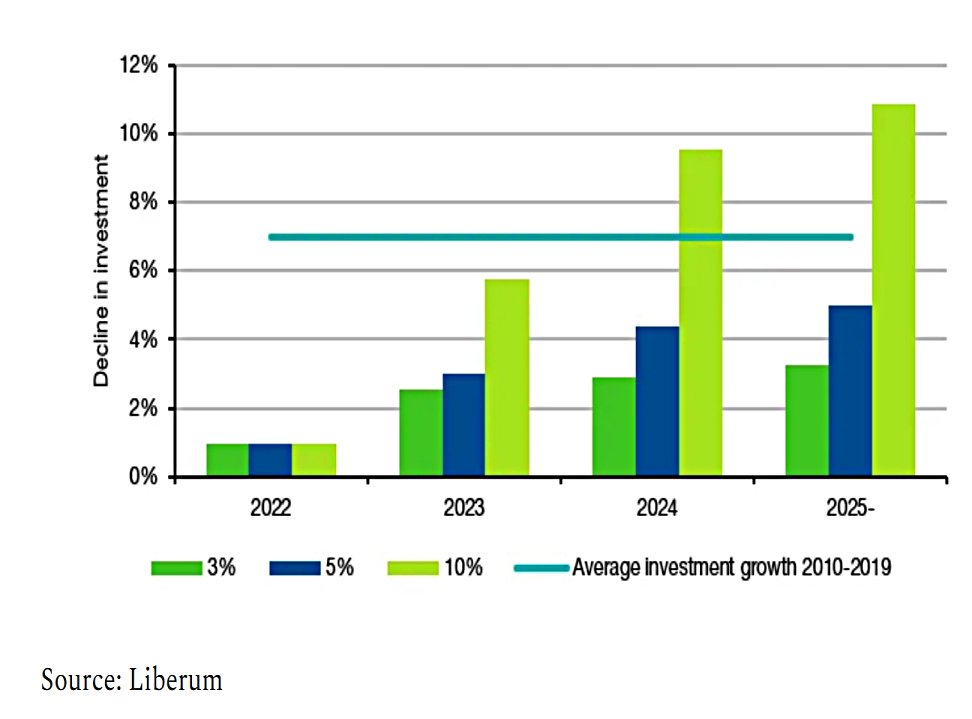
If interest rates remain at 5%, about half the money that is typically invested in new projects would need to be diverted to service existing debt. If interest rates go to 10% investment growth would practically be reduced to zero because by 2025 the money would effectively be needed to pay for debt rather than being invested in new projects.
Lower investment and lower household consumption would lead to a deep recession, which would lead to rate cuts.
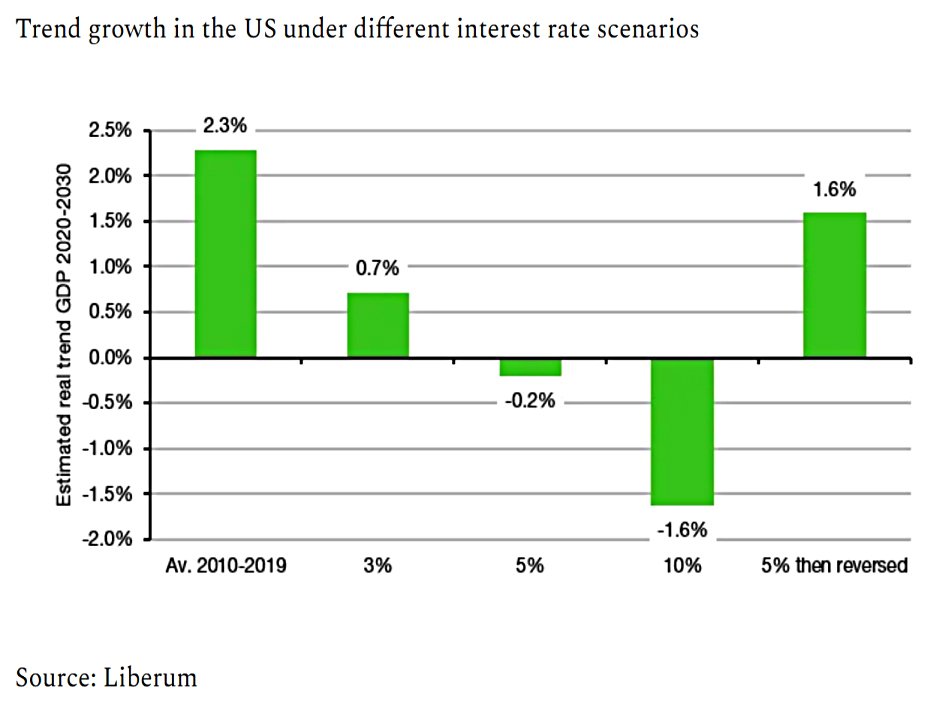
At 5% interest rates US trend growth turns negative.
The only way forward is one where the Fed keeps interest rates at 5% this year and then drops it back to the 1-3% range. Any persistent Fed Funds Rate above 3% would damage US growth so much that it cannot be defended for more than a year.
The situation is similar to the 1950s when debt was very high because of World War 2.
Government Debt
In 1764, David Hume worried about the UK’s unsustainable debt.
His conclusion was that the government would have to either raise taxes to pay for all that debt or default if it became too large.
The debt has grown a lot in the subsequent 260 years, but the UK is one of few countries never to default, and Sterling just about clings to a place in the top five traded currencies.
If the consequences of an action are too extreme and too painful, people will find ways to turn away from the precipice and change course. The UK has done that for 260 years by changing policies that sometimes were more austere and aimed at reducing debt while
being more spendthrift at other times.
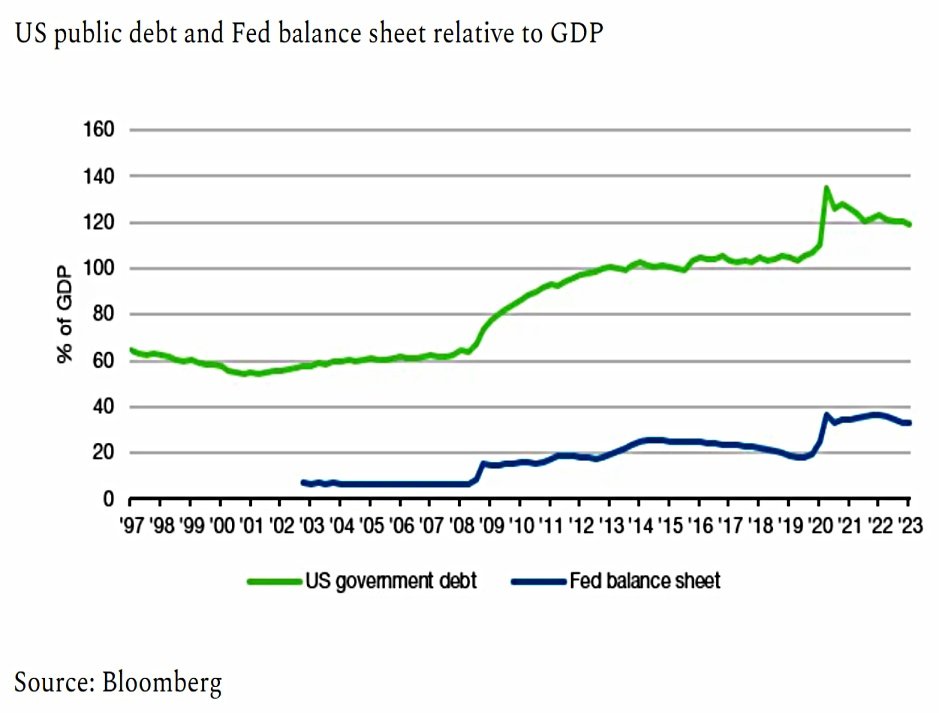
US debt has grown dramatically, and because of QE, so has the Fed balance sheet.
- But because of low-interest rates, the cost of servicing the debt has remained low (and is lower than in the 1980s or 90s, compared to GDP or tax revenue).
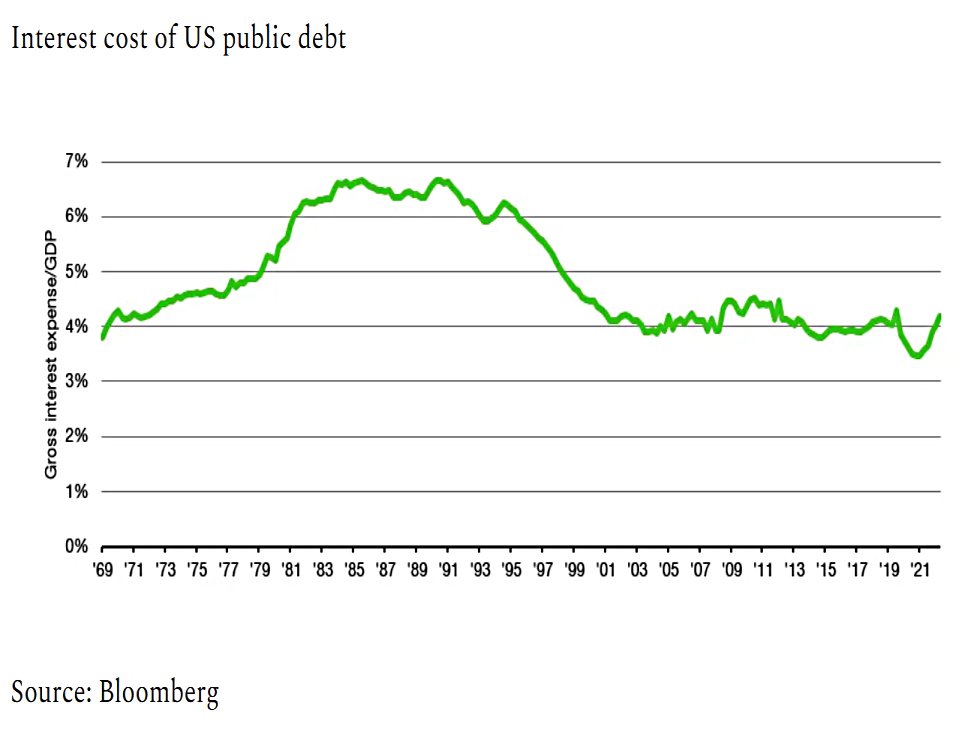
This feeds back into Joachim’s argument that higher interest rates are not possible at today’s debt levels.
Were the international investment community to lose confidence in the ability of the US government to repay its debts, the risk premium on long-term debt would rise.
- This happened to Greece in 2010 and was solved by the central buying long-term bonds to force the price up and the yield down.
This is effectively what the Fed has been doing anyway, as the growth of its balance sheet shows.
Though the Fed hasn’t explicitly monetised US government debt, it has effectively done so through its open market operations.
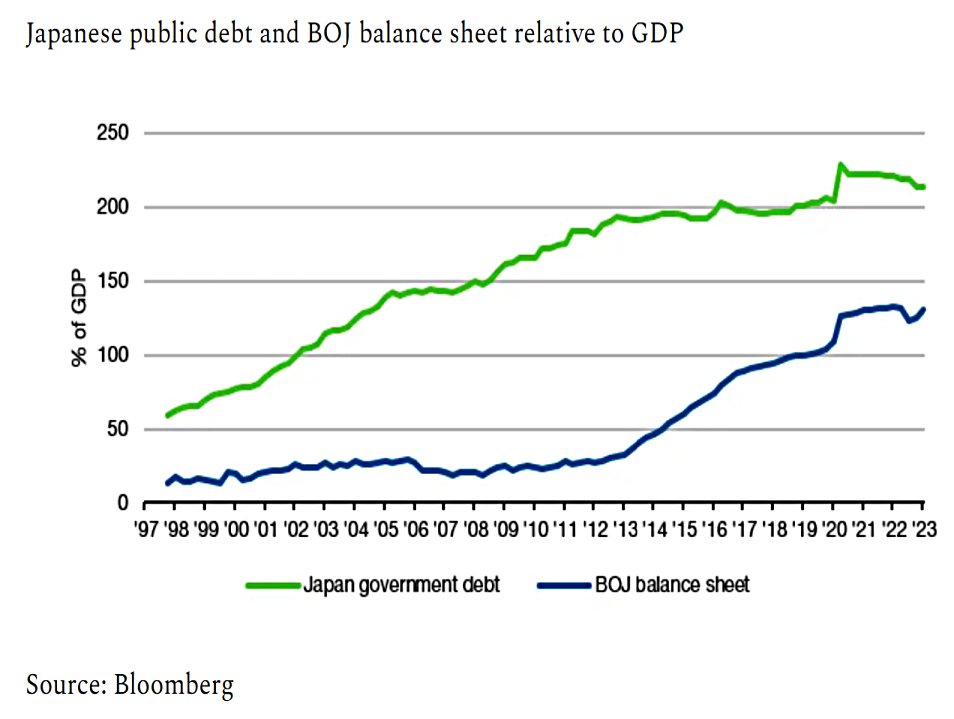
If you want to know our future, look at Japan. The Japanese government has a level of debt that should have led to a catastrophe long ago.
Japan hit the current US level of debt to GDP twenty years ago.
The balance sheet of the Bank of Japan is not 33% of GDP as for the Fed, but 131% of GDP. The BOJ has been monetising Japanese government debt for three decades now without any negative consequence for government debt or without creating runaway inflation.
Japanese monetary policy targets 10-year bond yields to keep long-term interest rates low (and hence stimulate demand and inflation, though this hasn’t worked very well).
People argue that Japanese government bonds are held mostly byJapanese people, not foreigners. Foreigners are more likely to lose trust and sell government bonds if they feel they are too risky. This is correct, which is why countries other than the US need to have fiscal discipline.
Joachim cites Liz Truss’ unfunded tax cuts as an example of what not to do.
- But the issue’s the global reserve currency and foreigners have to hold dollars (ie. US Treasuries).
The other argument for Japan being a special case is demographics.
Because the Japanese population is so old and old people hold more bonds, the demand for government bonds remains high and the government can always rely on having enough buyers for its debt.
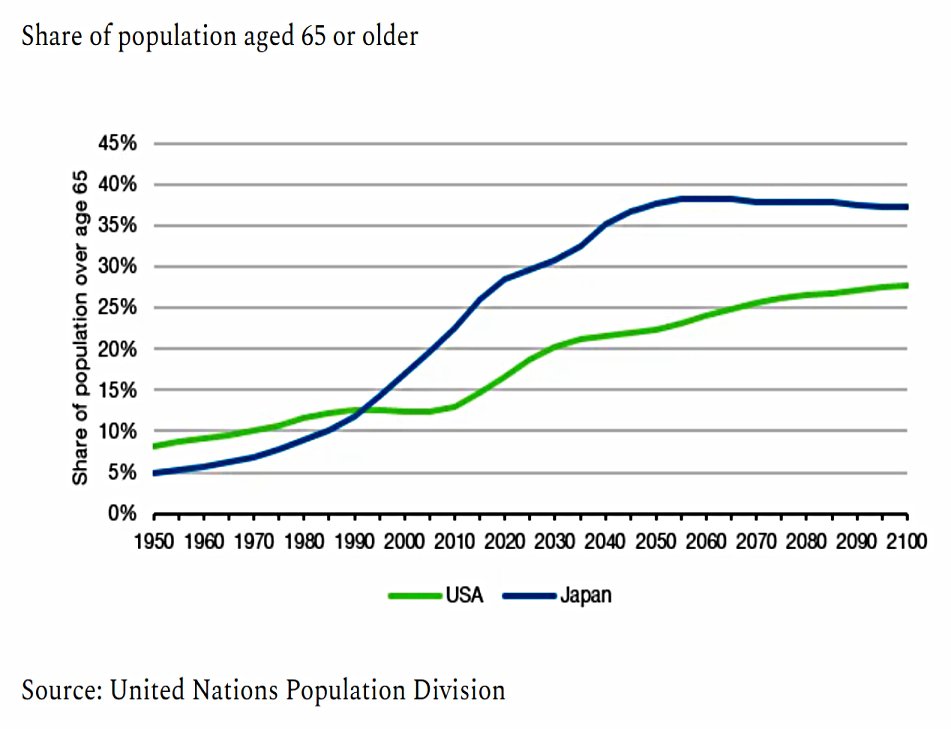
The demographic challenges of Japan are enormous, but I would argue that the US and Western Europe don’t look that much different.
As the boomers retire, the theory would be that demand for US treasuries would increase (I’m not convinced that pensioners should hold a lot of bonds, but that’s the argument for Japan being a special case).
The example of Japan shows that much higher levels of debt than what the US or Western European countries have today can be sustained for decades. The case study of the UK shows that the day of reckoning may be centuries in the future.
Collapse of the dollar
Article number four looks at the potential collapse of the dollar as the currency used in global trade.
The most recent episode of the ‘Dollar is going to collapse’ story has been triggered earlier this year by an agreement between Brazil and China early this year that allows imports and exports to be cleared not just in Dollars and Euros, but also in Yuan.
Joachim’s first point is that China has strict capital controls (and ironically, pins the Yuan to the dollar).
Even if Brazilian exporters would accept Yuan, whatare they going to do with it? They can’t use it domestically to pay their workers. They can’t convert it straight back into Real or other currencies [becasue of capital controls]. And they probably don’t want to invest the Yuan in China.
So why bother?
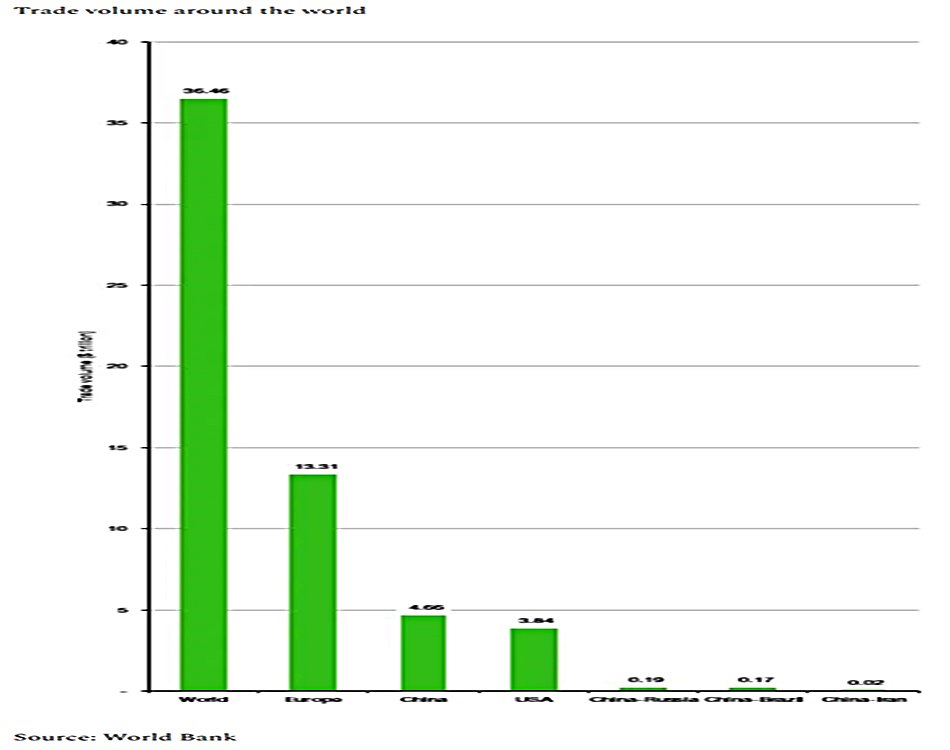
Joachim’s second point is that Chinese trade volumes with Brazil, Russia and Iran are tiny in the context of global trade.
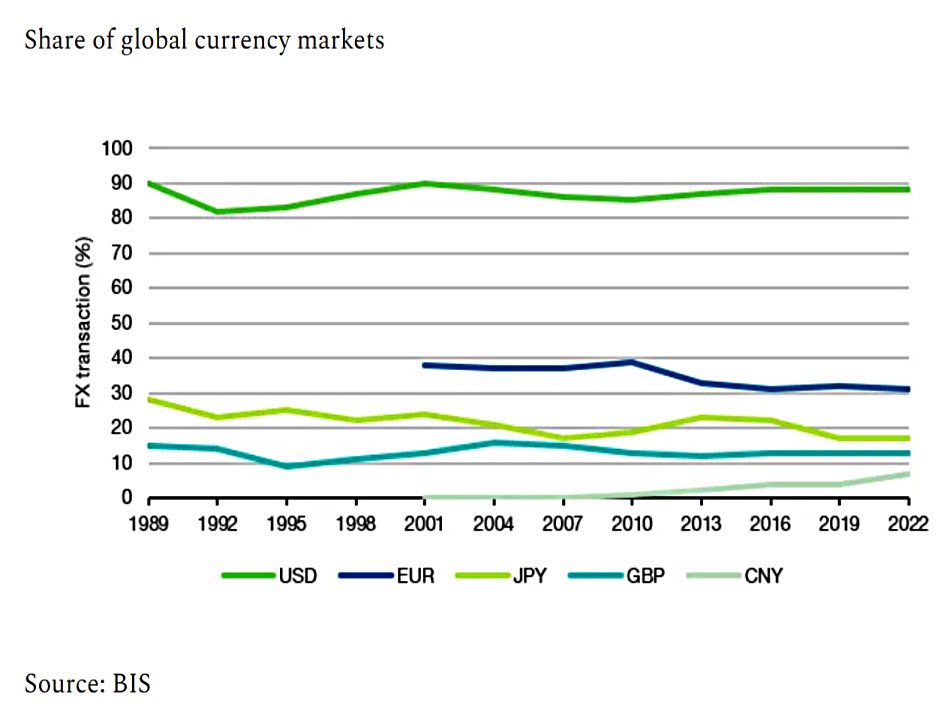
Nor has the Yuan made much progress in its share of FX trades, despite almost doubling between 2019 and 2022.
- The Yuan now has a 7% market share, compared to 90% for the dollar (I think both sides of each trade are counted here so that the total is 200% rather than 100%).
When it comes to global currency markets, the Yuan is an also ran, roughly as important as the Australian Dollar or the Canadian Dollar.
Joachim thinks it will take until 2075 for the Yuan to catch up with the dollar.
The third issue is whether China can tank the dollar (and Treasuries) by selling its holdings.
I have called this the stupidest argument in economics. China holds $849bn in US Treasuries (as of April 2023) and is the second largest foreign holder of US Treasuries. But the Fed alone holds more than $5,000bn in US Treasuries. Markets would hardly move if China dumped all its holdings.
In the first four months of 2023, the Fed (which now claims to be running down its balance sheet, though we’ll see how far it gets) sold $235bn of Treasuries.
The result was an S&P 500 that was up 7.5% and a US Dollar that declined a massive 1.7%.
We’ll leave it there for today.
- We’ve covered four of the eight articles and we have four more to look at.
Until next time.
Mike Rawson
Mike is the owner of 7 Circles, and a private investor living in London. He has been managing his own money for 40 years, with some success.