VCT Universe 2 – The Results

A couple of weeks ago we looked at the data available on the VCT Universe. Today we’ll see what the results show.
Contents
Government statistics
Since the first post, I’ve found a bit more data on VCTs.
I have two reports from HMRC, each entitled “Venture Capital Trust Statistics”.
- I have a version called Table 8.6 that dates from October 2017 (so it covers up to tax year 2016/17).
- And I have Table 8.9 from December 2017 (for some reason, this looks at 2013/14 to 2015/16).
The data seems to depend on figures from outside government control and so they are classified as Official Statistics rather than National Statistics.
Table 8.6

Here’s how HMRC describe the document:
This publication provides information regarding the number of Venture Capital Trusts (VCTs) operating each tax year and the amount of funds they raise during this period.
The document makes four key points:
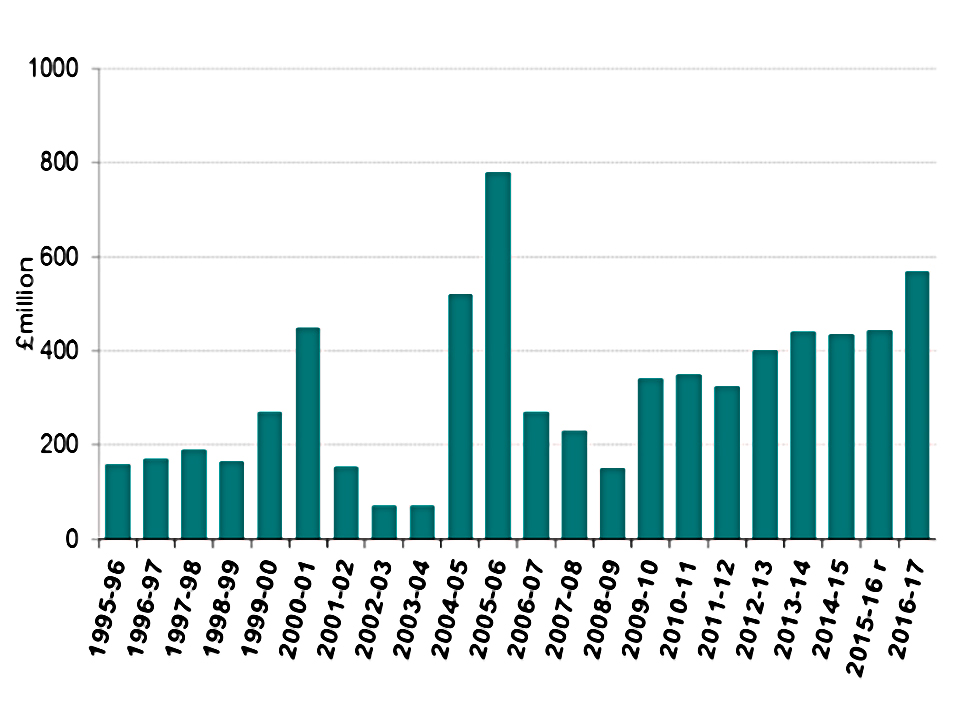
- Venture Capital Trusts (VCTs) issued shares to the value of £570 million in 2016-17, a 28% increase from 2015-16 (£445 million) and the highest amount raised since 2005-06.
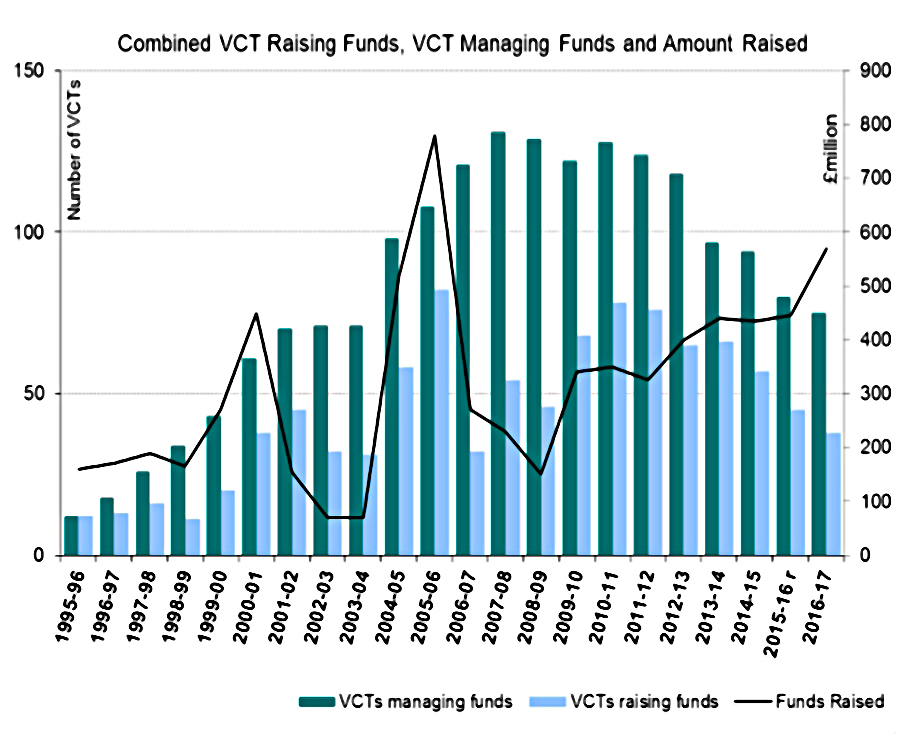
- The number of VCTs raising funds has declined in recent years. In 2016-17 there were 38 VCTs which raised funds, down from 45 in 2015-16 and 57 in 2014-15.
- The number of VCTs managing funds has fallen from 80 in 2015-16 to 75 in 2016-17.
- Since the introduction of VCTs in 1995 they have raised approximately £7 billion of funds.

The report contains four charts and tables, reproduced here:
- A table showing funds raised, funds making raises, total number of VCTs and the prevailing rate of income tax relief.
- A chart of funds raised by year.
- The same chart with number of raises added.
- The same chart with number of VCTs added.
The peak years for money raised were 2004-05 and 2005-06, when income tax relief was at 40%.
- The total then fell back when the first wave of pension freedoms were introduced, and tax relief was cut back to 30%.
The amount raised is going up again, as pension contribution restrictions bite.
- The current tax year might possibly set a new record.
So far, the national story is very similar to my personal VCT story.
The other interesting trend is that the number of funds and the number of raises are both falling.
- The trend is for fewer, larger raises by the bigger VCTs.
HMRC has 75 VCTs open in 2016-17, which is a close enough match to our total of 80 (in 2017/18).
Table 8.9
Here’s how HMRC describe this report:
This publication provides statistics on the distribution of the amounts invested under the Venture Capital Trust (VCT) scheme by investors claiming income tax relief.
It also provides figures on the total amount invested under the scheme broken down by the size of investors’ investments.

Here are the key points from the report:
- In 2015-16, Venture Capital Trust (VCT) investors have claimed Income Tax relief on £430m of their investment, a £24.3m (6%) increase compared with 2014-15.
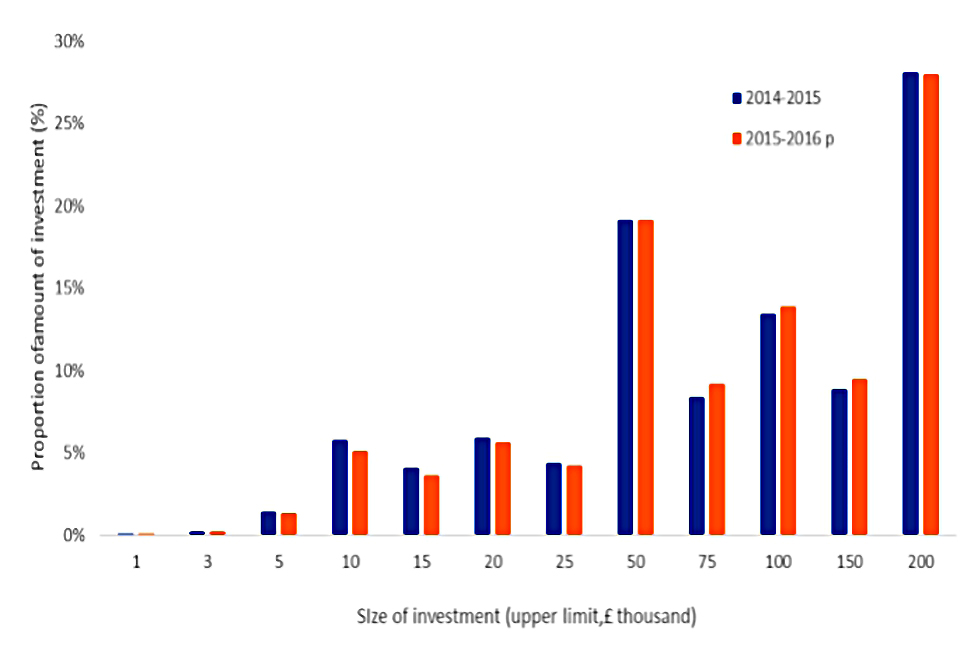
- The majority of VCT investors tend to invest smaller amounts into VCT funds. In 2015-16, 43% of investors made a claim for an investment of £10,000 or less and only 7% invested above £100,000.
- Amounts invested between £150,000 and £200,000 accounted for over a quarter (28%) of the total amount of investment in 2015-16.
- The distribution of investors and amounts of investment in 2015-16 are similar to recent years. For all years since 2004-05, those investing £10,000 or less have represented the largest group of investors.

The report has three tables and charts, reproduced here:
- A table of the distribution of investments across three years.
- A chart showing the distribution of investors (for the last two of the three years).
- A chart showing the distribution of investments across the same size categories (and the same two years).
There are two key takeaways:
- Small VCT investors (<£25K pa) make up most of the investors.
- Large investors (>£25K pa) make up most of the money invested, and claim most of the tax relief.
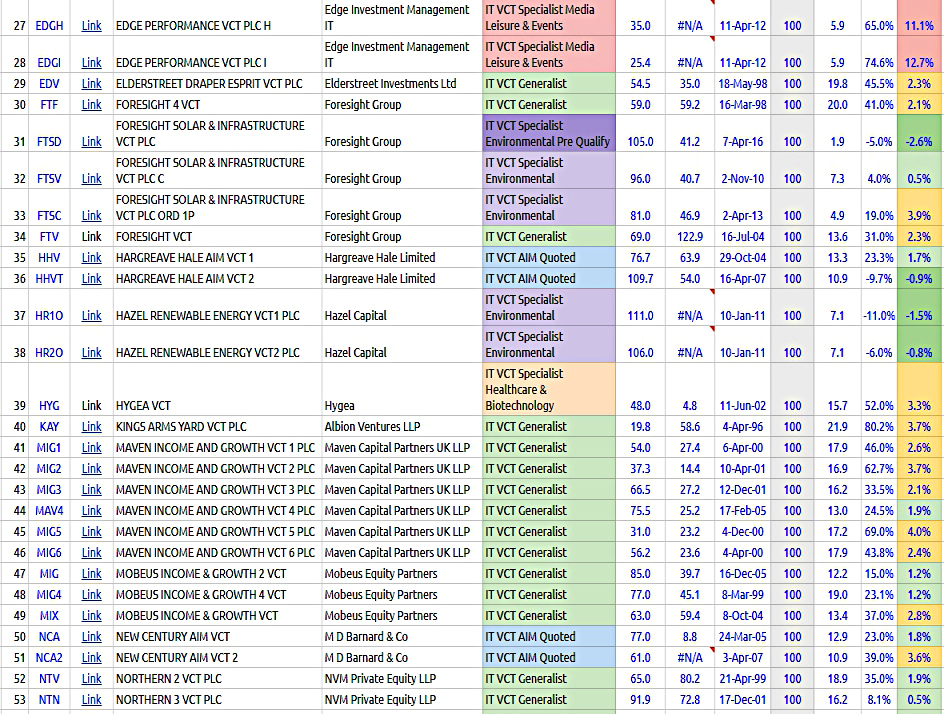
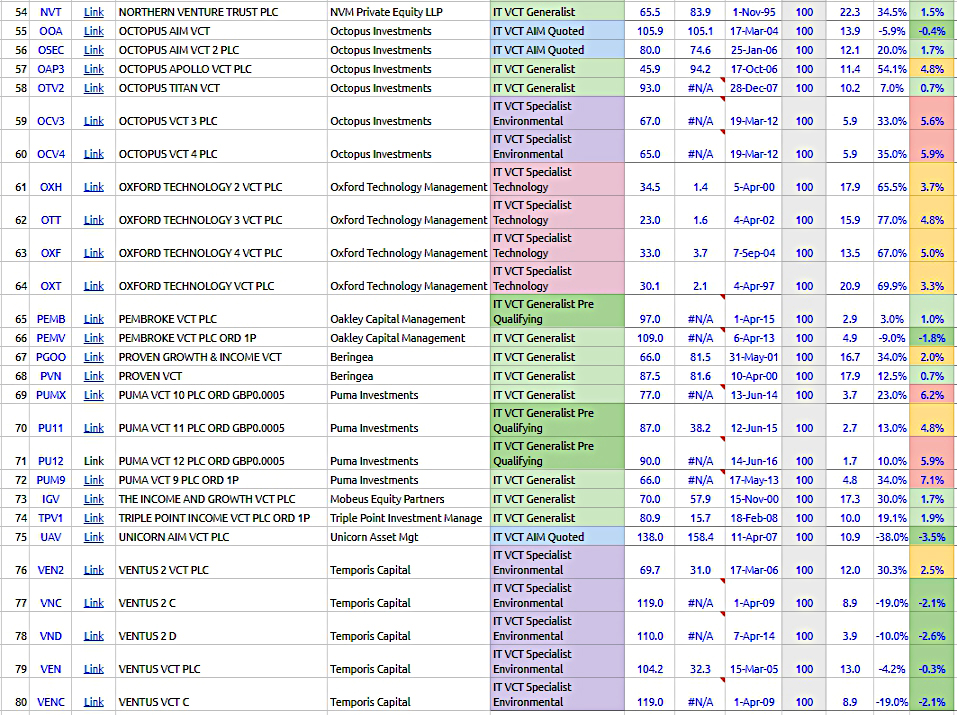
VCT Universe
Back to our own data.
- At the end of the last article, we had a table of 80 VCTs for which Google Finance was returning a live share price.
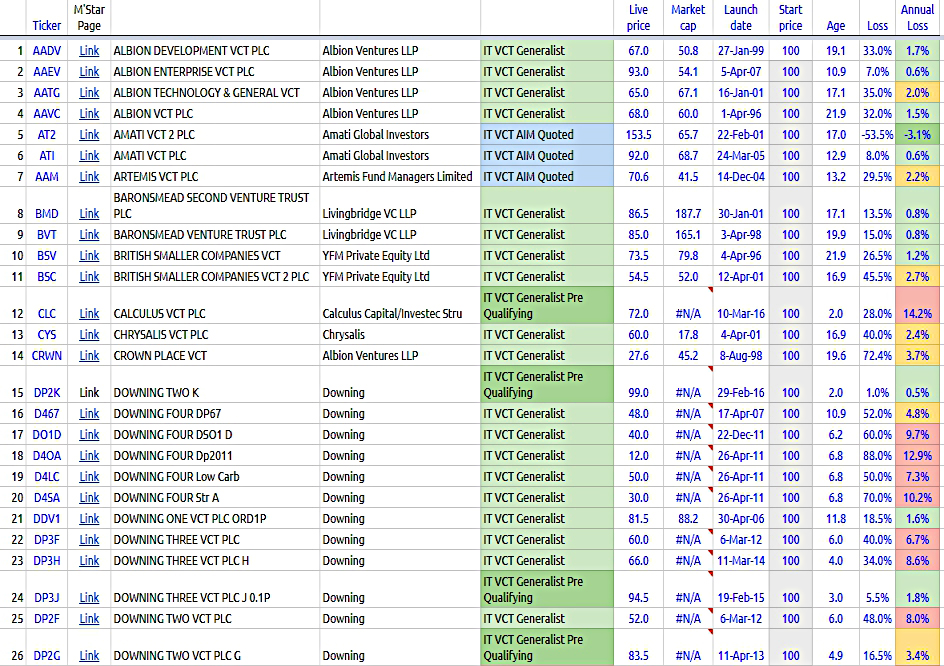
The first step was to add all the launch dates from Morningstar.
- Then I could work out the age of each trust, and – by assuming a launch price of 100p – the annual rate of decline (or growth) in the share price.
- I colour coded this rate of decline.
I also added market cap from Google where that was available.
Here’s the sheet with the extra data:
Upload to Stockopedia
Uploading this list of funds to a new Stockopedia portfolio was relatively straightforward.
- Stockopedia provide you with a .csv template to complete.
I added stock codes for all 80 VCTs on the list, plus the transaction data for the 13 VCTs I currently own, and up it went.
- Once inside Stockopedia, I had to fiddle around with cash to account for tax relief, dividends received and the EIS fund which is not listed.
- DP3F was not found in the Stockopedia data, and has been removed from the master table.
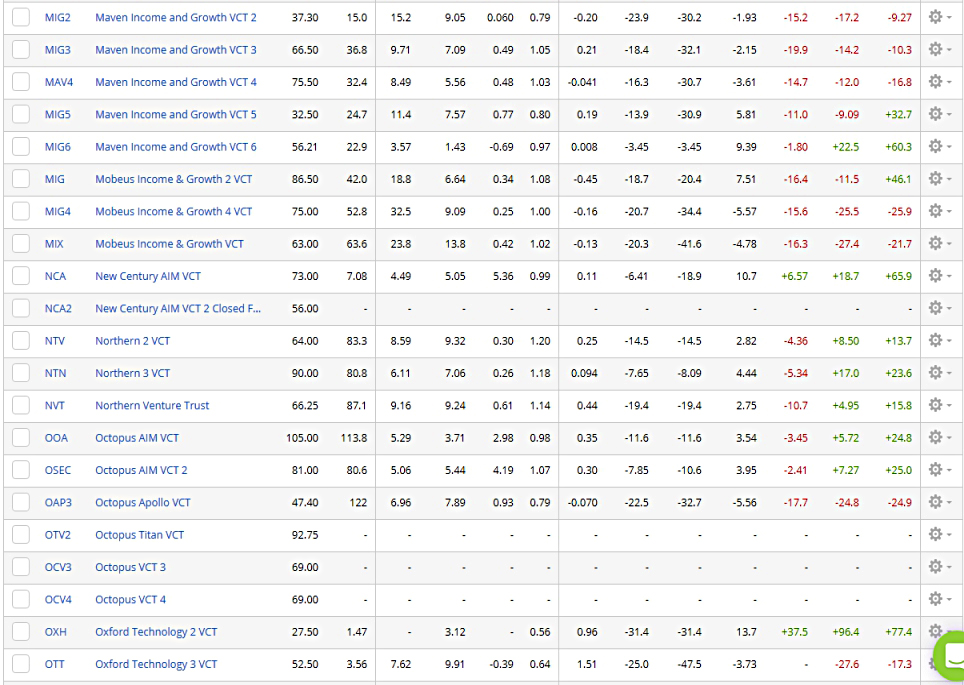
Here’s the Stockopedia version of the portfolio (79 VCTs, in alphabetical order):
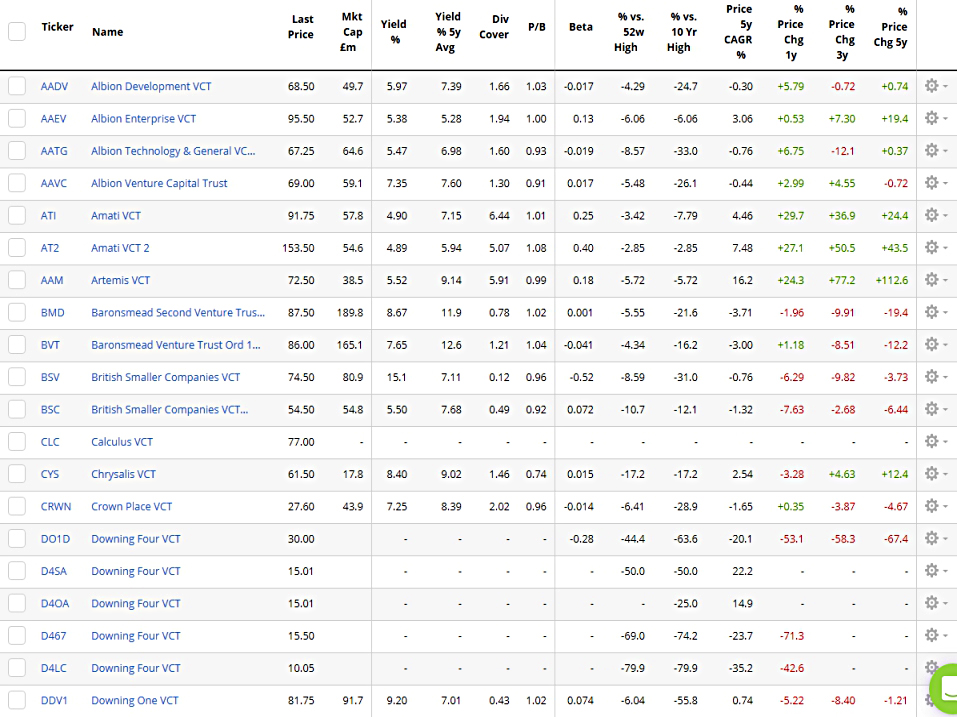
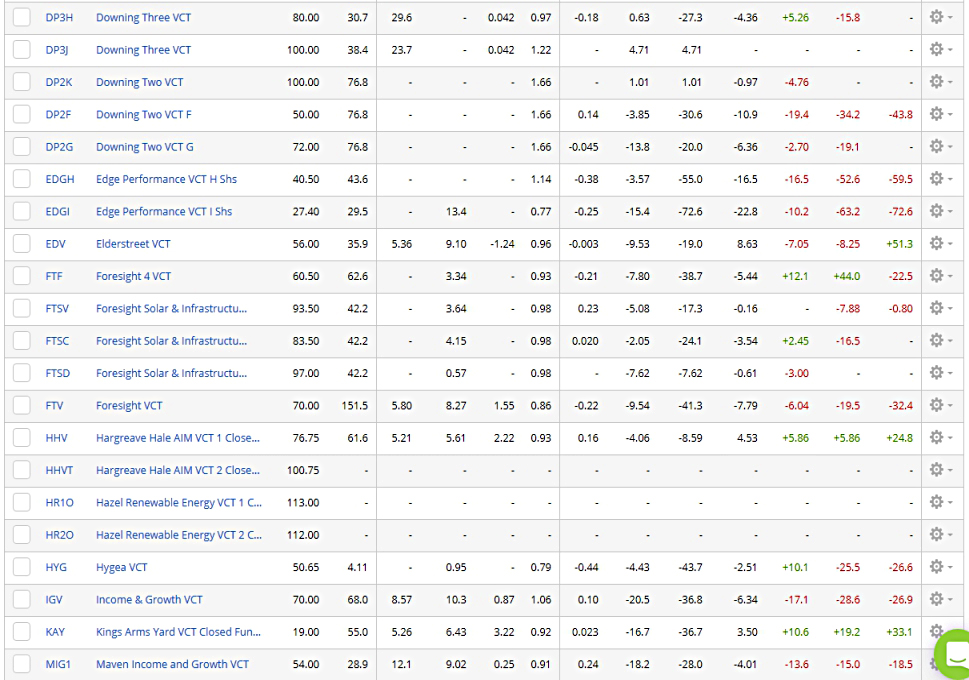

Missing data
There’s quite a bit of missing data in the Stockopedia table, which will need to be investigated at some point.
- As a first step, I added a price spread (bid-offer) field to the holdings tab.

The twelve VCTs listed above have no bid-offer spread, and so will need particular investigation.
- Octopus Titan is on the list, so I worried that I had the wrong ticker for it.
But the Octopus website confirmed that OTV2 is the correct ticker.
- That’s good news personally, as I have shares in it.
Top tens
Before we try to merge the two datasets, let’s look at a few “top tens” from the Stockopedia data. (( Disclaimer – the following tables may contain more or fewer than ten VCTs ))
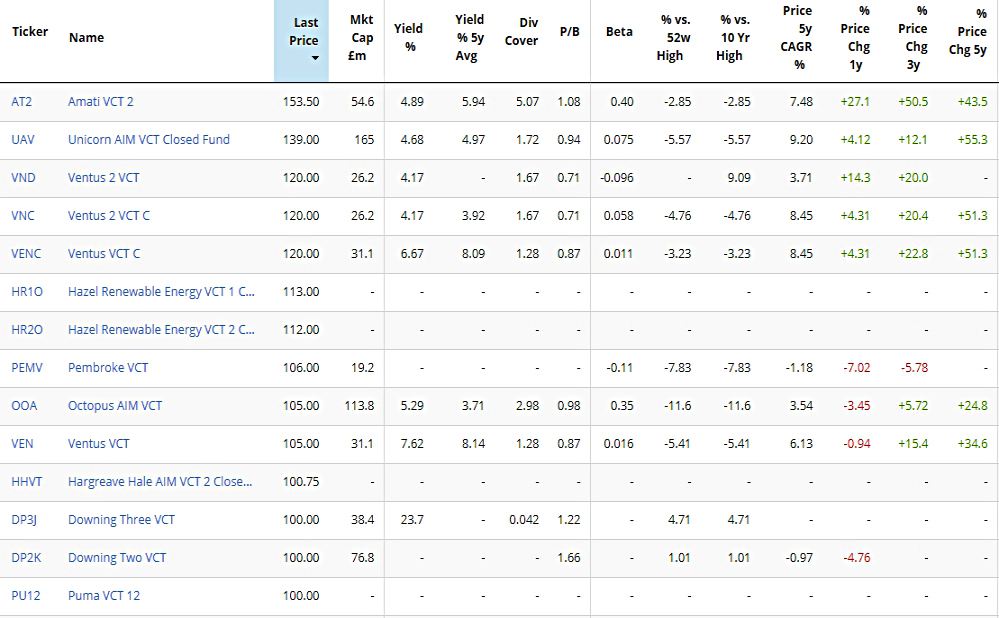
Here are the VCTs with a share price above 100p.
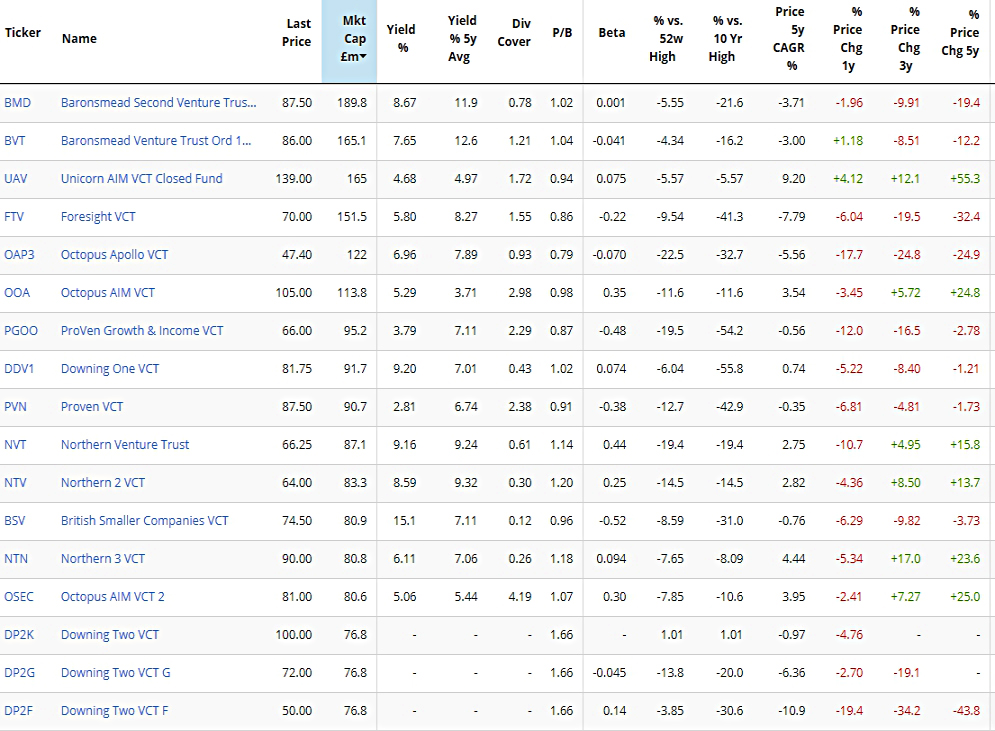
Here are the VCTs with the largest market caps.
- Note that Octopus Titan (the largest) doesn’t appear, since Stockopedia doesn’t have data for it.
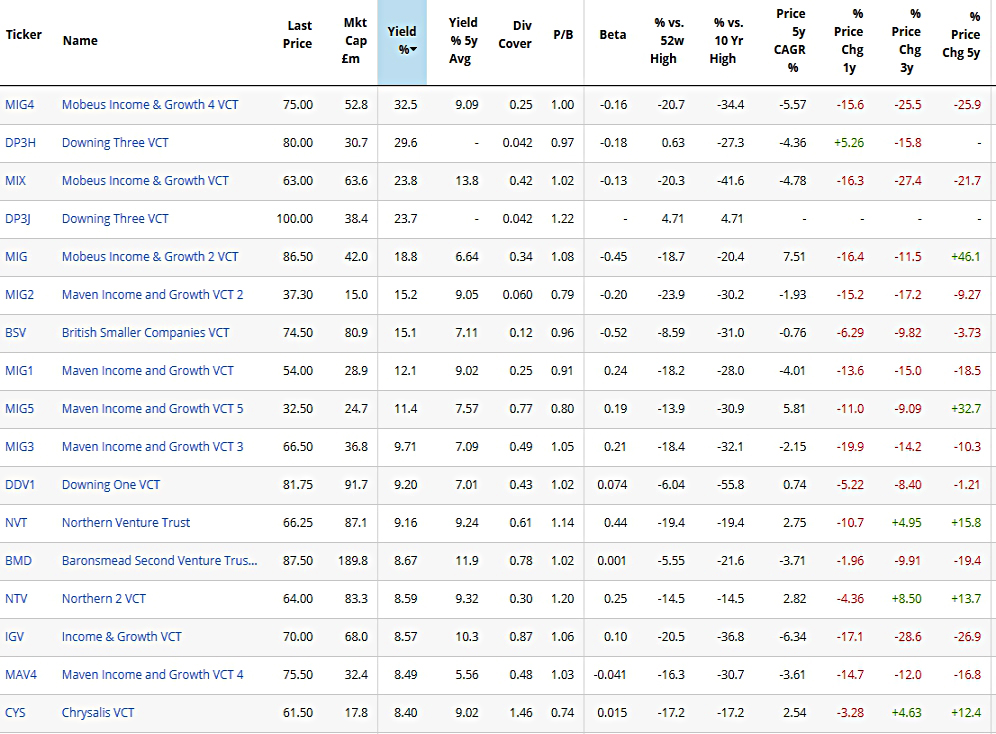
Here are the VCTs that yield more than 8% pa.
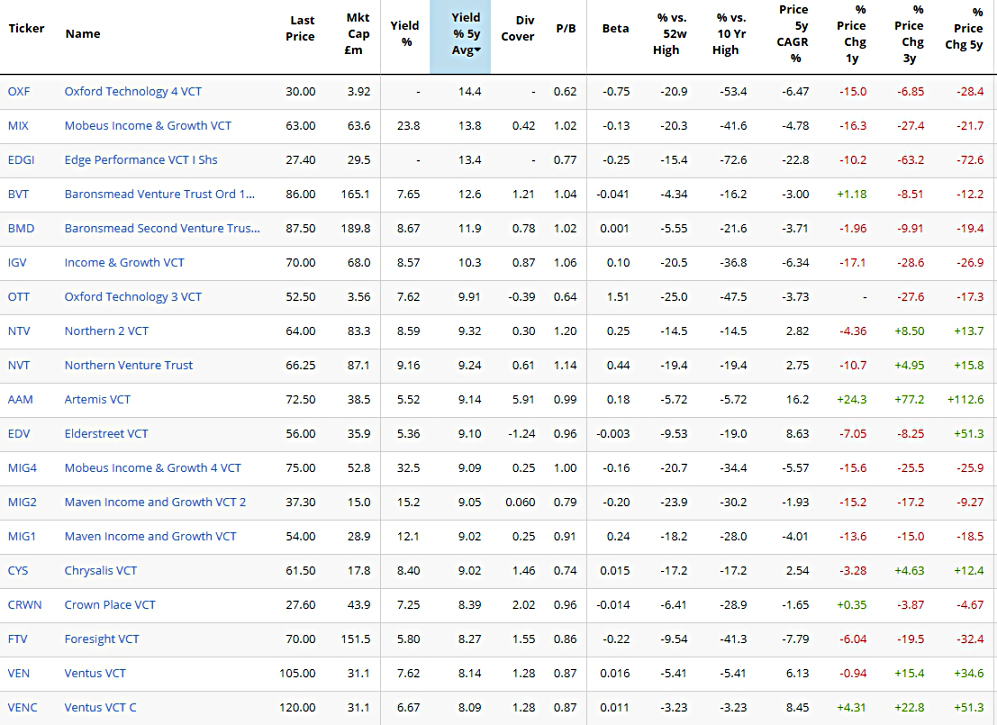
Here are the VCTs that have a 5-year average yield of more than 8% pa.
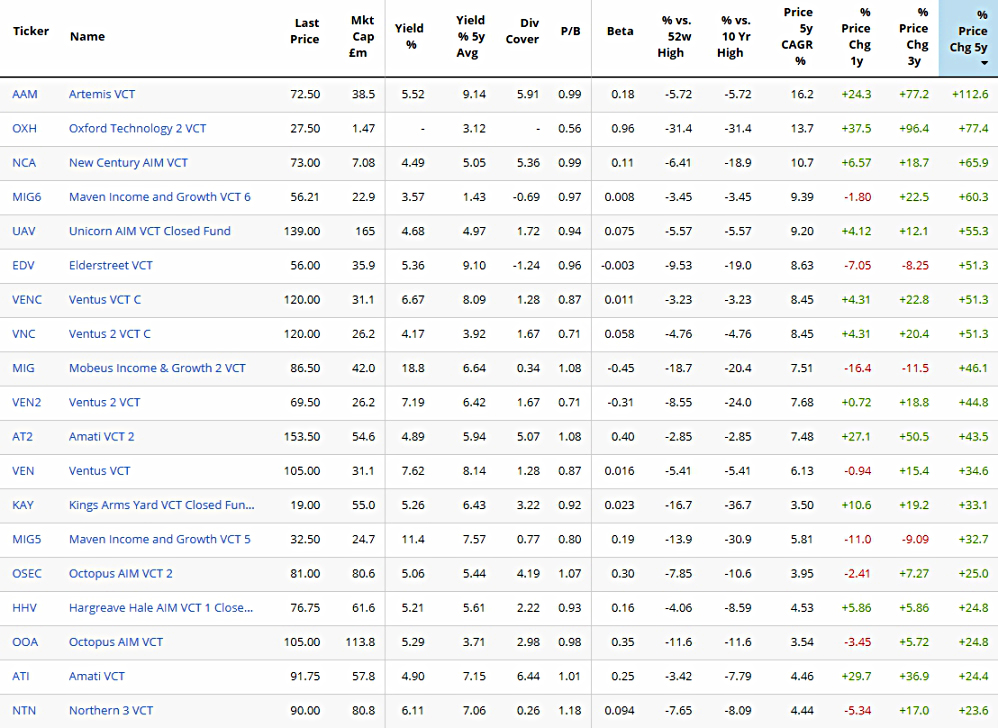
And here are the VCTs with the best share price appreciation over the past five years.
Combining the data
Exporting the Stockopedia data to .csv format is straightforward.
- You can then import the data into a new tab in a Google Sheet.
I used the VLOOKUP() function to combine date from the various tabs:
- From Google / Morningstar (G):
- Live Price
- Market Cap
- Launch Date
- From Stockopedia (S):
- Last Price
- Market Cap
- 5-yr yield
- 5-yr price gain
I added the following calculations:
- Variance between prices (G and S)
- A large variance could be an indicator that this VCT is no longer active
- Loss per year (from current price and age, from launch date)
- Average market cap (G and S)
- Annual share price gain over last five years
- Annual return including average yield over last 5 years
- This obviously favours VCTs for which Stockopedia has yield data
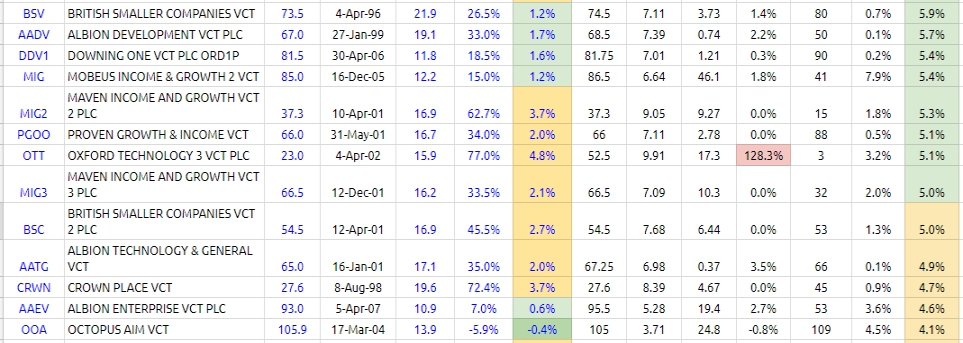
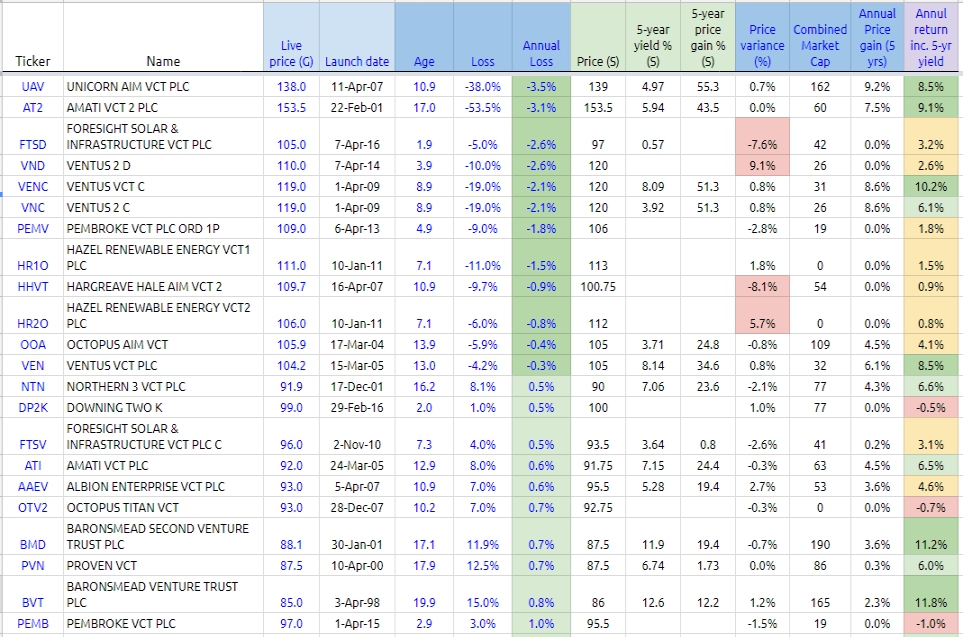
Overall returns
Here are the VCTs with the best returns over the last five years:
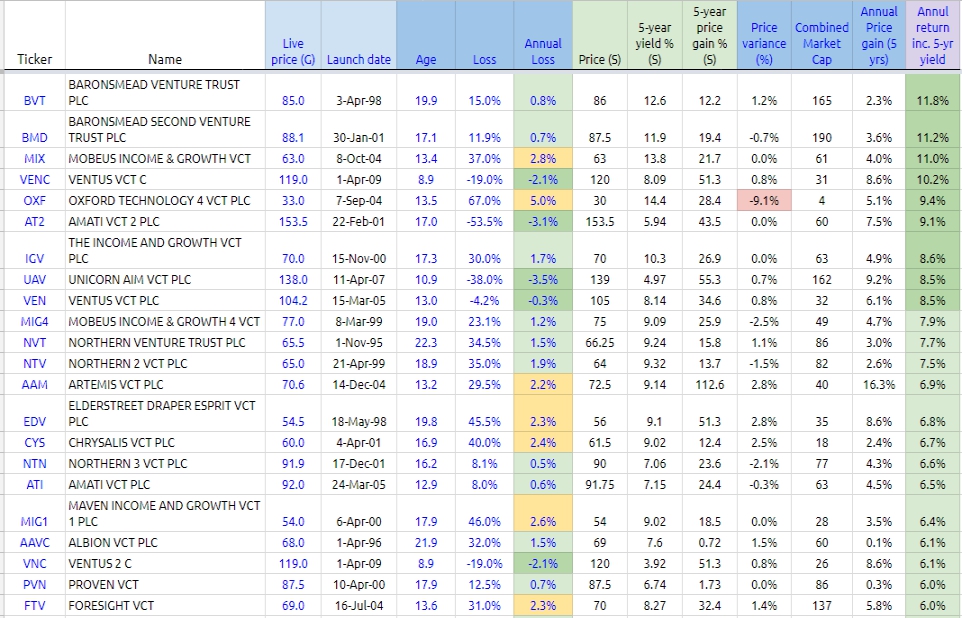
Note there are couple of price discrepancies to investigate.
Here are the VCTs with the best share price performance since launch:
I need to look for dividend yield data on those funds that have none, in case that would put them close to the top of the total return chart.
Next Steps
That’s it for today.
- We have a framework in place for evaluating VCTs against one another.
- But some of the data is missing or possibly dirty.
The next steps are all about cleaning up the data:
- Look at what’s available from the AIC
- Check VCT manager websites
- Investigate missing spreads and yields
- Investigate price variance
I won’t need this sheet again until April at the earliest.
- That’s a new tax year, so I can start to invest in VCTs once more.
But if there are no good open offers in April, the next update could be further in the future.
Until next time.
Mike Rawson
Mike is the owner of 7 Circles, and a private investor living in London. He has been managing his own money for 40 years, with some success.