How much VC?

Today’s post looks at a report from Hardman on how much venture capital should be in investors’ portfolios.
Contents
How much VC?
The report we’re looking at is called “How much should clients invest in venture capital?” and it dates back to November 2021.
- It’s only recently come to my attention because it’s the end of the tax year when products like VCTs and EIS get a big sales push (as do ISAs).
The report comes from tax adviser Hardman & Co, who I think we can assume are invested in selling tax-shelter products. They describe themselves as:
A corporate research & consultancy business serving the needs of both public and private companies. Within the EIS and VCT market, we write reviews of funds and companies to an institutional standard.
It’s also sponsored by a quartet of suppliers of EIS and VCT products.
- So I think it’s a safe bet that the answer to the question “How much VC?” will be “not as much as they should”.
In fact, the report’s subtitle gives the game away: “Why investors are underweight EIS and VCTs.”

The author of the report is Brian Moretta, who I haven’t come across before.
- He’s the head of Tax Enhanced Services at Hardman and is an actuary turned fund manager turned equity analyst.
Methodology
The report uses classical mean-variance optimisation (MVO) to work out the optimal level of venture capital (VC) that should be added to a traditional 60/40 portfolio.
- The conclusion is that adding 13% of scale-up (later-stage) VC or 8% of seed (early-stage) VC can add 0.5% to 1% in returns for the same level of risk (volatility).
The improvements are even greater when the effect of tax relief is added.
I have a few issues with this:
- The classic 60/40 is not my base portfolio (I’m closer to 75/25), so the results will need some interpretation
- The returns from 60/40 are too low for me, and I don’t have easy access to leverage (which would juice the returns from an MVO portfolio)
- In any case, the optimal (max SR) MVO portfolio is closer to 40/60 than 60/40
- MVO can lead to some storage allocation percentages
- in this case, the increase in the bond allocation to compensate for the higher risk levels of VC
- The recommended allocations to VC (8% to 13%) are very high
- My current allocation is 3.2%, and I would get nervous well before 8%
- I doubt that any private investors would allocate 10% or more to VC
- Most UK private investors in VC will be driven by tax reliefs rather than targeting higher returns
- I would be happy with a neutral impact on returns, or one commensurate with the increased risk level (volatility)
I assume that the 60/40 baseline was chosen because the target audience for the report is IFAs, and they are comfortable with that portfolio.
Venture capital
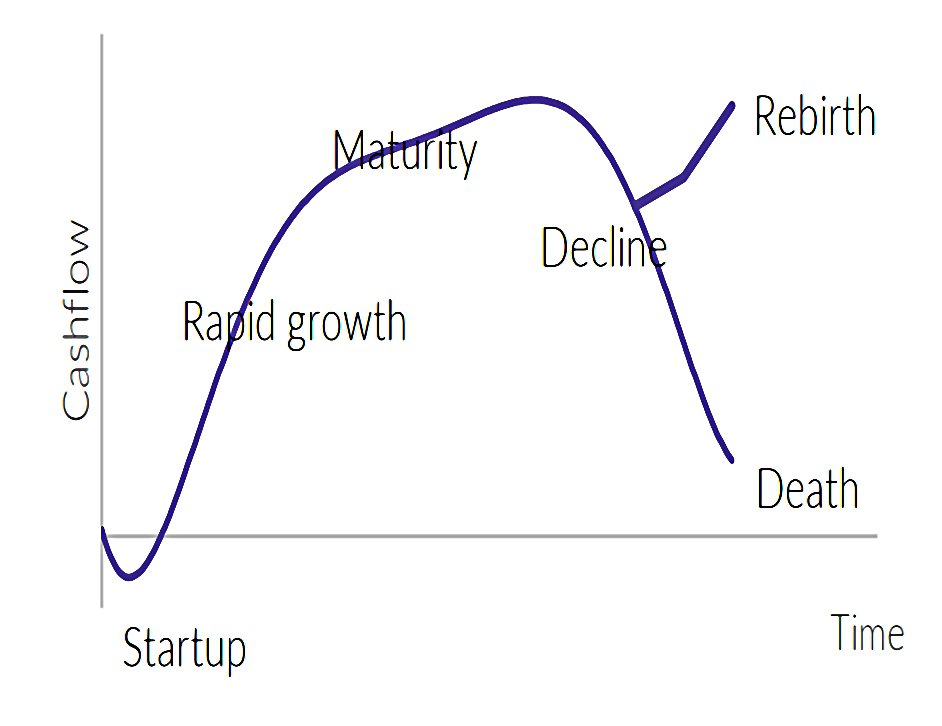
VC targets firms that are small-cap and unlisted, but more than that, they are at the startup stage of the company life cycle.
Venture capital companies are developing their first product, finding their first customers or seeking product/market fit.
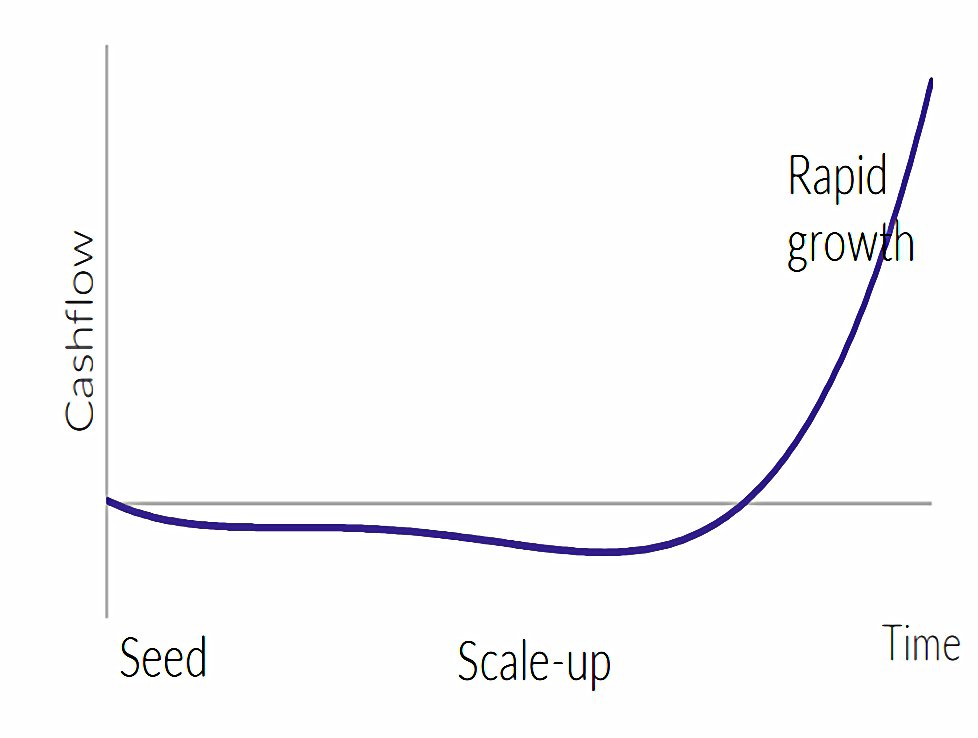
Brian splits VC into two groups:
- Seed: this is early-stage funding, usually when companies are in product development or finding their first customers.
- Scale-up: once a company achieves product-market fit, it usually invests in distribution to grow revenue quickly. Funding rounds at this stage are usually known as Series A (or B, C, etc).
We should expect lower failure rates for scale-up (and hence lower returns).
Correlation and returns
While the dream of most venture investors is an IPO leading to a multi-billion company, in practice, they mostly get their returns from sales to existing companies. Higher valuations tend to come when the buyers are doing well, and have healthy balance sheets and share prices.
For the MVO analysis, what we need are return numbers and correlations between VC and equities.
Publicly, there are estimates in two papers by Sand Hill Econometrics, (Woodward, 2009) and (Hwang et al., 2005). The correlation between venture capital and quoted equities is 0.47. The correlation between quoted equities and bonds is 0.37.
Ther’s also an interesting point about lagged returns:
Venture capital returns correlate better with equity returns lagged five to six quarters. This supports the relationship being through exit valuations, rather than macro conditions.
This makes the diversification properties of VC obvious.
There is not a lot of good data on returns for EIS firms, so Brian uses angel investments as well.
- I am surprised that he didn’t at least analyse VCTs, which are listed companies with 25 years of published results.
The IRR on angel investments from two studies was 22%. (( My own XIRR on my VC investments over the past five years is 21% ))
- Syndicate Room reported a 27% growth rate for EIS investments across 2011 and 2012.
Newable looked at the cohort of 1,229 private UK companies that had an observable valuation event in 2013. Aggregate CAGR was 23.7% – albeit much of that was unrealised. Of the companies, 7% exited and 13% were written down to zero.
US data on larger (later stage) firms shows returns between 15% and 18% pa (after fees).
A reasonable return target for venture capital would be something from mid-teen to low-twenties’ percentages. Earliest-stage investments, such as SEIS, may be a bit higher, while scale-ups may be in the lower half of this range.
For our purposes, we make the following estimates:
- expected return on scale-up investments is 15% p.a.; and
- expected return on seed investments is 22% p.a
Brian estimates that EIS investments are 2.5 to 3 times as volatile as equities.
If we use a historical average standard deviation for equities of 15% p.a., and assume equities return 7% p.a., this suggests risk measures of 32% for scale-ups and 47% for seed investments.

Brian also notes that the seemingly small increase in annual returns (0.5% to 1%) from adding VC to a portfolio will compound nicely over time.
Efficient frontiers

We start with the efficient frontier (EF) for a stock/bond portfolio (allocations generally unknown).
- The 60/40 portfolio is at the 5% return, 10.4% volatility point on this curve.
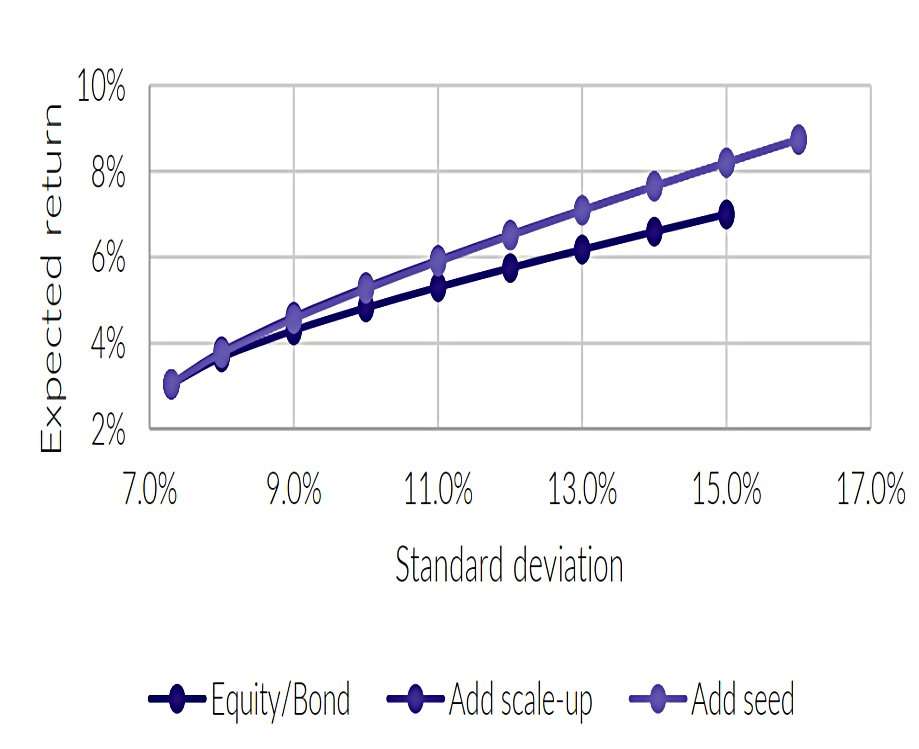
This chart adds a second EF for a portfolio that also includes VC.
- It turns out that the seed and scale-up curves are the same.
The VC curve is higher – we get more return for a given amount of volatility – and also extends further to the right.
For our 60:40 investor, the expected annual return has improved from 5.0% to 5.5% in either case. Alternatively, the investors could reduce their expected standard deviation to 9.5%, from 10.4%, while keeping the same expected
return.
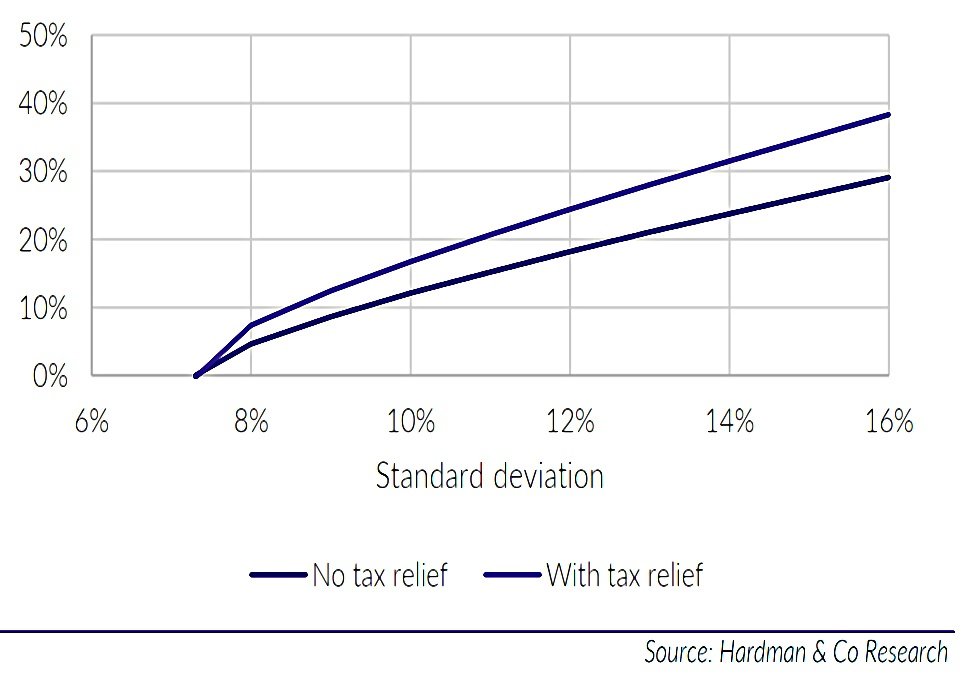
VC allocations
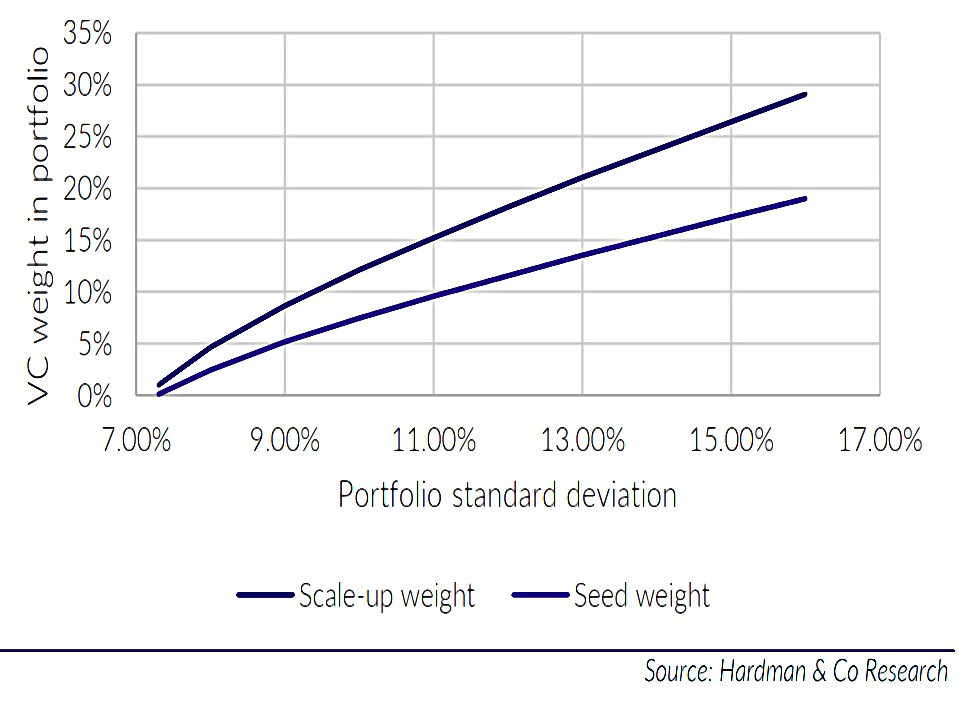
At the 10.4% volatility level (which Brian calls the 60/40 portfolio), the allocation to seed would be 8% and to scale up 13%.
- At 15% volatility (100% stocks) the max VC allocation would be 17% seed or 27% scale up.
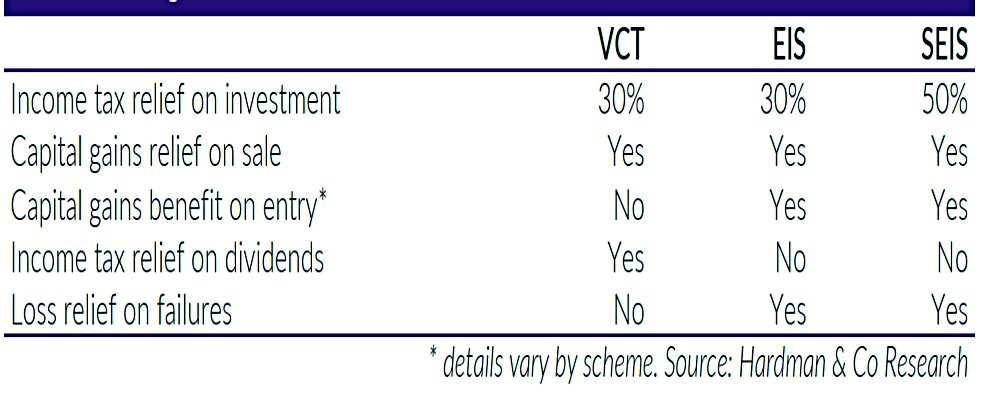
Tax relief
To calculate the impact of tax relief, Brian needs a return distribution.

He uses the chart from the NESTA report to derive a distribution with an overall 2.2x return and an IRR of 17%.
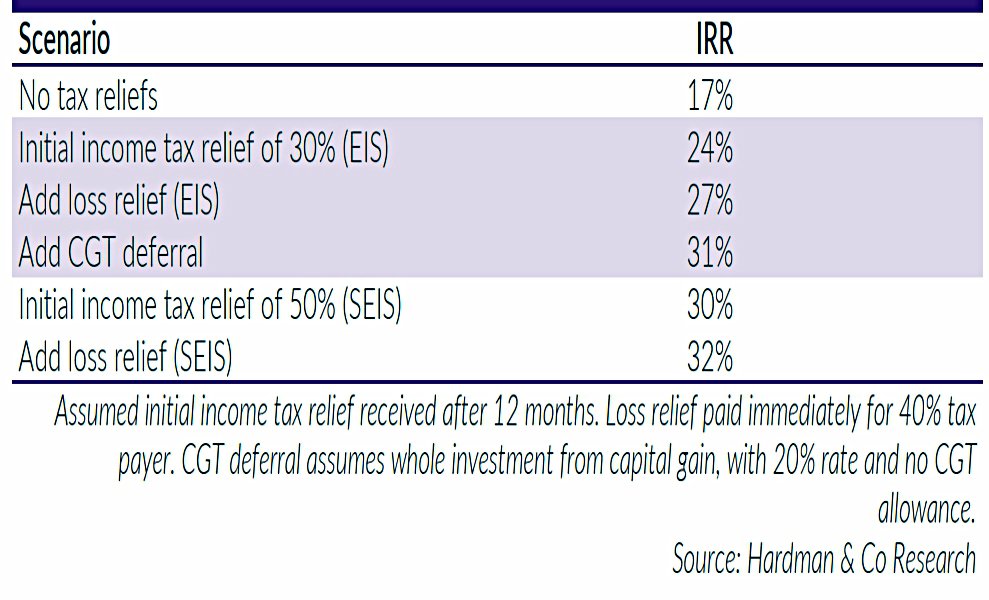
The initial 30% income tax relief (on EIS, but also on VCT) bumps the IRR to 24%.
- EIS and SEIS have even better IRRs.
Although the tax relief will also compress the spread of returns, and hence reduce volatility, this effect is comparatively small.
- Loss relief for EIS adds more compression.
Brian decides on two conservative scenarios:
- Initial tax relief of 30% applied to scale-up investments. This will increase our expected IRR to 22%, and keep the same standard deviation.
- Initial tax relief of 50%, plus loss relief applied to seed investments. This will increase our expected IRR from 22% to 37%, and decrease the standard deviation to 42.4%
Most real-world implementations should fall between these two bounds.
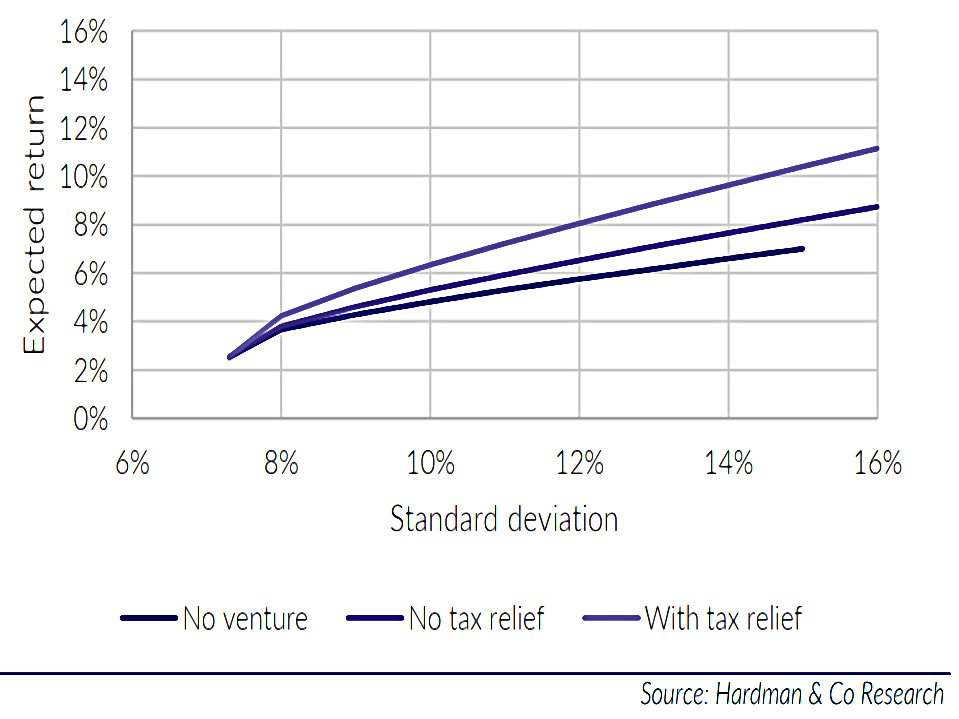
Here’s the effect of the initial 30% tax relief on the EF.
- At the 10.4% volatility level (60/40 portfolio) the return increases from 5% to 6.7% pa (compared to 5.5% without tax relief).
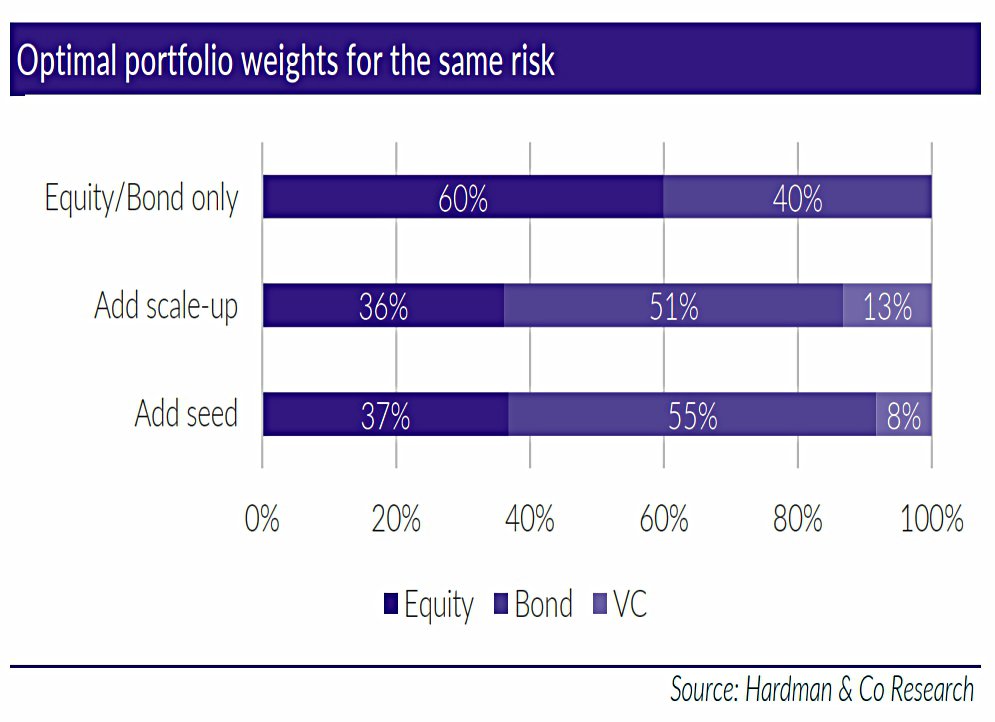
And here are the new portfolio weights for scale-up VC.
- The allocation for the 60/40 investor is now 18% rather than 13%.
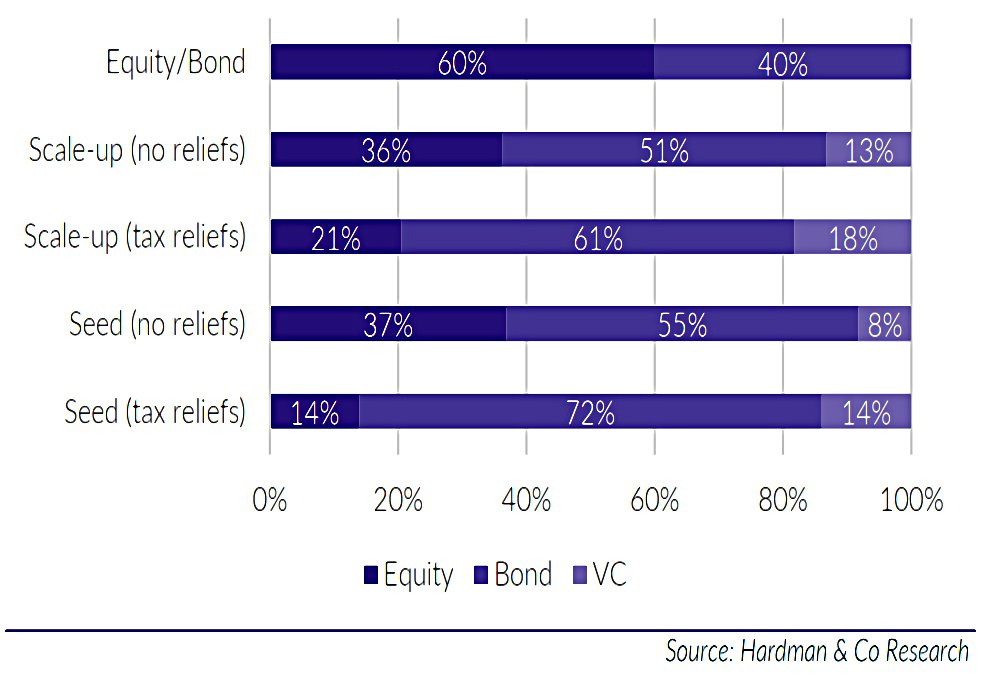
Note, however, that the portfolio now also has 61% bonds and only 21% stocks.
Conclusions
Brian makes a compelling case that VC should be added to portfolios.
When we first did these calculations several years ago, different assumptions for equity and, particularly, bond returns seemed appropriate. Interestingly, the asset allocations have not really changed. This suggests that the results are reasonably robust.
Brian’s analysis sets upper bounds for VC allocations that are far in excess of anything I would consider.
- This comes at the cost of requiring higher allocations to bonds in order to bring the volatility of the overall portfolio back down to a target level.
In practice, most EIS and VCT investment is driven by tax reliefs, and so you must have tax to offset.
- It is also the case that VCT investment is cash-flow positive in the basic rate band (saving more tax than the tax rate) and cash-flow negative in the higher tax bands.
This sets a natural point of maximum efficiency for an annual investment into VCTs.
- Where the allocation gets to will depend on the growth of my other investments and the extent to which I need to withdraw capital from VCTs after the five-year lock-up period.
My best guess is that my allocation will top out at not much beyond 5%.
- Which is fine by Brian’s calculations.
Until next time.
Mike Rawson
Mike is the owner of 7 Circles, and a private investor living in London. He has been managing his own money for 40 years, with some success.