The Power Law and Startups
Today’s post looks at a white paper on the power law in startup investing.
Syndicate room

The paper was written by Graham Schwikkard, the CEO of Syndicate Room (SR), a firm that specialises in EIS investments.
- I have a small amount of money with them dating back to 2017 (I’ve been investing in VCT rather than EIS in recent years).
SR have a long-standing interest in the maths of startup investing, having sold their initial Fund-28 on the idea that you need 28 investments to have a good chance of a big hit.
Returns from startups follow a power law, and the exact fit of that power law predicts how many will be big winners (defined as returning more than 10X).
- The paper looks at UK startups that first raised capital between 2011 and 2014, and follows them through to 2021.
The key finding is that the distribution of returns follows a power law with an “alpha” of 1.8.
- The implication is that investing in larger portfolios of early-stage companies would be the strategy that maximises returns.
Power vs normal
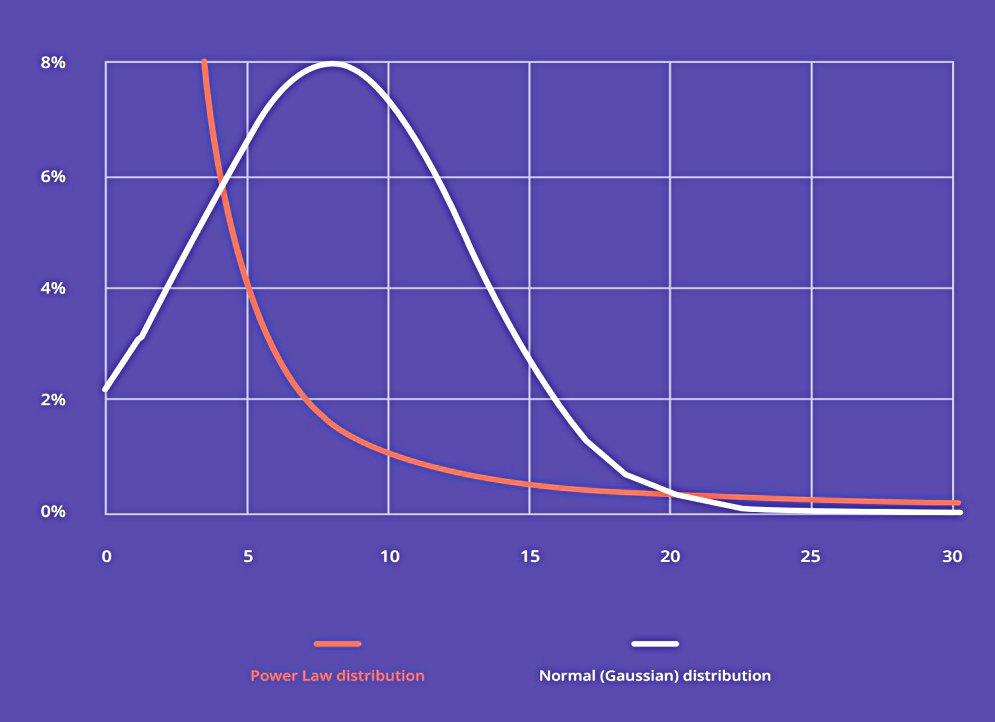
Graham says that most data follows the normal distribution, with a central value and most observations clustered close to that.
- Human height is a good example.
A normal distribution is the product of complex systems with multiple inputs, hence why we see it so often.
Power law distributions are less predictable, and sampling the population is not so useful in determining what the likely range of values will be.
In power law systems, the majority of values sit at one end of the spectrum and there is a long tail of outlier values extending away indefinitely.
Another way of putting this is that power law distributions (PLDs) have a fat tail to the right.
- Wealth distribution is a good real-world example here.
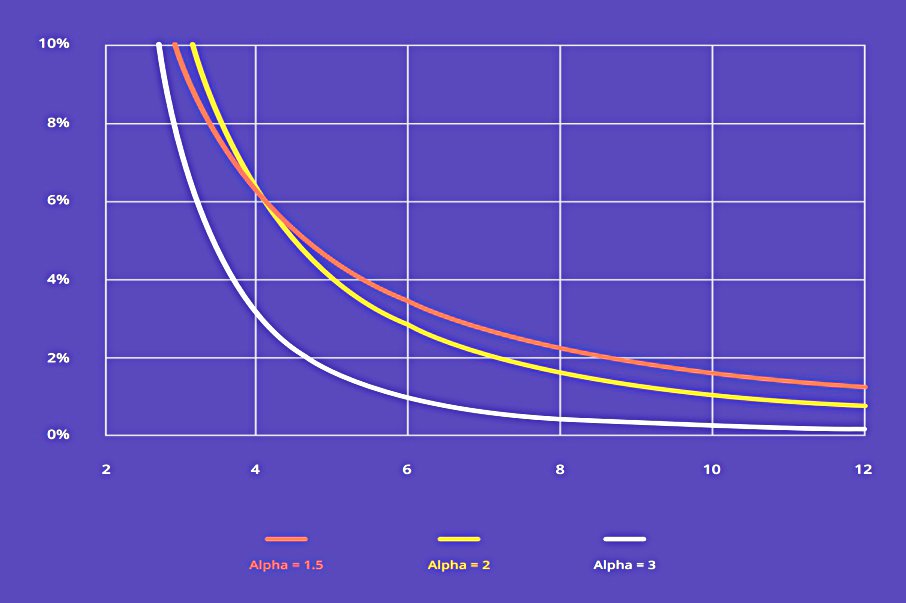
The speed at which the power law distribution declines (the slope of the curve) is known as the alpha.
Despite the concentration of population at one end, if you sum up the underlying values of the tail it will outweigh the majority.
So 80% of the world’s wealth is held by the richest 20%.
- And the average for a group will likely be dominated by a single extreme value (Elon Musk in terms of wealth).
Alpha
The formula for a power law curve is:
p(x)=Cx-α
Alpha determines the shape of the curve and C is a normalisation constant to ensure that the area under the curve is equal to 1 (or 100%).
- The lower the alpha, the fatter the tail – in the case of startups, low alpha means more big winners.
When the alpha is below 3, a standard deviation can’t be calculated – there is no expected variation from the mean.
- If the alpha is less than 2, there is no average.
Consider wealth distribution. The more picks you make the more likely you are to pick someone with an outsized level of wealth which will pull up the average.
It’s the same with startup investing.
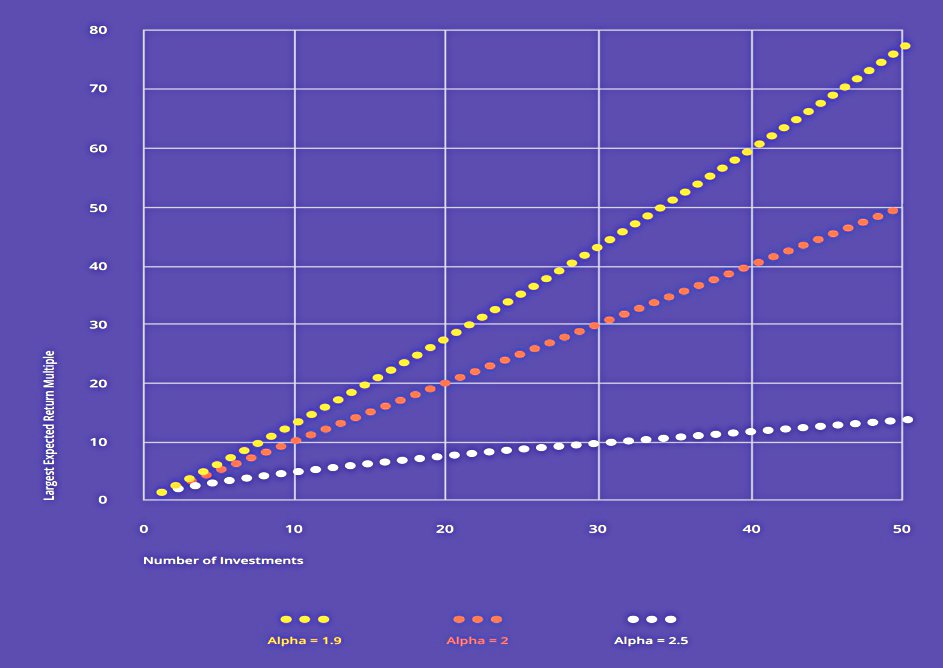
This chart shows the largest return multiple you would expect in a portfolio of n investments, for populations of different alpha values.
- With a low alpha, you want to invest in as many companies as possible (assuming that all opportunities are of equal quality).
How do investors keep the alpha low? All it means is ensuring that they are exposed to a higher proportion of deals that will have big exits. Investors should spend 90% of their time working on their deal flow machinery and just 10% on picking which ones to invest in, and invest in as many as you can.
For Graham, it’s about access to the higher potential deals, not your ability to pick the winners from within them.
UK market data
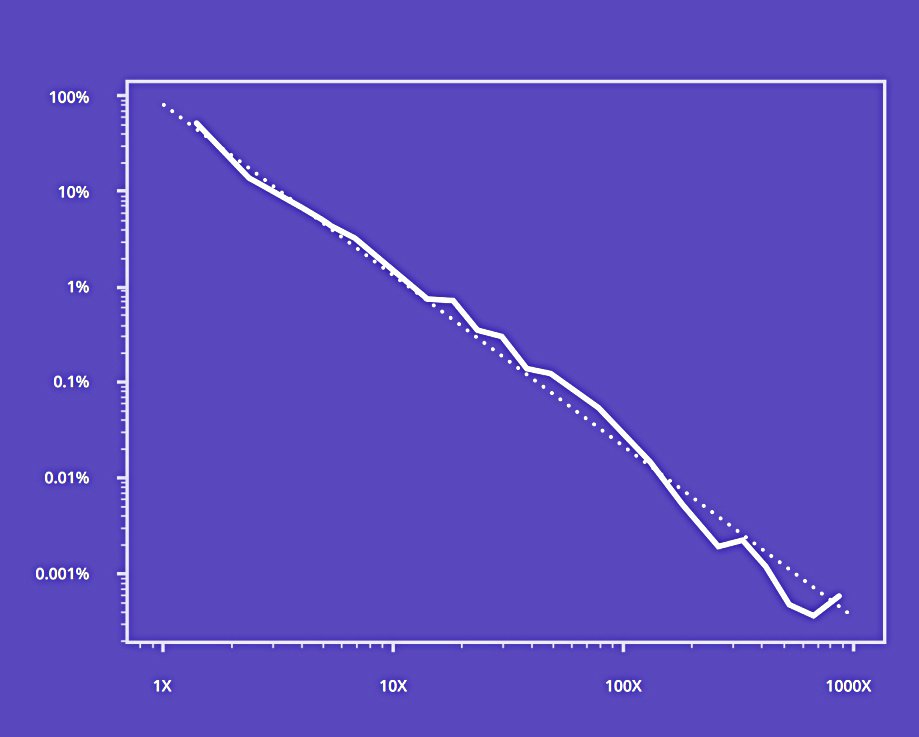
Graham used Companies’ House data to fit UK startups to a power law curve.
Companies House requires all startups to file how many shares they issued, and at what share price, every time they complete a fundraise.
This requirement is apparently unique to the UK.
The universe of companies raising between 2011 and 2014 was 2,796 and these firms were tracked through 2021.
- Two funding rounds were needed to establish a change in valuation, and that change needed to be positive to run the analysis.
In the end, 1,780 firms were analysed.
In the world of venture investing you aren’t actually concerned with the failures as much as you are with the winners. Approximately 30% of startups end up as dead or zombies after seven years, with an additional 5% failing annually from there.
Previous research from Syndicate Room indicates average growth of 25%+ pa across all UK startups (including dying ones).
Graham’s research indicates a good fit of the current data to a power law with an alpha of 1.8
- The paper includes a list of five other research papers mapping venture capital data to power laws with alphas from 1.8 to 2.4
Implications

With an alpha below 2, the average and variance are unbounded.
Making more investments at random will increase your portfolio’s expected average return.
As luck would have it, Graham has a product for this – the Syndicate Room Access Fund, which makes 50 investments a year.
- I would have like to have seen some data on the returns from the Access Fund at this point, but none was provided.
You also need to apply some kind of quality filter or minimum threshold, to increase the likelihood that you are choosing from the correct population.
This threshold could simply be that a startup raises £150k from other sources before you invest.
Graham also makes the point that not all rounds are open to all investors.
Our own solution has been to partner with angel investors with access to the top end of deal flow in the market.
Graham notes that the combined portfolios of their angel investor partners also fit a power law and that the angel investors with the highest and most consistent returns are those with the largest portfolios.
Later stage rounds
Graham also split his analysis between funding rounds at valuations above and below £10M, as a proxy for the stage of funding.
At valuations above £10m the slope of the graph as defined by alpha increases to 2.7. At valuations above £20m the alpha increases to 3.3
This means that at later stages, the mean return is lower than in earlier stages.
- Later stage rounds have a shorter growth runway.
Larger portfolios are still desirable but the cost of missing a winning investment is not infinite.
With even later stages, a mean and variance will appear for the population, and larger portfolios can expect to grow more in line with the growth of the whole population.
For Graham, each stage is like a different asset class:
This brings up the question of participating in follow-ons if you are a seed stage investor (like we are). It makes sense to invest in another moonshot rather than doubling down on an investment with a shorter time to see compounding growth.
Of course, some investors will want to stick with firms out of loyalty or to build the kind of track record that gets them access to other desirable early rounds.
Conclusions
The power law distribution does not fit our normal mental models. Most investors will accept that their returns will come from a few winners and yet continue to invest in small portfolios of 8-10 companies.
Graham notes that new (including retail) investors are restricted to early rounds, as later stages do not include those who are both new and small.
- These early stages are when the alpha is low and large portfolios are key.
Syndicate Room’s model of investing in 50 startups each year is a convincing one.
- But I would have liked to have seen whether this theory works in practice.
Until next time.
Mike Rawson
Mike is the owner of 7 Circles, and a private investor living in London. He has been managing his own money for 40 years, with some success.