Designing a Venture Portfolio

Today’s post looks at a white paper on using data to design a venture fund portfolio.
Syndicate room
The paper was written by Graham Schwikkard, the CEO of Syndicate Room (SR), a firm that specialises in EIS investments.
- I have a small amount of money with them dating back to 2017 (I’ve been investing in VCT rather than EIS in recent years).
SR have a long-standing interest in the maths of startup investing, having sold their initial Fund-28 on the idea that you need 28 investments to have a good chance of a big hit.
- This paper is about the theory behind a later fund, the Access EIS Fund.
Most venture funds are run in the same way actively-managed listed equity funds – a guru fund manager picks likely winners from a vast population of opportunities.
- But unlike listed stocks, there is no database from which to build a model that certain signals indicate a higher likelihood of 10X growth (or more).
Graham notes that VCs only pick winning investments 2.5% of the time.
Instead, he is proposing an index-like approach to VC investing.
- He will use the data from Companies House on all company fundraises to analyse the market.
The research in this paper shows four things:
- The venture market shows a consistent year-on-year growth
- A portfolio of 50 investments will minimise variance against this market growth
- Access to the top 20% of deals makes a big difference
- Fixed ticket investments (equal sizing) show better returns than variable tickets
Growth
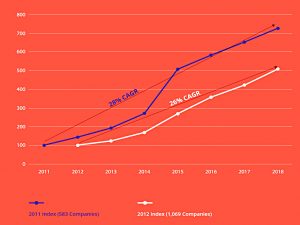
Here are the results of the analysis of the 2011 and 2012 cohorts (carried out with Beaufort).
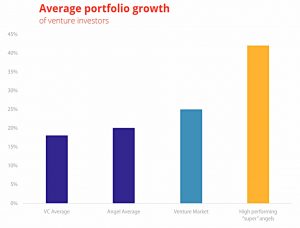
- The 2011 cohort has grown at 28% pa and the 2012 cohort at 26% pa (through 2018).
Similar results were found for the 2013 and 2014 cohorts (24% and 23% pa respectively).
- Graham also notes a British Business Bank study which found annual growth of 18% pa for the global VC market from 1970 to 2016.
The next question is, how do you capture this growth? How many companies should you invest in? How should it be spread out? Do you invest more in higher valued companies? Should you follow your money?
Portfolio size
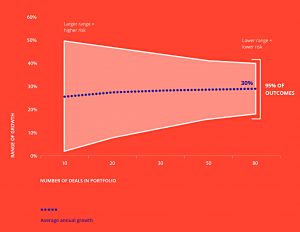
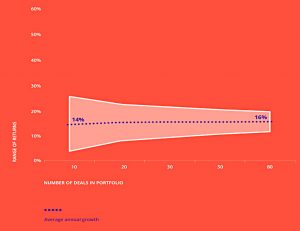
SR ran a Monte Carlo-style analysis, choosing random investments from those available in each year from 2011 to 2014, to determine the effect of portfolio size.
- Each portfolio size for each annual cohort was run 10,000 times.
Larger portfolios have slightly better returns and much lower variance.
Graham notes that on average UK VCs return less than the market average, so they might benefit from this random selection approach.
We selected 50 deals a year as a starting point for building our portfolio – it represented a balance between how many deals we could initially complete whilst reducing the variation of growth significantly.
SR already run an institutional fund on this basis, with a three-year deployment cycle.
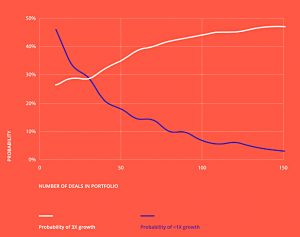
When these 50 deals are combined across three years, we find that the probability of losing capital is significantly minimised , whilst the odds of returning 3X of cash invested is higher than 50%.
Top deals
The next phase of the analysis was to look at what happens if you can’t get access to the best deals.
It is not always possible to access the full set of deals in any one cohort. They are not publicly listed and so you cannot simply log on to a trading platform and randomly select your own portfolio.
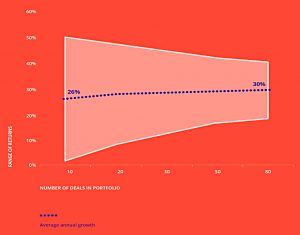
The chart above is the same one we saw earlier, but just for the 2011 cohort.
Startups follow a power law distribution: 40% of startups fail within 5 years, and the >10X returns are concentrated within the top 10% of companies. This distribution is what drives most venture capitalists to focus their capital on a few deals a year, and then double down on the startups which are showing growth.
This is the same chart for the 2011 cohort, but with the best 10% of deals removed.
- Bigger portfolios are still better, but the results are worse across the board (as you would expect).
So we need to make sure we have access to all the deals (and in particular, to the best deals).
Graham has several suggestions:
- don’t put founders through a negative selection process
- don’t charge high fees
- plug into the right networks
- SR has analysed the track records of thousands of angel investors and partners with them on their deals
- have a compelling value proposition
- many VCs sell themselves on expertise and advice, but many early-stage startups simply want capital (and to be left alone to run their business)
Ticket size
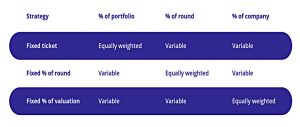
There are three options for structuring the portfolio:
- Equal ticket size (the same money amount per firm)
- A fixed percentage of each fund-rasing round
- A fixed percentage of the company valuation at the time of the raise
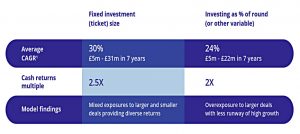
The Monte Carlo analysis finds that equal ticket sizes work best.
We had assumed an approach which adjusted the ticket size based on
the round size or valuation would mean you took a larger position on companies
which had more traction (as they were raising a larger round). Instead, what happens is that taking larger positions in these later stage rounds leaves less room for growth.
Conclusions
The research led SR to several conclusions about how they should set up their Acess EIS fund:
- Diversification across 50+ companies to minimise risk and match market growth
- Access the best deals by partnering with angel investors with the best track records
- Used fixed ticket sizes
It all makes sense, though of course in the real world, the fund won’t have the benefit of 10,000 Monte Carlo runs.
- We have to hope that the one shot we get is somewhere in the middle of the possible outcomes, or at least not one of the worst.
Until next time.


