Winning Spread Betting Strategies 2 – Bull Markets

Today’s post is our second visit to Winning Spread Bet Strategies. This time we’re looking a strategies for Bull Markets.
Contents
Strategy 1 – Buying Dips

Malcolm’s first strategy is used when the market in question is going up.
- For stocks, it helps if the relevant sector is also going up.
- And of course the stock itself should be going up.
There is no attempt to capture the whole of the trend:
- we enter after the trend has formed
- and we get out before the trend is over
Advantages and disadvantages
The advantages are:
- we are on the right side of the market trend
- the dip both improves the entry price and tells us where to put our stop (below the dip)
- the stop defines the trade size (with reference to how much cash we want to risk)
The main disadvantage is that some trends won’t have a decent dip to take advantage of.
Technicals
- Time frames
- Malcolm uses weekly charts, and expects trades to last from weeks to months.
- Which market?
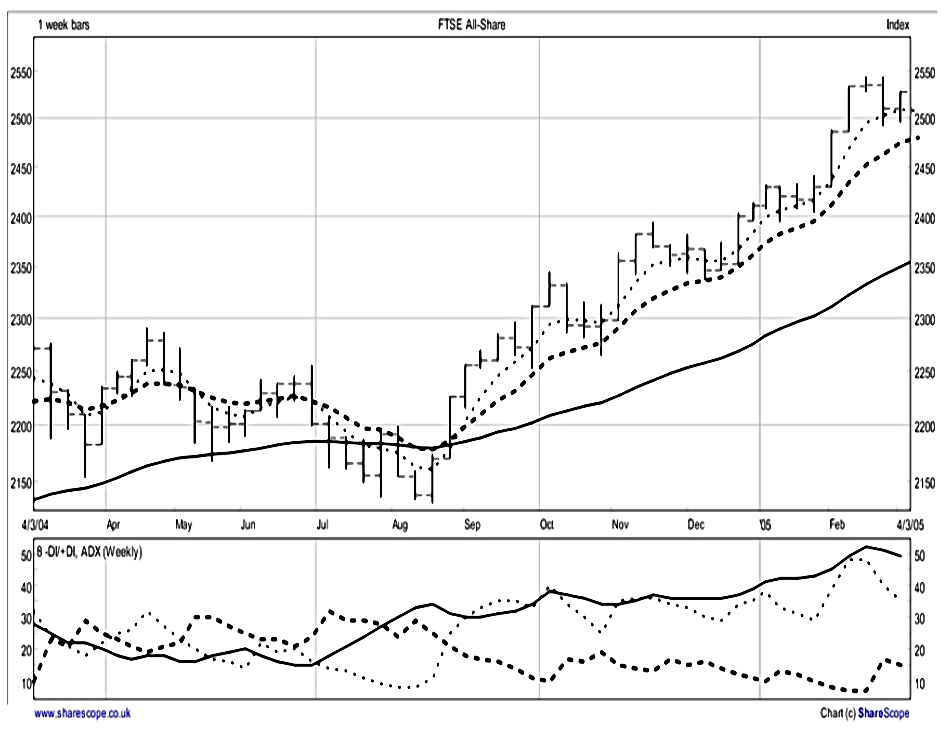
- He usually uses the FTSE All Share Index, but other assets can be traded the same way
- How is the trend defined?
- Visual inspection / ADX / moving average combinations.
- What constitutes a short-term dip?
- 3 week RSI oversold, or
- a weekly low lower than at least the previous 2 weekly lows
- When has the short-term ended?
- When price rises above the previous week’s high.
- How to determine how much capital to risk?
- 1% at risk
- On Malcolm’s nominal fund of £20K, that’s £200 per trade
- Where does the stop go?
- Just below the low of the week of entry (and therefore of the two previous weeks).
- When do we get out of the trade?
- When -DI climbs above +DI, suggesting the up-trend is over, or
- When one of our moving averages turns down, suggesting the up-trend is stalling.
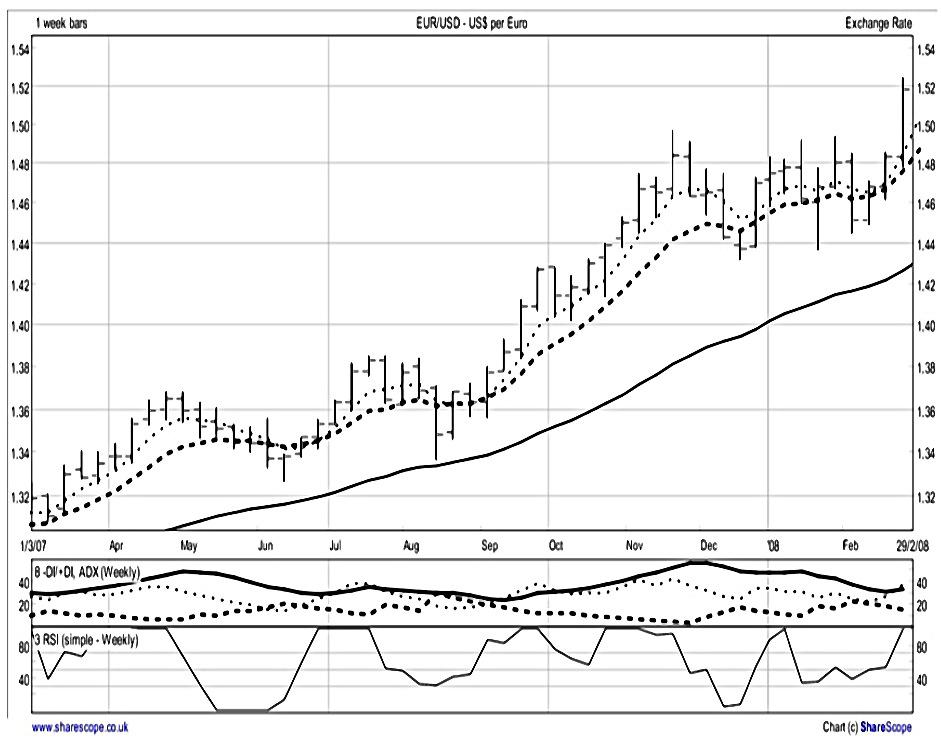
Example – Eurodollar

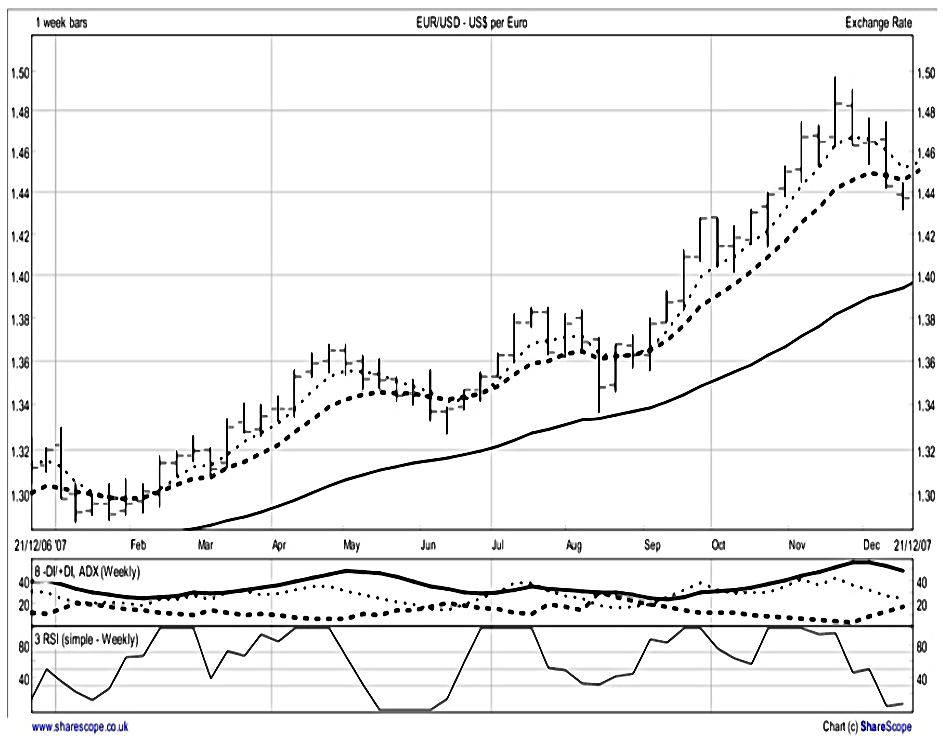
The market is in a strong up-trend.
- The ADX indicator is over 25 with +DI greater than -DI.
- The moving averages are in up-trend mode, but stalling (the 4 week average has already turned down, and the 10 week average appears on the verge on turning down).
- Price has been falling for several weeks, and the 3 week RSI is now below 30 (oversold).
- If the up-trend reasserts itself by rising above the high of this week, we will go long.
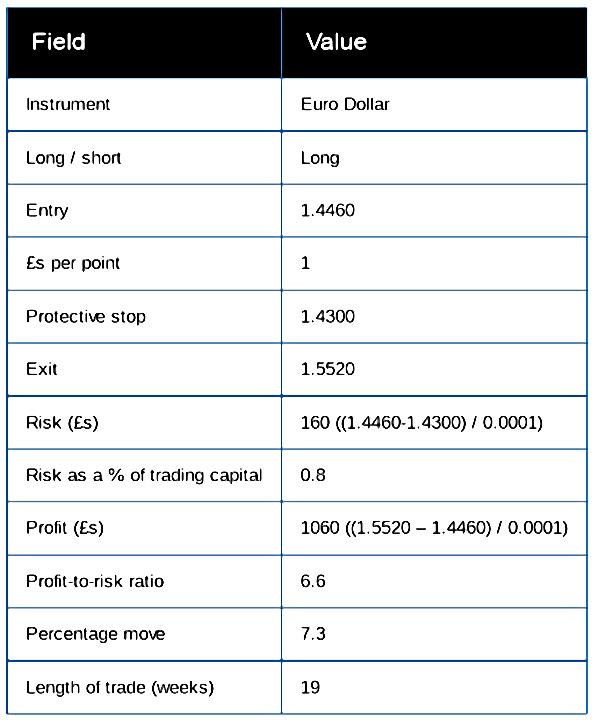
- Our entry price will be 1.4760, with a stop below the low of the week of entry and the two previous weeks.
- A week on, price has failed to exceed the high of the previous week.
- Both the ADX indicator and the moving average configuration are in up-trend mode.
- The 3 week RSI remains oversold, and we will still want to go long if the up-trend reasserts itself.
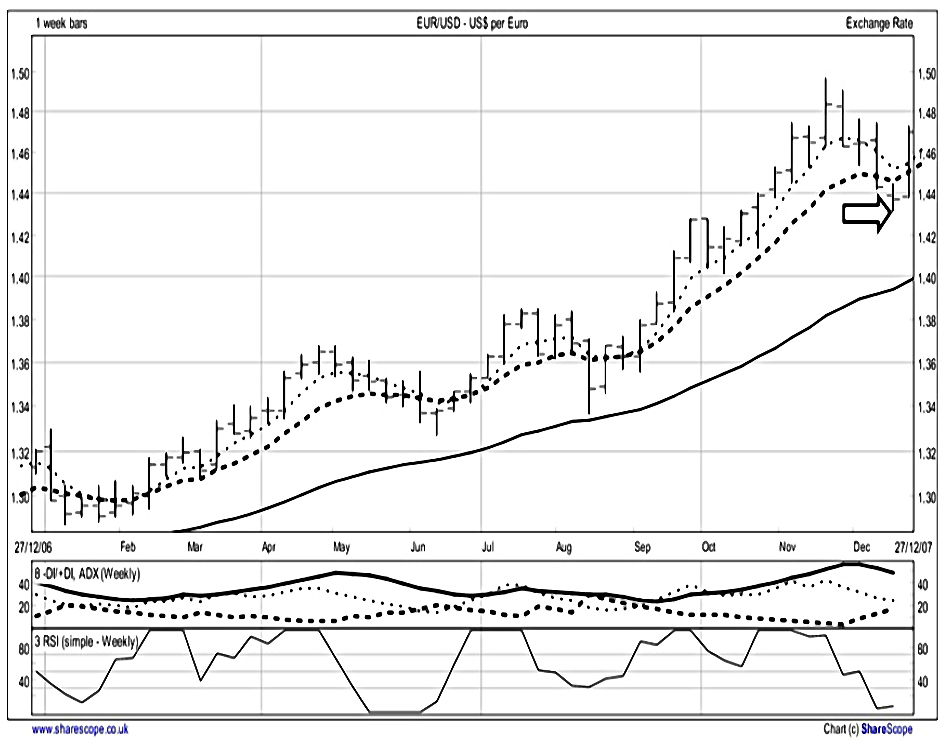
The following week the price hits the entry point and Malcolm takes the trade at 1.466, with a stop at 1.43 (the arrow).
- He bets £1 per 0.0001 Dollar, risking £160 on the 160 pips.
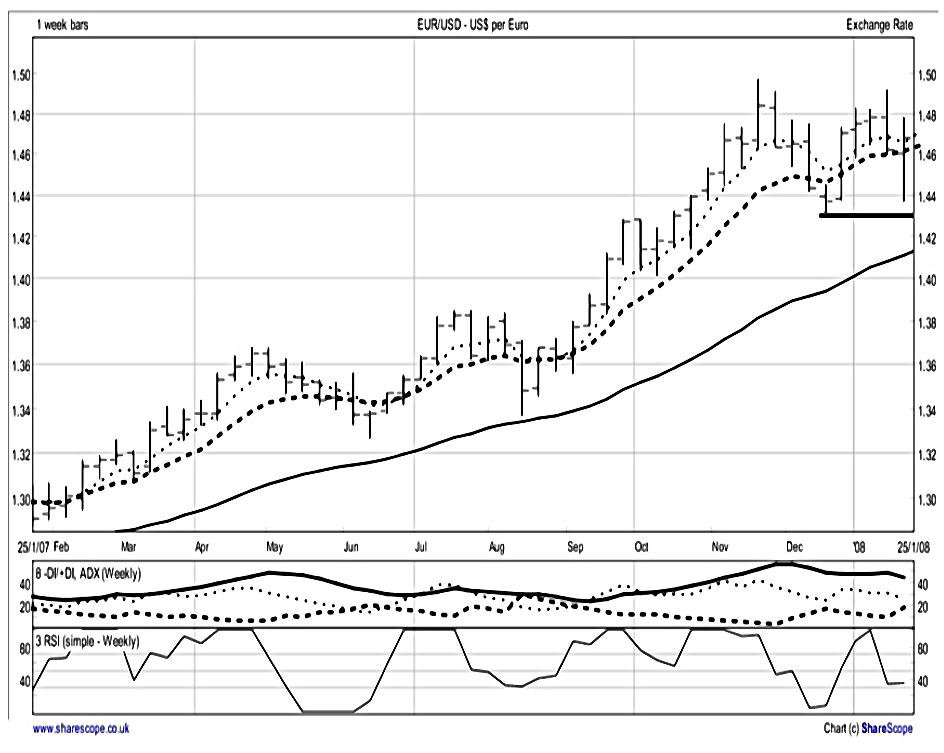
Not much happens in the next month but the stop isn’t hit so Malcolm stays with the trade.
After eight weeks the trade doesn’t look great:
- the price has close to the entry a couple of times
- the 4 week and the 10 week moving average have come close to turning down
- -DI has come close to crossing above +DI
A week later, the price has broken upward.
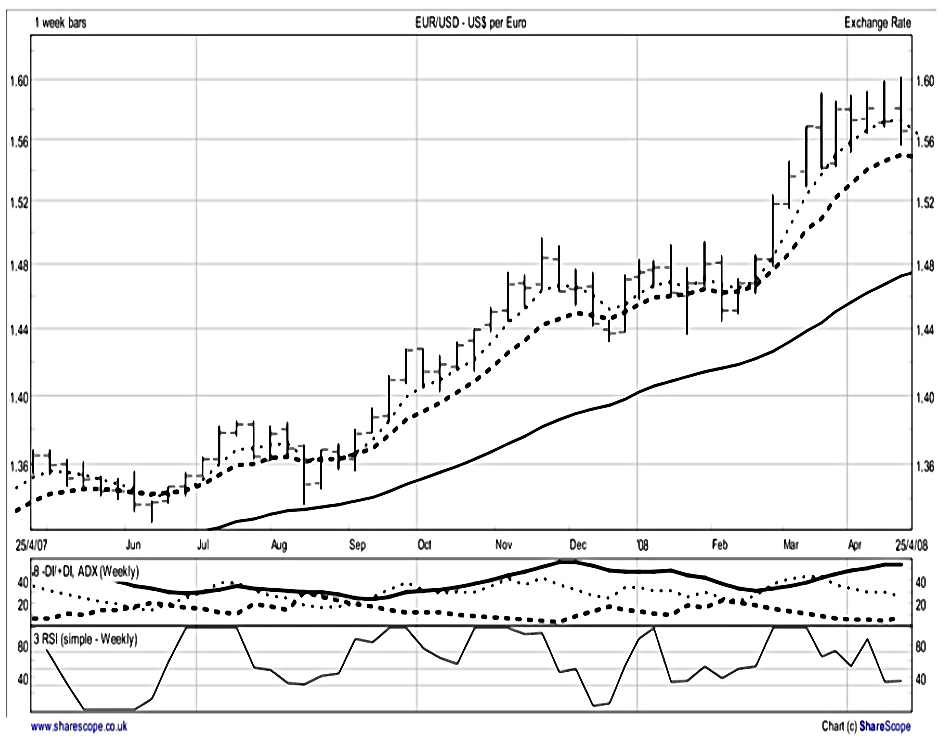
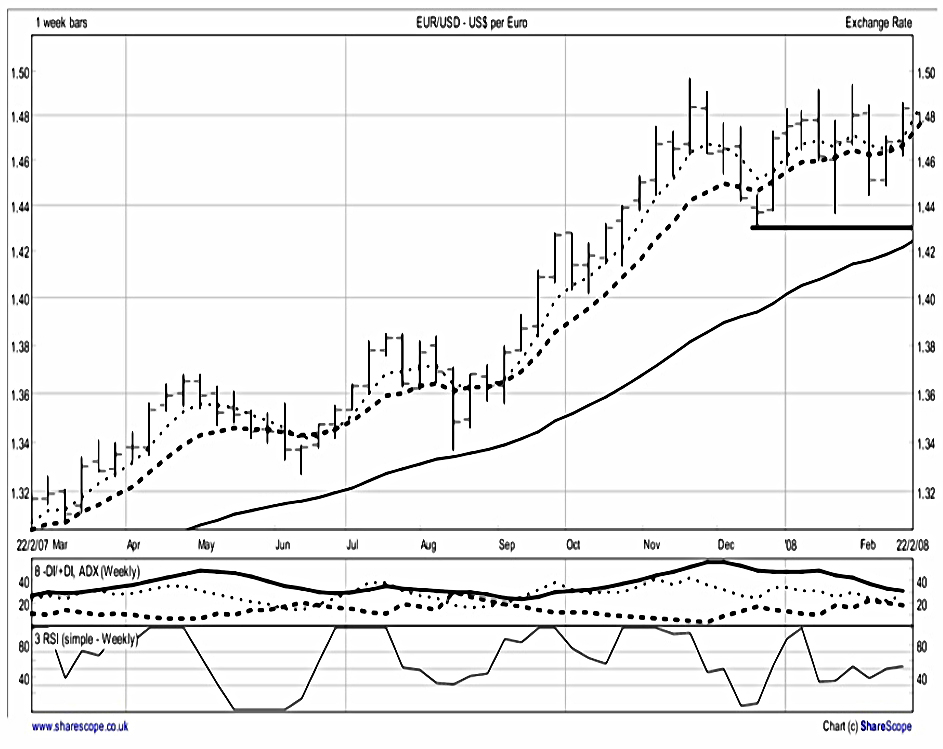
A few weeks later, the MAs are trying to turn down, but not quite making it.
- Malcolm decides to give it another week.

After another week, the 4-week MA has turned down, and Malcolm exits.
With hindsight it would have been better to have exited a week ago.
But it is important to remember that this is an inexact science, full of close calls and trade offs, some of which go our way and some of which don’t.
The book has another couple of examples for this strategy, but one is enough for our purposes.
Strategy 2 – Buying Relative Strength
This is a stocks-only strategy.
- As with strategy one, it works best when the market, sector and stock are all going up.
It buys stocks that are outperforming their market and sector, and stays long while their relative outperformance continues.
Advantages and disadvantages
Once again, this strategy is in line with the market (and sector).
- And again, we are only trying to capture some rather than all of an uptrend.
The main disadvantage is that relative strength can continue through periods of consolidation and even retracement (depending on what the sector and market are doing).
- This could be fixed by using an absolute momentum factor, or mitigated with trailing stops.
There can also be situations where relative strength ends, but the price continues upwards.
- Some kind of manual override would be needed here.
Technicals
- What time frame?
- As with strategy one, Malcom uses weekly charts, and expect trades to last from weeks to months.
- Which market?
- The FTSE All Share Index and its constituents.
- What is “going up”?
- Visual inspection / ADX / moving average combinations.
- What is relative strength to the market (for entry)?
- The stock needs to have outperformed by 10% over the previous four weeks.
- What is relative strength to the sector?
- The stock to have outperformed the sector by at least 1% over the previous four weeks.
- How much capital to risk?
- 1% (£200 on a £20K pot).
- Where does the stop go?
- Immediately below the low of the week of entry and the two previous weeks.
- When to exit?
- The overall market direction changes from up to down (note, a sideways market means stay in if the stock continues to outperform).
- The sector’s direction changes from up to down (again, sideways is OK if the stock outperforms).
- The stock outperforms the market by 1% or less for two weeks running.
- The stop is hit.
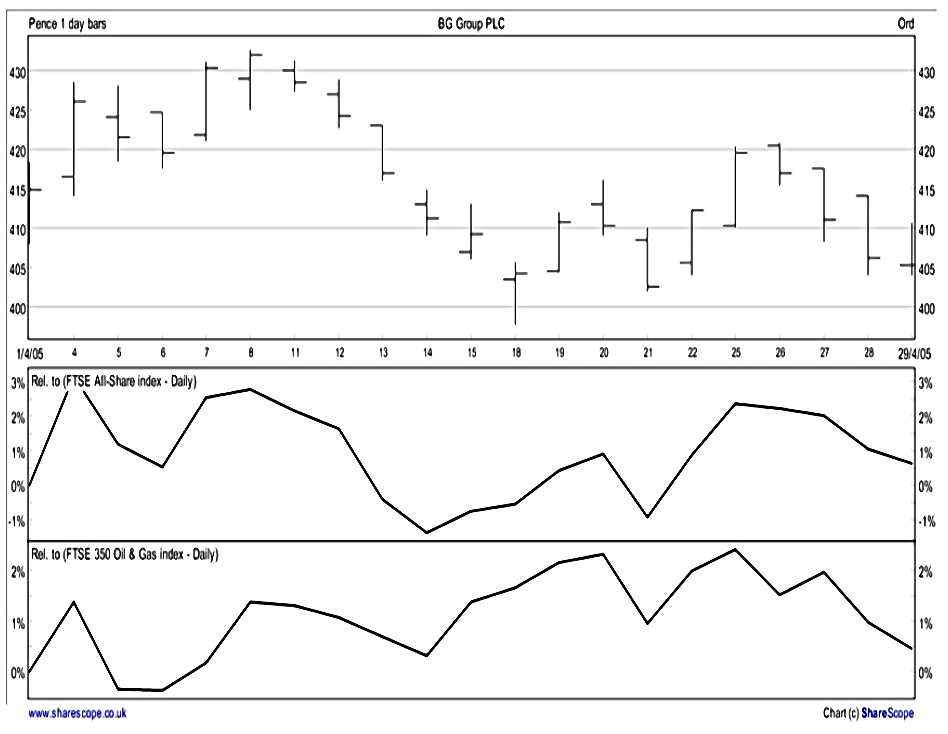
Example – BG Group
Malcolm uses four charts to illustrate the set-up to this trade:
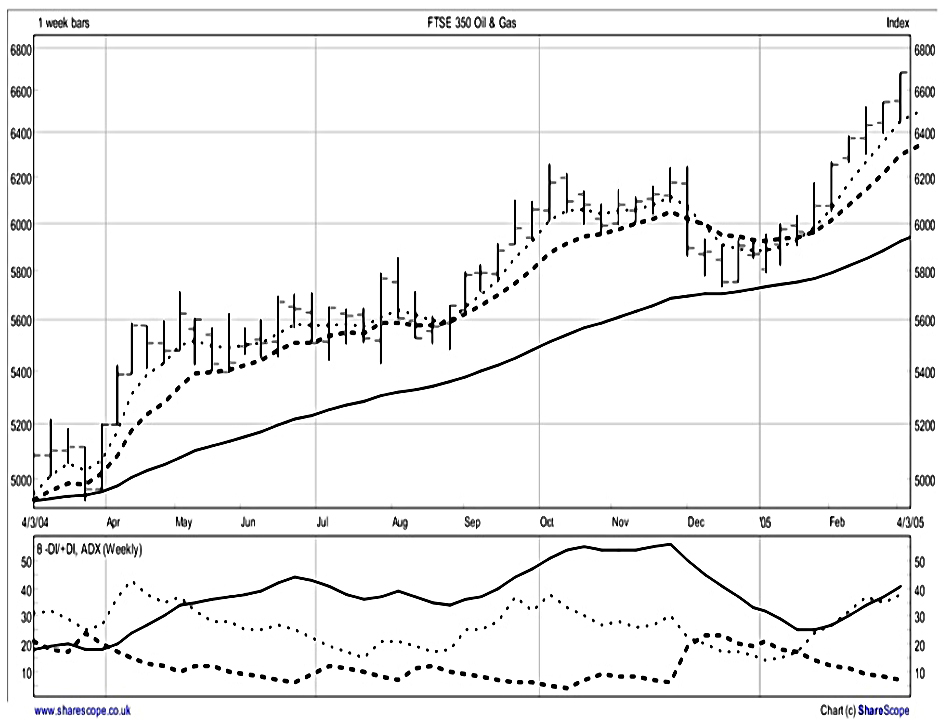
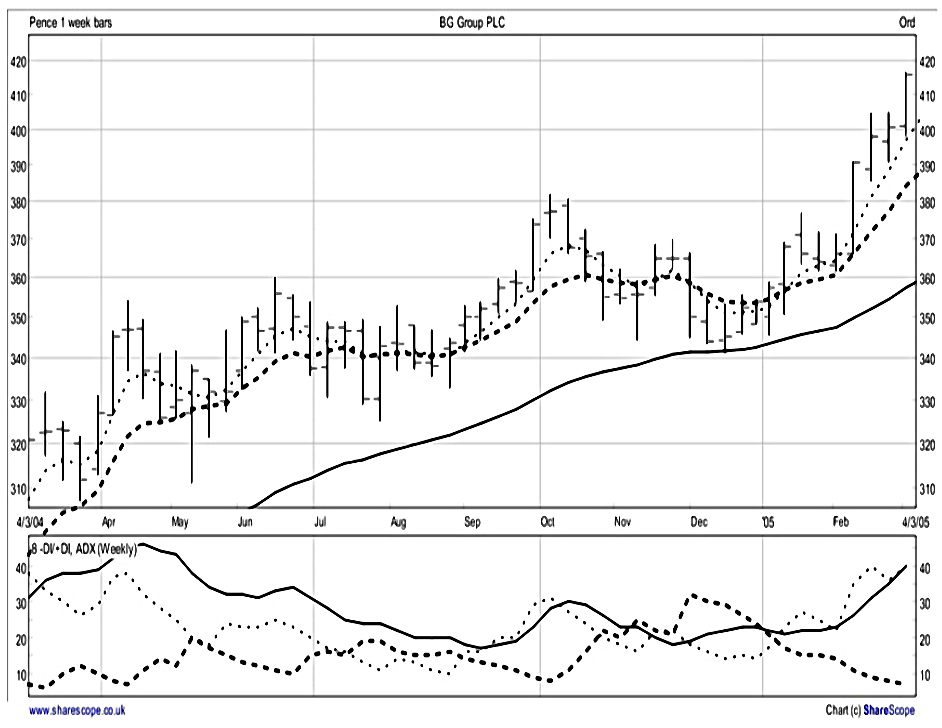
The All Share, the Oil and Gas sector and BG itself are all in strong up trends:
- The moving averages are in up-trend mode.
- The ADX indicator is significantly above 25, with +DI above -DI.
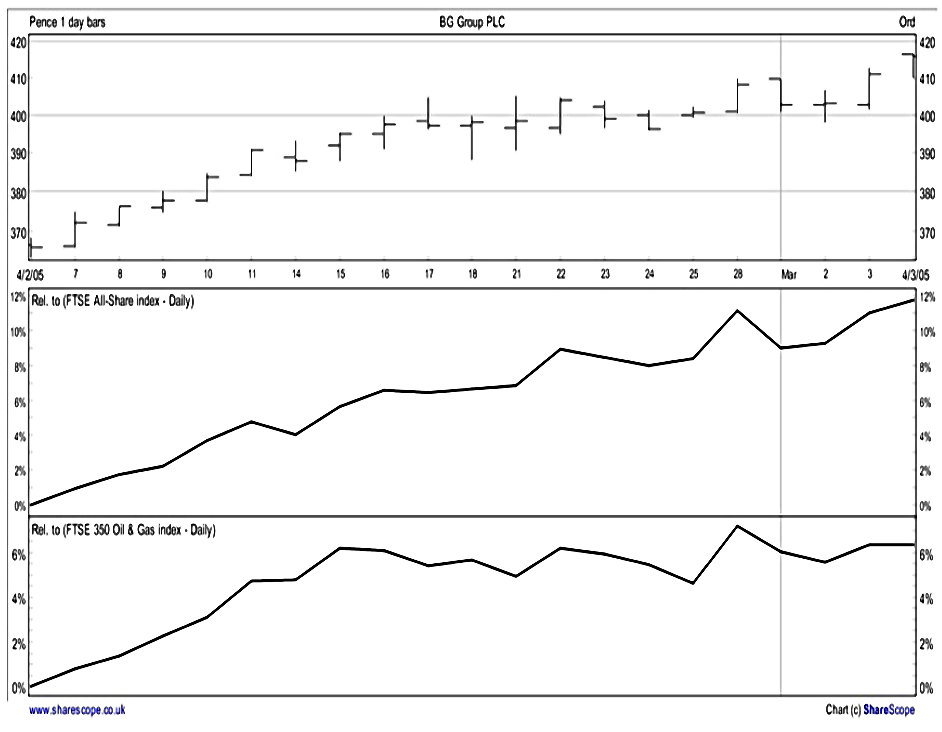
A daily chart shows that BG is outperforming its sector and the index over four weeks.
- Note that ShareScope seems well suited to these comparisons.
Malcolm enters the trade at 415p, with a stop at 390.25p.
- He bets £8 per point, so that he is risking £198 (24.75 * 8).
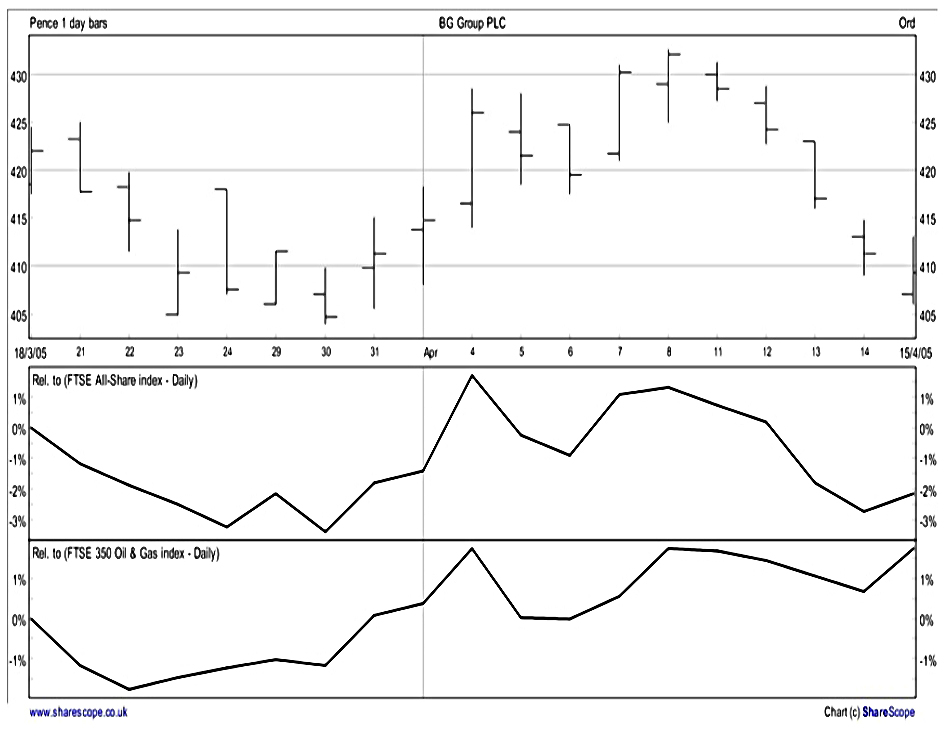
After a week, BG is now underperforming the All Share over four weeks.
- One more bad week will be a signal to exit.

After the second week, outperformance is back up to 1.5%. so the exit signal is cancelled.
After another week, outperformance is back below 1%, and we’re halfway to the exit once more.
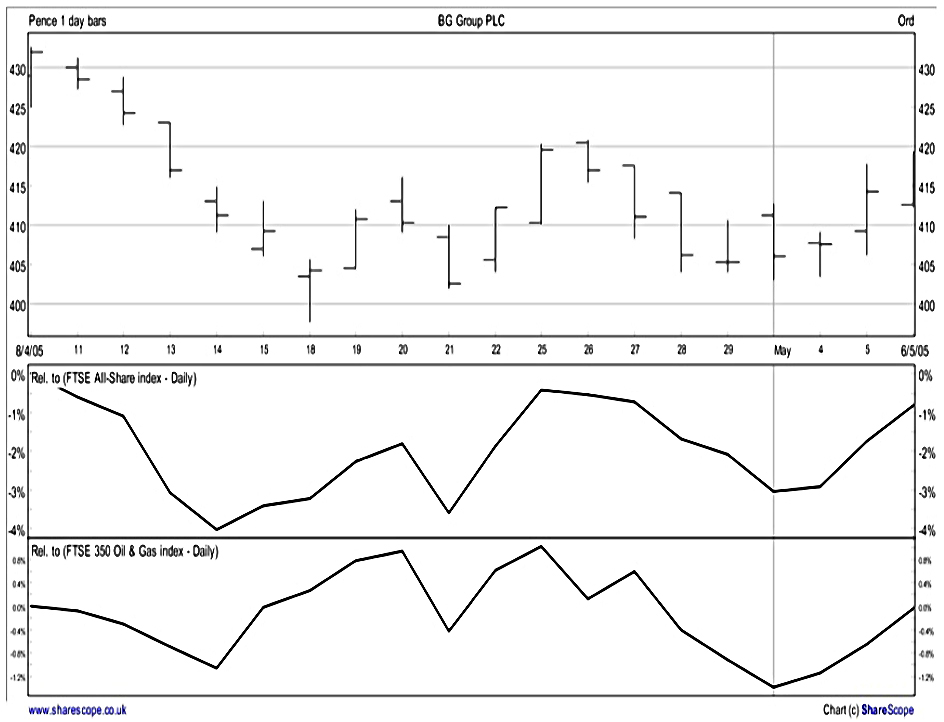
This time the sell signal is confirmed, and Malcolm exits at 419.25, for a small profit.
We entered a trade according to our system, and we exited the trade according to our system.
As it happens, after we exited the share renewed its up-trend and we could have made a good profit by hanging on longer. It is important not to get agitated by this.
The art of trading is not to get the best result on every single trade, but to play a percentage game over a series of trades.
There are other examples of this strategy in the book, but once again I hope one is enough to give you an understanding.
Those are Malcolm’s only two strategies for bull markets, so we’ll leave it there for today.
- We’re about halfway through the book, and I expect to complete it in another two articles.
The next post in the series will be on strategies for bear markets.
Until next time.
Mike Rawson
Mike is the owner of 7 Circles, and a private investor living in London. He has been managing his own money for 40 years, with some success.