Asset allocation vs. Costs vs. Taxes

Today we’re going to look at the impact of asset allocation on your returns, and compare this to the impact of costs and of taxes.
Global Asset Allocation

Meb Faber, who we’ve met before, has a new book out, his fourth. It’s called Global Asset Allocation, and it does what it says on the tin: compares the performance of the most popular asset allocation strategies.
[amazon text=Amazon&asin=B00TYY3F3C&text=Global Asset Allocation&template=thumbnail]
[space]
The book has been widely reviewed, most notably for our purposes by John Authers in the FT and by the Monevator blog.

Both of the reviews were headlined to the effect that costs (fees) are more important than asset allocation, but I think that things are a bit more complicated than that.

The Portfolios
In his orginal blog post from 2013, Meb looked at nine portfolios:
- The classic 60/40 equity – bond split
- The Andrew Tobias 3-Fund portfolio
- The Permanent Portfolio from Harry Browne
- The William Bernstein portolio
- The Ivy Portfolio
- The Swensen portfolio
- The Risk Parity Portfolio
- The Arnott portfolio
- The El-Erian portfolio
I’ve ordered them in terms of the number of asset types they contain, from two in the 60/40 portfolio to eleven in the El-Erian portfolio. The sources for the asset allocations are in Meb’s post, but here is my summary table:
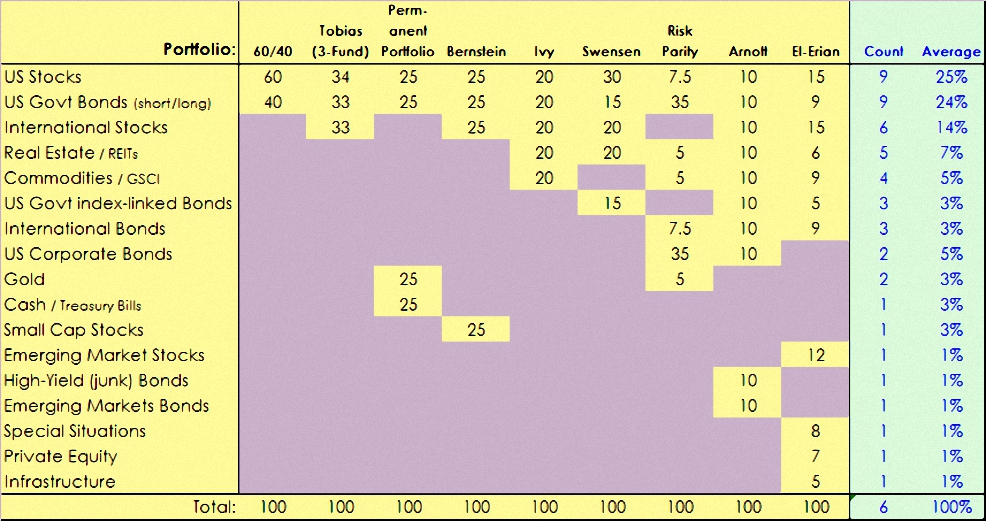
The last two columns in the table show the number of portfolios including a particular asset, and the average weighting over all nine portfolios. Some observations about the allocations:
- the average portfolio has six asset types
- only US stocks and US government bonds are present in all portfolios
(average 25% and 24% respectively) - 8 of the 17 asset types appear in only a single portfolio
(accounting for 11% of the allocations) - US home bias is staggering – 73% of assets are allocated to the US,
even after counting Gold and Commodities as international,
and no portfolio allocates less than 55% (El-Erian) to the US - the average weighting to stocks is 44%
(range is from 7.5% [Risk Parity] to 75% [Bernstein]) - the average weighting to bonds/cash is 40%
(range is from 20% [Ivy] to 78% [Risk-Parity]) - the average weighting to other assets (real estate, commodities, private equity) is 16%
(range is from 0% [3 portfolios] to 40% [Ivy])
I think we can agree that this is a diverse set of portfolios.
The results
Meb looked at performance from 1973 to 2013. That seems fair enough to me. I started investing aged 25 and don’t expect to convert my portfolio into an annuity before I’m 75, if at all. So my investing career will last for fifty years ((Assuming I manage to keep going for the next twenty years)) but lots of people probably start a bit later. We can live with a forty-year analysis.
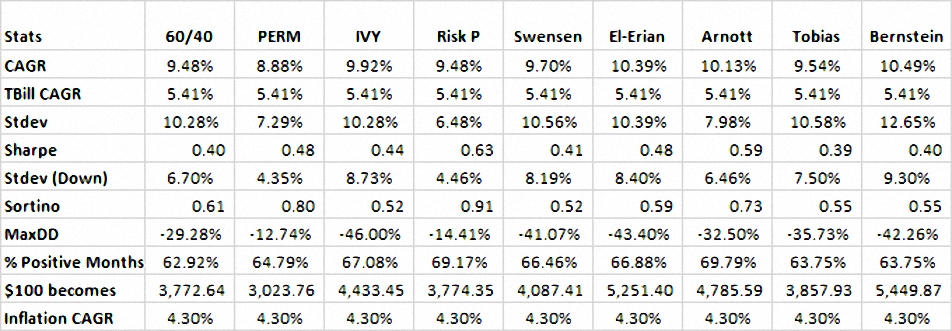
Here is what he found:
- The range of returns was between 8.9% pa (Permanent) and 10.4% pa (El-Erian)
- The second-worst strategy (9.5%, 60/40) was less than 1% pa below the best
- The comparable risk-free rate for the period (T-bills) was 5.41% pa
- Inflation was 4.3% pa
- Standard deviation of returns ranged from 6.5% (Risk P) to 12.7% (Bernstein)
- Downward standard deviation ranged from 4.4% (Permanent) to 9.3% (Bernstein)
- The percentage of positive months ranged from 63% (60/40) to 70% (Arnott)
- Maximum drawdowns ranged from 13% (Permanent) to 46% (El-Erian)

Although the gap between the best and worst portfolios was only 1.5% pa, this was enough over 40 years to mean the difference between a return of 500% and over 1000% (ie. double the return). As might be expected, the less volatile portfolios tended to produce lower returns overall.
For the new book, Meb has updated the results with a new selection of portfolios, and added in global indices as well as US ones. El-Erian’s portfolio is still the winner.
Fees vs asset allocation
Meb demonstrates that adding fees can reduce the performance of the El-Erian portfolio close to the worst performing portfolio (the permanent portfolio).

The conclusion drawn by most commentators is that fees are now more important that asset allocation. I think this is wrong in practical terms for four reasons:
- the portfolios returns prove that asset allocation works
- most people’s allocations are worse than all the portfolios
- fees vary much less within a given approach to investment
- the effect of taxes is ignored, and they are just as important as fees
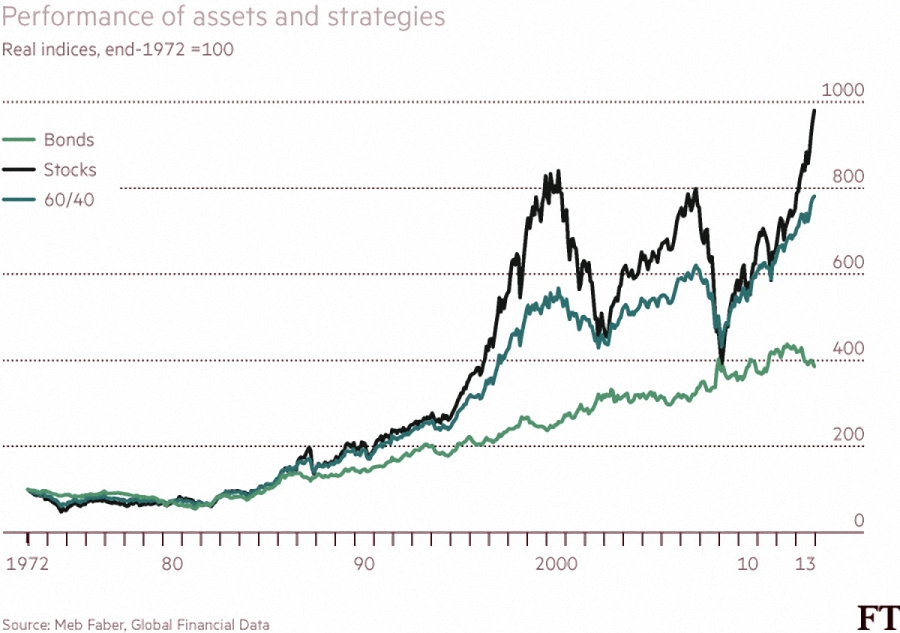
The best returns would be expected to come from a 100% allocation in the best performing asset, usually held to be stocks. The problem is that stocks are volatile from year to year and regularly suffer large (20-40%) drawdowns. In deviating from this single asset portfolio, asset allocation is not typically buying additional returns, but is in fact sacrificing returns for a smoother ride (lower volatility).
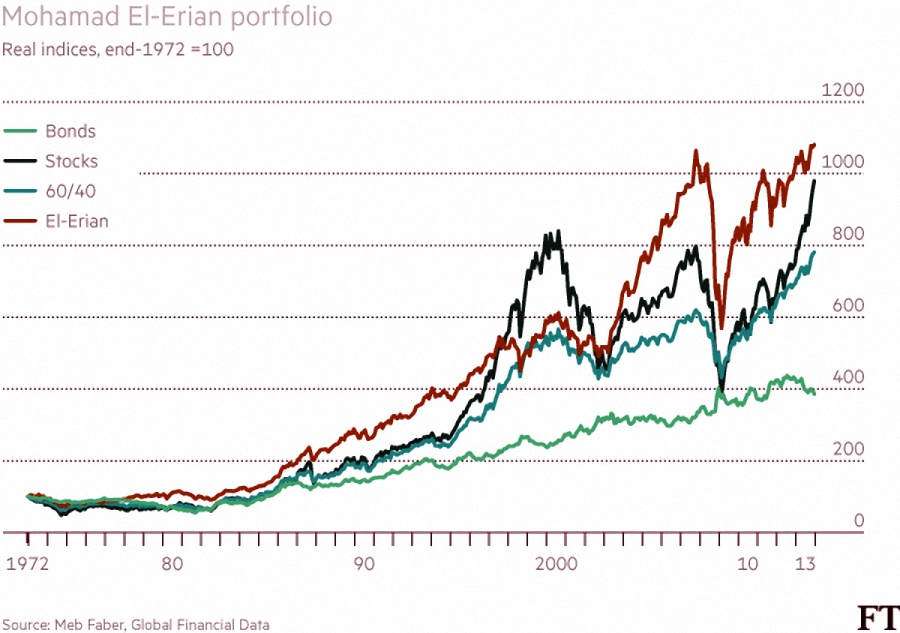
This is shown by the tendency of the least volatile portfolios to underperform. But El-Arian’s portfolio (the best performing, with the most asset classes) outperforms even the 100% stocks portfolio, and was only behind it during the dot com boom. This is clear evidence that asset allocation works.
I would further argue that most investors do not start from even the 60/40 position. People begin with cash, and then add a bit of real estate via equity in their home, then they add some stocks. Many hold only stocks from their own country, few hold bonds at all, and almost none get as far as the El-Arian allocation. So there is lots of room for improvement in terms of asset allocation in the typical portfolio.
Fees on the other hand are much more difficult to reduce. Once you have decided to invest via active funds on a platform, or via ETFs or individual stocks, the costs within a category don’t typically vary by more than 1.5% pa. Yes, it’s a mistake to pay 2.5% pa for a closet tracker fund rather than an actual ETF tracker, but once you know that, you’ll be lucky to save much more by shopping around for your ETF.
And once you have been investing for some time, even if you do spot a cheaper way to get the exposure that you want, moving your investments across will not usually be easy or inexpensive. Many will resort to simply adding new money to the cheaper solution, resulting a patchwork portfolio which acts as a Wayback Machine of investment solutions.
Taxes
It’s not clear to me why the “small” variation in returns is compared only to annual fees and not also to taxes. I suppose the clue is in the name “annual” – tax savings are difficult calculate as an annual percentage, since they depend on growth rates and holding periods. But they are nevertheless real, and large, especially for higher rate taxpayers.
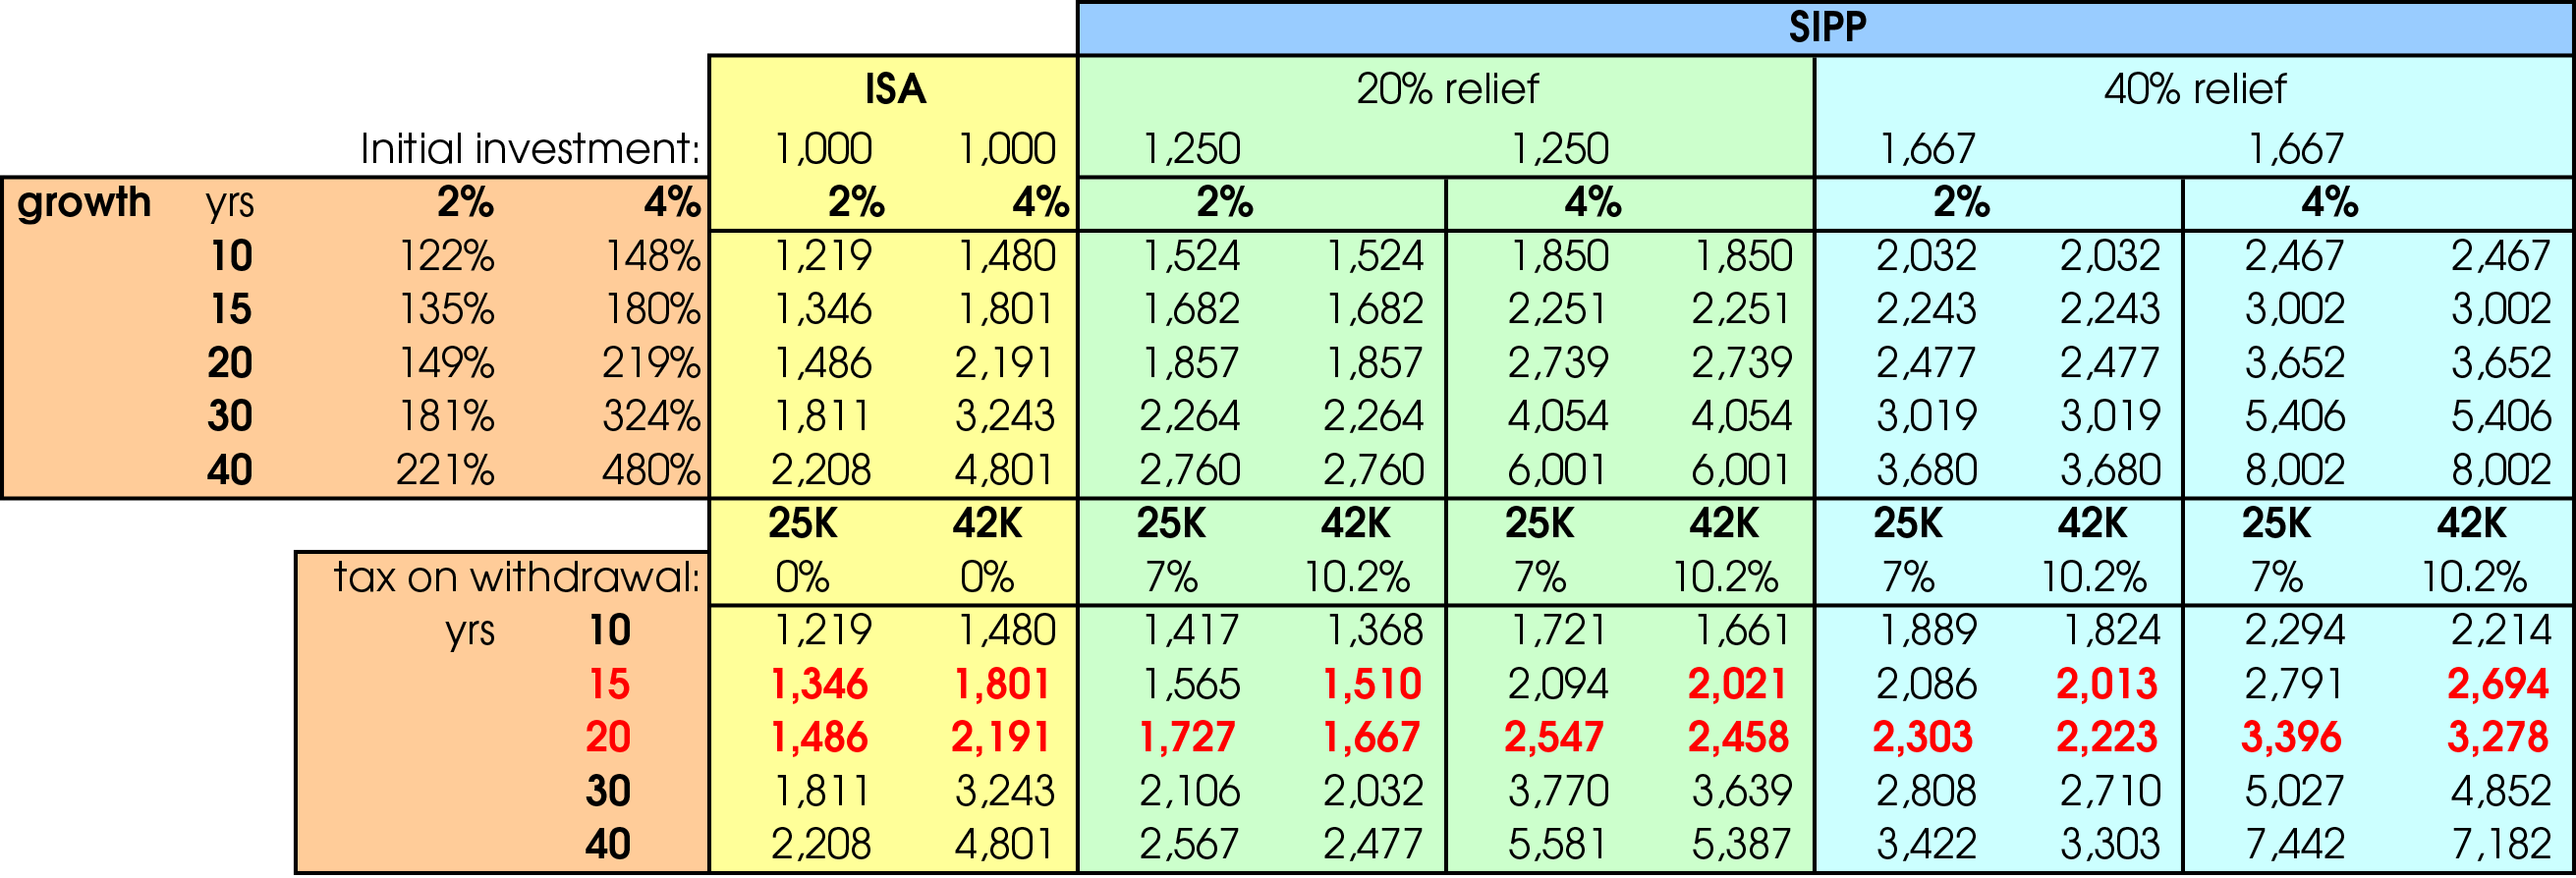
In the UK, saving in a SIPP for 40 years could easily produce returns more than 50% higher than saving in a ISA, with an even bigger advantage over a taxable account. See here for more on SIPPs vs ISAs.
Conclusions
- Asset allocation matters – the difference between the best and worst portfolio over 40 years was an extra 100%. The difference between the best and where most people start from is larger still.
- Fees vary, but not so much for the specific investments you desire. Moving from your existing solution to a new, cheaper one may be difficult and expensive.
- Taxes matter as much as fees and asset allocation.
What matters most between asset allocation and taxes and fees depends on where you are starting from. If you already have an 8 out of 10 asset allocation, but you have a 4 out of 10 fee structure, then for you it’s more important to work on fees. If you have a 2 out of 10 approach to tax shelters, that’s what you should focus on.
The idea is to have 8 or 9 out of 10 across the board. Then you can be pretty sure you’ll come out ahead in the long term.
Until next time.
Mike Rawson
Mike is the owner of 7 Circles, and a private investor living in London. He has been managing his own money for 40 years, with some success.


Thanks for this helpful review.
I will be putting this on my reading list!