Shannon’s Demon
Today’s post is about Shannon’s Demon, the basis for the only free lunch in finance.
Contents
Shannon
Claude Shannon was a US mathematician, electrical engineering professor at MIT and Bell Labs researcher. Amongst many other things, he worked with Ed Thorp to develop the world’s first wearable computer (in order to improve the odds of winning at the roulette wheel). Shannon is also known as the father of information theory (and of the information age).
The Demon
There’s nothing sinister about the name – back in the 1940s, Shannon intended it to denote a thought experiment. The idea is that a pair of assets, each with a zero expected return, can nonetheless produce a positive return if they are less than perfectly correlated.
An easy-to-understand version would be an asset which each day either doubles (from 100 to 200) or halves (from 100 to 50). The two outcomes for tomorrow sum to 250, so the arithmetic return is 50/2 = 25% (over one day, in this extreme example).
Unfortunately, the doublings and halvings occur with equal frequency, so the long-run expected value is zero. This is also the geometric return. The difference between the two is known as the “volatility tax” or volatility decay.
Stock plus cash
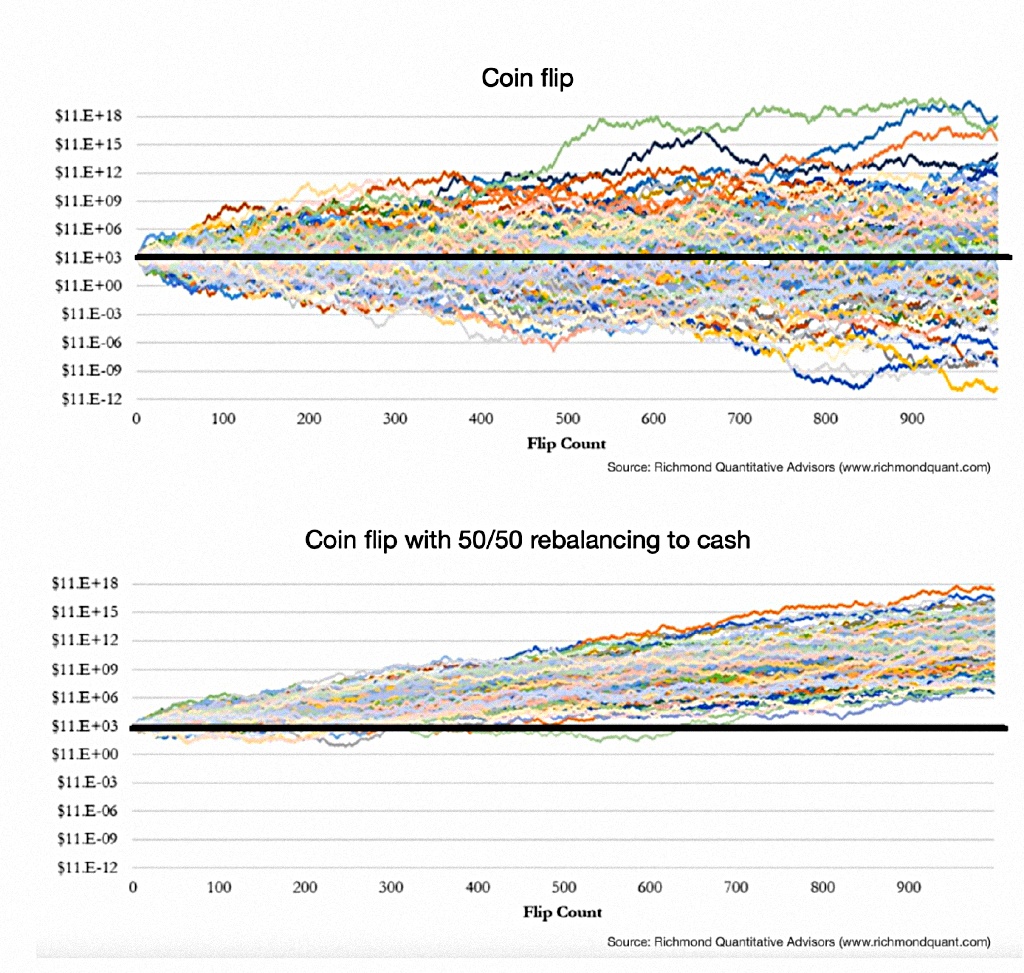
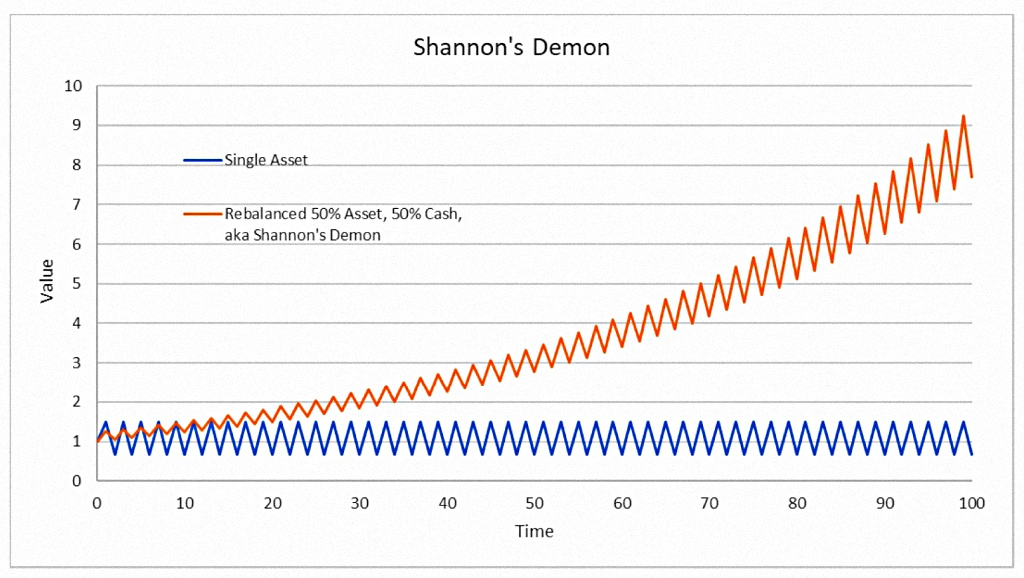
Shannon’s first variation was to put half of his money into the asset and keep half in cash. Then, after each turn (each day), you rebalance back to equal shares. So when the asset (stock) goes down, you buy more, and when it goes up, you sell.
This is the rebalancing premium, or buy low, sell high. It brings the expected return (in this extreme example) up to 6% per day, a quarter of the way to the arithmetic mean.
It’s also known as volatility harvesting (or volatility pumping). In options terms (I’m no expert), it seems to be a short gamma strategy like selling straddles.
Two stocks
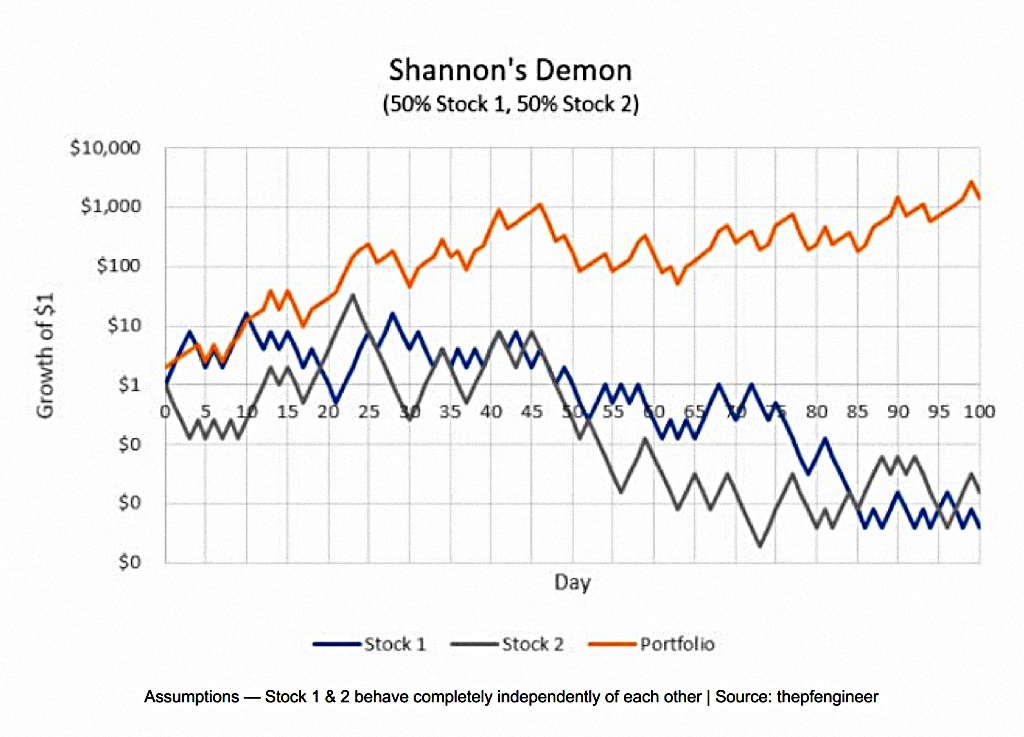
Now, if we use cash, we lose (versus 100% stocks) by holding half of our portfolio in a low-return asset.
We can do better by using two assets with similar returns that are poorly correlated. We should get a better return, and we should also get a lower variance (around two-thirds of the mean of the two individual variances).
In this scenario, we are looking for mean reversion between the two assets (over some timescale). Prolonged trending in one direction should hurt.
Easier Implementation
When I first came across the demon, I ruled out using it because of transaction costs – indeed, Shannon didn’t use the system himself, and said: “The commissions would kill you”.
But things are different today:
- We can choose ETFs of poorly correlated assets rather than individual stocks
- We can create baskets of ETFs (known on the trading apps as pies or plans) that capture the poor correlations
- We can rebalance these baskets as frequently as we like, with no transaction costs (the bid-offer spread can’t be avoided, but on liquid ETFs it is small).
Frequency
Optimum frequency of rebalancing is an issue. Shannon’s original thought experiment suggests that the more frequently you rebalance, the better. But he has an assumption that we need to challenge – completely random returns (from the risk asset).
Since our risk asset will normally be some flavour of stocks, trends are an issue.
Whilst I haven’t looked directly at Shannon’s demon before on this blog, we have looked at rebalancing, and in particular, the optimum rebalancing period.
- The idea is to wait long enough for trends to play out and mean reversion to kick in.
- With stocks, trending seems to work between two and eighteen months, while over several years, mean reversion wins.
- We also need to consider trading costs and the bid-offer spread.
Most people just settle for annual rebalancing, or even rely on cash flow rebalancing (where new contributions are added to assets that have gone down, or withdrawals are taken from assets that have gone up).
That clearly won’t work for Shannon portfolios.
- Instead, I plan to treat Shannon as a special case within TAA,
Most TAA strategies use monthly rebalancing, and that seems fine to me.
- As I plan to run several Shannon portfolios, I will rebalance each on a different day of the month.
What are we looking for?
We need three things for the demon to work best:
- Volatility
- Similar levels of returns between the assets
- This is not so easy if you also want high returns
- It makes an argument for some stock-only Shannon portfolios, as well as some multi-asset portfolios.
- Lack of correlation
- Negative correlations are best, but few things are reliably negatively correlated with stocks
- Low or no correlation is fine (after all, cash was the safety asset in the original thought experiment
- Low rebalancing costs
Leverage
It’s important to note that a Shannon portfolio will not match the performance of a portfolio made up of simply the highest-returning asset (typically stocks).
- Instead, we’ll get a bonus relative to a buy-and-hold 50/50 portfolio.
- We should also get a volatility bonus (lower volatility than the 50/50).
To get back to maximum returns, we need to use leverage (usually elsewhere in the overall portfolio than in the Shannon section).
- We can also reduce the impact by holding more than 50% in risk assets (either inside or outside the Shannon section – you’ll see below that around half of my Shannon portfolios are entirely stocks).
Some Shannon Portfolios
I have managed to come up with around a dozen ideas for Shannon portfolios, depending on how you count them. Some might be difficult to access (either within SIPPs/ISAs, or because the platforms with pies don’t have the relevant ETFs.
- Risk Parity
- Classical diversifiers – these are simplified or lazy portfolios, and we have several options here:
- Stocks / Bonds (and/or Cash)
- Stocks / Gold
- Stocks / Metals / Commodities / Real Estate
- Geographical:
- Regions (US / Europe / Asia)
- US v World Ex-US
- China/frontier markets vs the US
- Themes, including:
- Rare Earth and Strategic Metals
- Space Innovators
- Lithium & Battery Tech
- Hydrogen
- Uranium
- Solar / Clean Energy
- AI & Big Data
- Ageing Population
- Drones
- Physical, Robotics & Automation
- Water
- Blockchain
- Factors (mixed and multi):
- Momentum
- Value
- Quality
- Low Vol etc.
- Sectors:
- Mining
- Energy
- Semiconductors
- Defense
- Industrials
- Utilities
- Communications
- Consumer Staples
- Healthcare
- Information Technology
- Financials
- Insurance
- Consumer Discretionary
- Cybersecurity
- Leverage ETFs – both 50% (capital efficiency) and 100% leveraged
- Stocks vs Trend (CTA futures)
I’ll report back in a future post on how I get on.
That’s it for today.
- Until next time.
Mike Rawson
Mike is the owner of 7 Circles, and a private investor living in London. He has been managing his own money for 40 years, with some success.