TAA and the 2022 Bear

Today’s post looks at a review by Allocate Smartly of how well Tactical Asset Allocation worked during the 2022 Bear market.
Contents
TAA and the 2022 Bear
Tactical Asset allocation didn’t have a good 2022 bear market.
- It failed to protect adequately against losses, which is one of its key functions.
Allocate Smartly (AS) wanted to find out why, and what could be done about it.
- The results were published on their blog in September 2023.
The headlines are:
- TAA did switch from a risk-on (aggressive) to a risk-off (defensive) position as it was intended to do
- The choice of defensive assets (long-duration US Treasuries) was incorrect, as bonds had their worst drawdown within a stock crash for 100 years.
Lack of protection
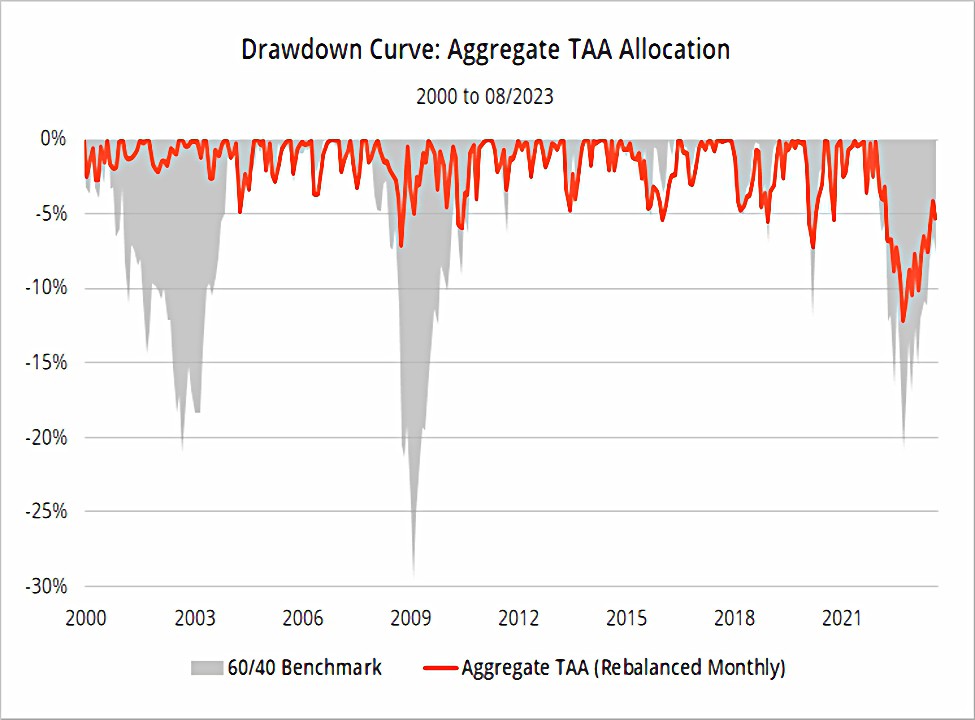
AS tracks more than seventy TAA strategies, but for the purposes of this analysis, they used an aggregate allocation.
Over the period from 2000 to 2022, there were three big market drawdowns:
- 2000-2002
- 2007-2008
- 2022
TAA offered good protection against the first two but largely failed in 2022 (the drawdown was lower than for a 60/40 benchmark, but was still painful).
- The TAA max drawdown in 2002 was 12%, compared with 3% in 2000-02 and 7% in 2007-08.
- The drawdown has also lasted much longer.
Note that TAA did particularly well against the first two bears (compared to pre-2000 bears) so this is a tough comparison.
Switching worked
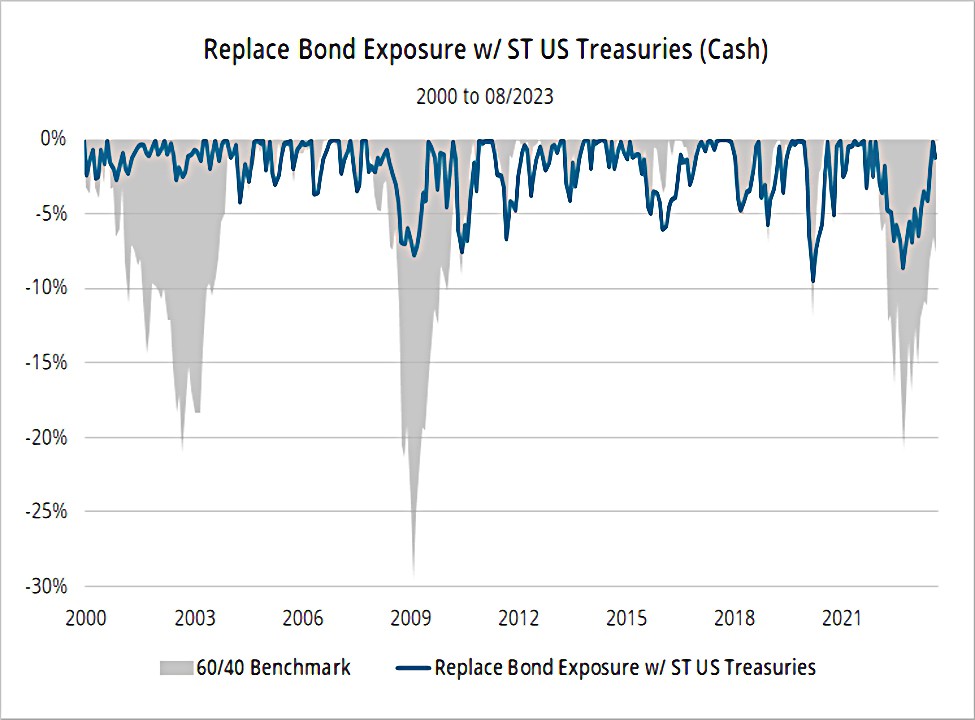
To demonstrate that the problem was not one of timing, AS switched out the risk-off asset (largely Treasuries, but also international bonds) with T-Bills (effectively, Cash).
Removing the interest rate risk brings the 2002 drawdown back in line with the earlier bear markets.
Bonds failed badly
The real problem was that bonds and stocks went down together.
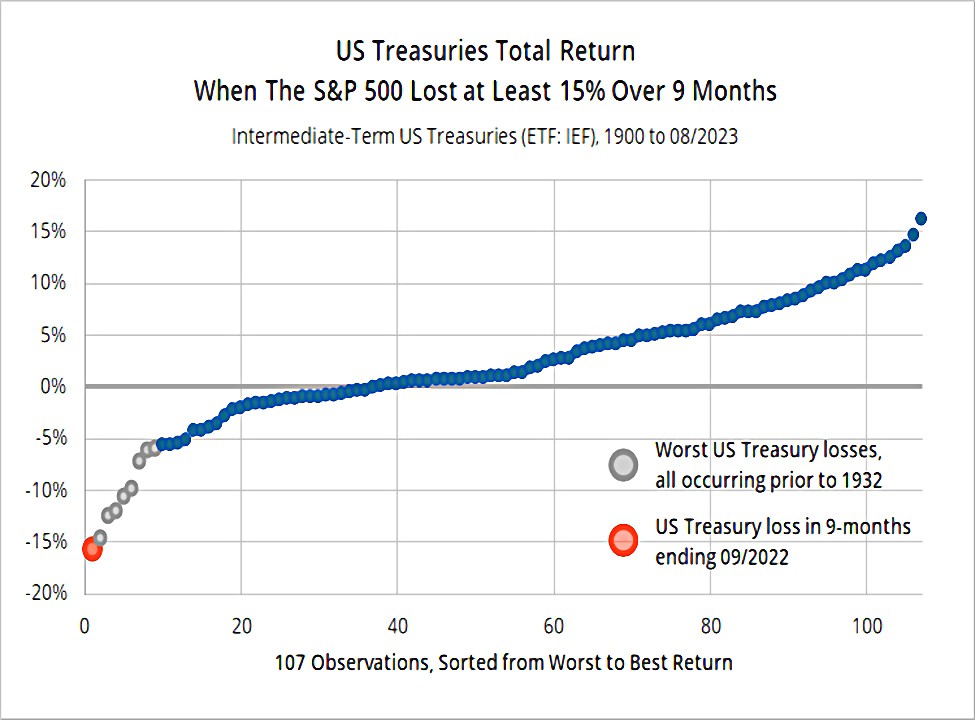
- From Jan to Sep 2022, the S&P 500 lost 24% and US Treasuries lost 16%.
The chart plots all 9-month periods where the S&P lost more than 15%, dating back to 1900.
- The dots plot the Treasury returns for the same period.
The orange dot is last year – the worst performance in 120 years.
The next eight grey dots all happened between 1907 and 1931
- These should have provided a sufficient warning for TAA design to include the possibility that stocks and bonds would fall together, but they seem to be far enough back in the past that this didn’t happen.
Comparing strategies
For the next stage of the analysis, AS looked at the performance of individual strategies.
- The ones that blindly dumped into bonds as a defensive asset did poorly.
- Those that require defensive assets to have positive momentum (and used cash as a backstop defensive asset) did much better.
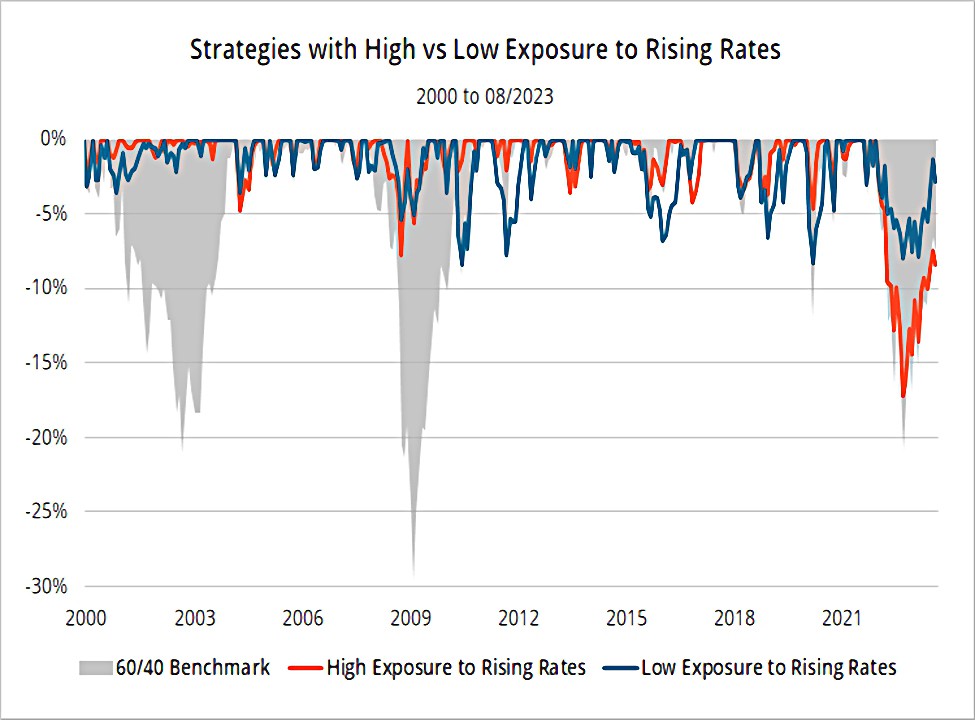
The chart splits strategies into two groups, based on their exposure to rising interest rates:
- the blue line is the bottom third of strategies with the lowest exposure
- the orange line is the top third of strategies with the highest exposure
The high-exposure funds didn’t do much better than the 60/40 benchmark (max drawdown 17%).
- The low-exposure funds had a max drawdown of 8%.
That’s it for today.
- The lesson is that bonds won’t always protect against stock crashes, especially in a rising interest rate environment.
You need to diversify your defensive assets and/or use a momentum filter when selecting them, with cash as a backstop defensive asset.
- Until next time.
Mike Rawson
Mike is the owner of 7 Circles, and a private investor living in London. He has been managing his own money for 40 years, with some success.