Beta Rotation with Utilities

Today’s post is about a paper from Michael Gayed on Beta Rotation with Utilities.
Contents
Michael Gayed

I came across Michael Gayed only recently, on a Meb Faber podcast.
- Michael publishes a newsletter, called the Lead-Lag Report, and you can also follow him on Twitter.
Michael was an entertaining and informative guest, so I looked up his papers on SSRN.
- He’s written five that I could find, and almost all of them seem to have won awards.
So I emailed Michael and he kindly agreed to let me write about them.
- They are mostly in the area of sector rotation, which for now is grouped with market timing on this blog. (( We don’t as yet have many articles on these two topics, so I don’t feel the need to separate them ))

Beta Rotation with Utilities
Michael’s paper is called “An Intermarket Approach to Beta Rotation” – but since a lot of Michael’s papers are about rotation and this one uses a signal from the utility sector, I find it easier to refer to Beta Rotation with Utilities.
- The paper is originally from 2014 but has been updated with data to October 2020.
The strategy within is described as the Beta Rotation Strategy or BRS.
The Utilities sector has many unique characteristics relative to other sectors of the broader stock market, including its higher yield, lower beta, and relative insensitivity to cyclical behavior.
The BRS is a “buy and rotate” strategy which is either exposed to the broad market or just to the utility sector, based on “lead-lag dynamics”.
Absolute performance and risk adjusted returns for this beta rotation approach significantly outperform a buy and hold strategy of the market and of the Utilities sector throughout multiple market cycles.
Intermarket analysis
The idea for the strategy comes from intermarket analysis, a form of technical analysis that examines how relationships between asset classes can predict economic and market cycles.
One of the more recognized relationships is between bonds and stocks, where bonds tend to lead preceding equity market tops and bottoms. It stands to reason then, that Utilities, the most bond-like sector of the stock market, would also show such leadership characteristics.
The idea that one can generate excess returns through defensive beta rotation is not new.
He mentions earlier researchers in the same area:
Murphy has stated that prior to a stock market top the “interest rate sensitive stocks, like the utilities and banks, usually start to break down. The most prominent and reliable are the utilities.”
Martin Pring wrote of the “tendency” for Utilities to “put on their best performance relative to the market on either side of the bear market low.
Gould referred to the Dow Jones Utilities Average as “one of the best early indicators of the stock market. Utilities are money sensitive. Their steady growth requires huge and insistent capital investment so that their position and outlook is more dependent on interest and capital rate changes than are Industrial shares”.
Others have suggested that such an approach would not beat buy and hold, but these studies used other strategies:
Davis and Philips used macro cyclical indicators (such as the yield curve), valuation (such as forward P/E), and an arbitrary definition of momentum (a 5% or 10% drop in the market over the trailing 12-months) as their risk triggers.
These assumptions are quite different than our approach, which purely focuses on the relative price momentum of the Utilities sector and over a much shorter time frame.
Sector (industry) momentum is well established in the one-month to the 12-month time range.
Regulation
Utility signalling power is largely down to government regulation:
The earnings of the Utilities sector became more and more driven by the cost of capital rather than revenue growth prospects.
When expectations for falling interest rates increased, Utilities tended to outperform the market due to a less robust growth period for the overall economy anticipated by investors in the sector. Conversely, when expectations for rising interest rates increased, Utilities tended to underperform.
So as the yield curve leads the wider economy, Utilities lead the stock market (and inflation, interest rates and volatility).
The strategy
Michael used Fama and French price data, which goes back to 1926:
When a price ratio (or the relative strength) of the Utilities sector to the broad market is positive over the prior 4-week period, position into Utilities for the following week.
When a price ratio (or the relative strength) of the Utilities sector to the broad market is negative over the prior 4-week period, position into the broad market for the following week.
So it’s a simple weekly rotation in and out of utilities, using a 4-week relative strength signal.
Results
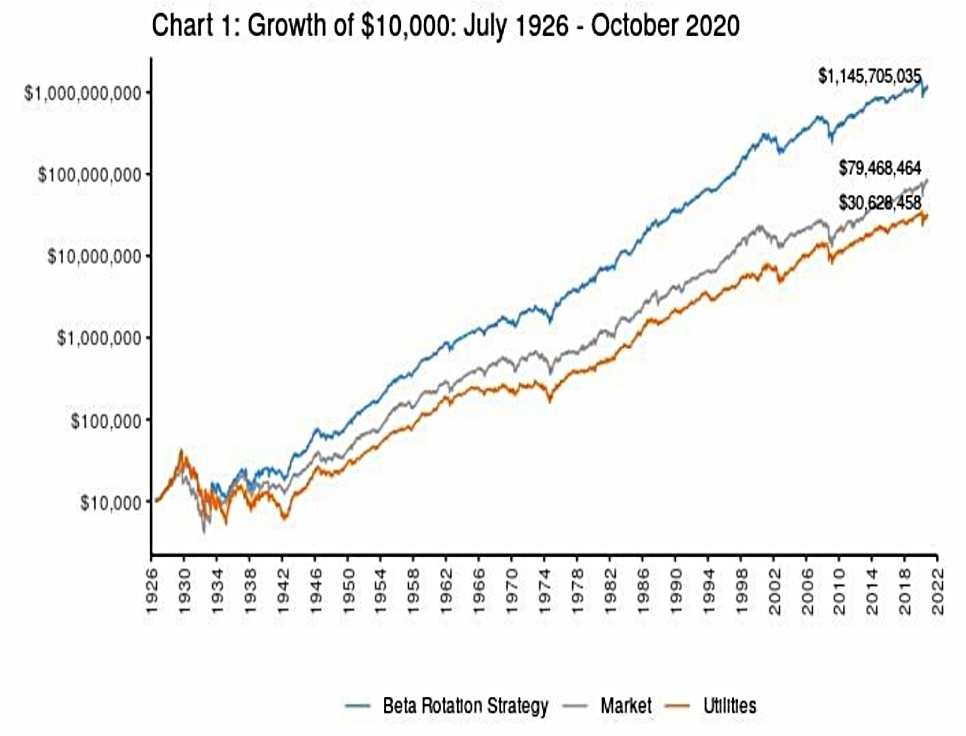
Long-term, the results are pretty good.
- BRS grew $10K to $1.15 bn from 1926 to 2020, compared to $79M for the US market and $31M for the Utility sector alone.
In annualised terms, this is 13.1% for BRS, compared to 10% for the market and 8.8% for Utilities.
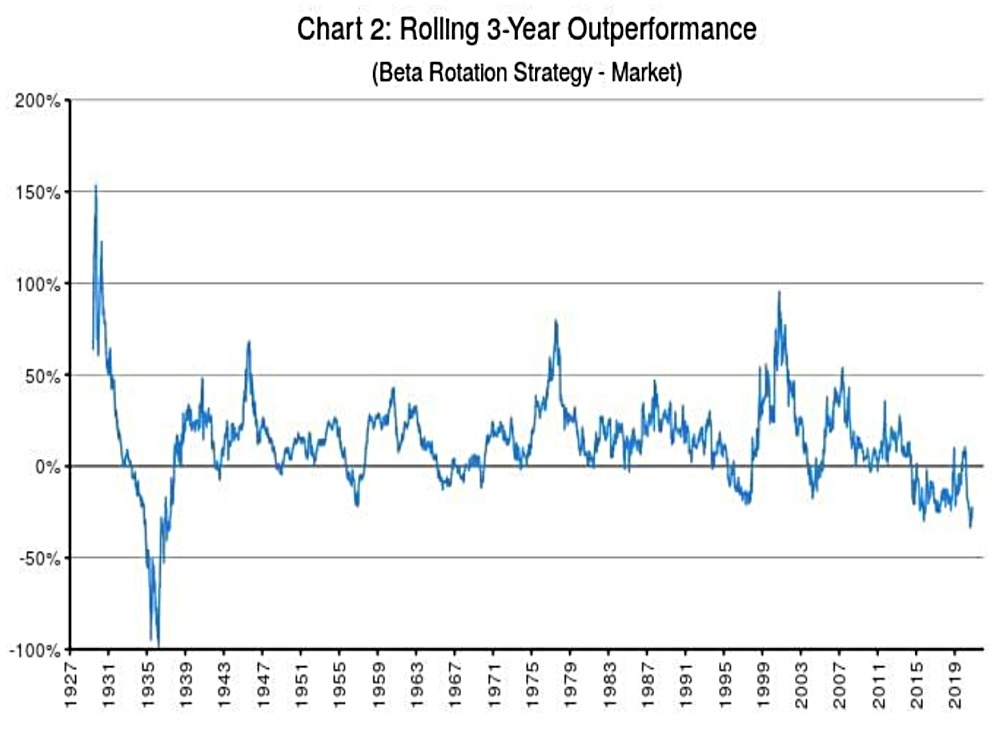
- These results stand up well to analysis across legislative regimes and across decades.
The strategy also provides superior risk- (volatility-) adjusted returns (a la Sharpe ratio).
Michael also tested a long/short version of the strategy (long market or long utilities and short the market).
- This produces positive returns in all periods, but I don’t think it beats buy and hold (this data is missing from the table).
Volatility signal
Michael compared the volatility of the market when the BRS is in Utilities (he calls this “Utilities are leading”) with volatility when the BRS is in the market (“Utilities are lagging”).
- Volatility is 18.7% when BRS is in Utilities vs 16.9% when BRS is in the market.
The spread is 4.4% (18.1% vs 13.7%) since 1963.
Michael also looked at the worst weeks for the markets (crashes):
During those weeks, the BRS was in Utilities for a significantly higher percentage of time than overall, suggesting that Utilities strength is a leading indicator of market volatility. In the worst 2% of weeks (declines > 5.5%) in history, the BRS was in Utilities 56.6% of the time versus 49.4% overall.
They found similar results when they looked at the periods where the VIX was highest:
The BRS strategy was positioned in Utilities at a much higher rate during periods of market stress than overall.
Seasonal effects
Seasonal effects in the stock market (poor summer performance) are well known, hence the phrase “sell in May and go away”.
Performance is significantly higher during the November through April period than the May through October period. This is true for the Utilities sector, the market, and the BRS. The percentage of time the BRS is in Utilities is significantly higher in the summer months (50.7%) than in the winter months (48.2%).
Utilities are the sector which shows the lowest seasonality. Because of this:
Deviations in their relative strength would have more predictive power than other sectors.
Given that Utilities are the most bond-like sector of the market, changes in interest rates are likely a driving force behind these deviations. Interest rates have tended to fall during the May through October period and rise during the November through April period.
Michael compares the BRS to a simple rotation into Utilities from May through October:
BRS shows 2.8% outperformance vs. this strategy overall and outperformance during both summer (0.8%) and winter (1.9%).
The power of Utilities to detect periods of market stress in all time periods, including the seasonally strong winter months, outweighs a strategy of simply avoiding stress during the summer months.
ETFs
The rise of ETFs has made the implementation of the BTS much more simple.
- After 0.1% trading costs, BRS slightly underperforms the market buy and hold strategy (7.5% pa vs 7.9% pa), but outperforms utilities (7.4% pa), from July 2001 to October 2020.
But volatility is lower and the Sharpe ratios are equal.
- I have to admit this is a disappointing result given what we have learned up to now.

The BRS had a particularly bad time in 2020, during the Covid crash.
It underperformed the market by -19.8% (-23.7% annualized), being down 14.6% since the year started. The strategy took a hit in March 2020, being positioned on the disadvantageous side for several weeks. Subsequently it would be in utilities for too long, and thereby missing a large part of the market rebound.
Quite a lot of timing and trend-following models were fooled by the rapid recovery from the 2020 crash.
Conclusions
Michael remains optimistic about the signalling power of the Utilities sector.
The Utilities sector has less economic sensitivity and is more dependent upon the cost of capital than other sectors. Therefore, fluctuations in its relative price movement can have broad implications on macroeconomic factors.
That much seems a reasonable conclusion, and I don’t see it as a massive issue that BRS didn’t deal well with the Covid crisis.
- Neither did the long-term trend-following systems of which I am a big fan.
I think there is scope to build the Utilities signal into a broader market timing system and to use a more complicated implementation than the BRS.
As Michael says:
There are a number of broader implications on the investing and trading landscape: (1) implementing option overlay strategies, (2) hedging, (3) timing of gross exposure or leverage, and (4) tactical asset allocation.
But first I will work my way through Michael’s other papers.
- Until next time.
Mike Rawson
Mike is the owner of 7 Circles, and a private investor living in London. He has been managing his own money for 40 years, with some success.