Active vs Passive – Indexing

Today we’re going to look at the Active vs Passive investing debate, and the wider implications of index funds. We’ll also touch on diversification.
Contents
Active vs Passive
The idea for this article came from a discussion on Stockopedia about an article posted back in October. ((The Stockopedia article is actually about how hard it is psychologically to buy expensive quality stocks with momentum, but somehow the discussion wandered over to the merits and demerits of index funds and passive investing )) Some of the articles that the comments linked to got me thinking about where I stand in the old active vs passive debate.
So let’s begin with what I thought before I read the comments and articles this week:
- on average passive funds beat active funds, because their costs are lower
- the average return of funds should be the market return minus their costs
- passive funds don’t need watching
- so they suit investors who don’t want to devote much time to their investments
- lots of “active” funds are really closet trackers anyway – their managers hug their benchmarks
- these funds are not worth their high charges
- there are lots of ways to beat the market average
- most of these are a lot more time-consuming than using index funds
- so they are more appropriate for the “serious” investor (one with lots of time, not necessarily lots of money)
- I split my own money between the two approaches
- in the active portion, I try to use all the factors that lead to outperformance
- I also like to back conviction fund managers, and I have a soft spot for investment trusts
Here are some of the questions I want to try to answer today:
- Which is best, active or passive?
- Are index funds a good thing, or are they dangerous?
- What is the best way to index?
- If you go active, how big a portfolio do you need to be safe?
Which is best?
Index funds and passive investing are not new – the first fund was created by Vanguard in 1976 – but they have become much more popular since the 2008 crisis.
According to some observers, index funds now hold a third of of the total assets of stock funds, up from less than 20% a decade ago. Others put the figure as low as 10%.
They are an easy sell:
- The mainstream press has cottoned on to the high fees charged by most active funds, even badly performing ones
- Each financial crisis produces a new generation of battle-scarred investors who want to take a breather from the effort of active investing
- The rise of “robo-advisors” will exacerbate this trend, since low-cost passive vehicles are used to execute the robo-advice
There’s actually some debate about the passive out-performance.
- Most studies use simple means (averages), without looking at the size of the funds
- If the larger, more popular active funds had better returns, real-world active investors might still do better than passive ones.
But then you would also have to factor in the average investor’s timing decisions – when to buy and sell, These have been separately shown to knock around 3% pa off average returns.
Parasites
Ed Croft, the CEO of Stockopedia, thinks that index funds are parasites. Since he sells (rents out) a stock data and ranking system, he has an incentive to say that, but it’s worth looking at his reasons.
Ed says that index investing is a “piggyback ride on the coat-tails of the active management community”. This is because stocks are included in (“promoted” to) the key indices because they are bid up by active investors.
- When a stock is added to an index, the passive funds then have to buy, pushing the price up further.
- Ed says that the initial bump is 9% for the S&P 500, and the overall price premium to non-members eventually reaches 40%.
So this is not really a passive strategy, in the sense of it being market neutral.
- It’s more like a large-cap growth and momentum strategy.
- It’s also a long way from the goal of a public stock-market, which is to direct capital towards the most efficient users of it.
As valuations become ever-more stretched for the market leaders, future returns must either dwindle, or continue to inflate a bubble waiting to pop.
- The larger the proportion of the market that is owned by index funds, the worse this problem becomes.
Overvalued stocks will fall harder in a correction. In October 1987 stocks in the big indexes dropped 7 percent more than non-index stocks.
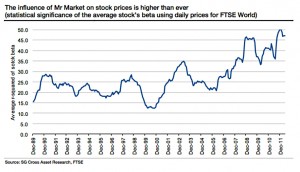
Correlations between stocks are increasing, and some people put this down to the rise in index funds.
- I think that at least part of the rise over the past 8 years is due to markets responding to macro behaviour – in particular central-bank statements and actions – in the wake of the credit crunch.
For passive investors, the technique’s increasing popularity is a problem. The more it dominates, the less likely it is to outperform.
If passive investing came to dominate the market, it would be easy to exploit.
- If an investor bought shares in a company (beyond its index weight), he would push the price up, raising its weight in the index.
- Other passive investors would then have to buy that stock to match its new weighting, pushing the price even higher.
- The original investor could then sell those shares at a profit – pushing their price back down – and repeat the trick with another index stock.
So passive investing could never truly dominate, though it could eventually lead to high volatility and almost random pricing.
- But this in turn might drive people from the market, reducing liquidity.
Which index?
One serious flaw with current index funds are mostly large-cap biased, and market-cap weighted.
Cap-weighted indexes, by definition, give a greater weight to companies with high valuations. Overvalued companies will punch above their weight, while undervalued companies have little influence.
- Here in the UK we have the further problem that the FTSE-100 is dominated by energy and resources stocks, plus financials.
Widening your scope to the FTSE-All Share makes little difference in a market-cap weighted fund since so much of the market cap is still provided by the biggest 100 stocks.
- Using a FTSE-250 index fund (if you can find one) alongside a FTSE-100 one would be a better approach.
We have a different problem at the bottom end of the market. AIM is riddled with terrible companies, and the AIM index routinely loses money. Yet there are dozens of good and profitable companies listed on the market, and lots of stocks make good returns each year.
- This is definitely an area where active management pays off.
The same is probably true for illiquid and poorly governed markets, like emerging and frontier markets, where active managers may be able to leverage an information advantage.
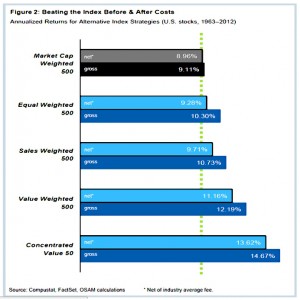
A better option for indices would be to use equal-weightings. This is an approach used by many active investors in their portfolios.
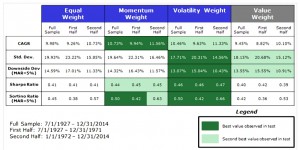
Alpha Architect looked at index weightings in detail. They compared equal-weight (EW), to momentum weight (MW) to low volatility weight to value-weight (market cap weight, VW) for the 250 largest firms in the US.
- The small sample size was chosen to allow the study to go back to the 1920s, when there were fewer listed firms.
- Returns from the top 250 stocks each month were 99.5% correlated with S&P 500 returns.
Low volatility worked the best on a risk-adjusted basis over 87 years, but all results were similar. Value-weighting (market cap) came last.
- Volatility weighting has the highest Sharpe and Sortino Ratio in all periods and has the highest risk-adjusted returns.
- Momentum weighting has the highest CAGR in all periods, but follows volatility weighting on a risk-adjusted basis.
- Equal weighting works better than the value weight index, but the effect is marginal.
Another alternative is to use fundamental or even technical factors to choose the stocks.
- This is factor investing or smart beta, which we will cover in a separate article.
Fundamental indexing began more than a decade ago in the US, but there aren’t many of these funds in the UK at present.
- US funds weight on book value, total sales, cash flow and dividends, but they are much more expensive than standard index-tracking ETFs.
Fat tails and diversification
An alternative explanation for active fund underperformance is the idea that the returns on stocks are highly varied.
- An index made up of several hundred stocks will include a small minority that are doing much better than the rest. ((The recent performance of the “Nifty Nine” in the US is a good example ))
- Any active portfolio which doesn’t include enough of these super-stocks will underperform the index.
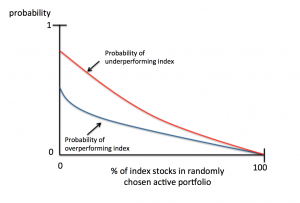
A small, concentrated “conviction” portfolio will have the best chance of beating the index but also the greatest chance of underperforming (if randomly selected – we all hope than a great asset manager can overcome this disadvantage).
An article on Bloomberg illustrates the idea. They used an index made up of just five stocks. Four will return 10% and one will return 50%.
- If they make up portfolios of one or two stocks, equally weighted, only 5 of the 15 possible portfolios will include the 50% stock and outperform.
- Ignoring fund costs, the average active return will be the same as the index (18%) but two-thirds of the active portfolios will under-perform.
The flip side of this is that if you can identify the best active managers, they have a good chance of out-performing.
It also means that a private investor can out-perform, if he can identify a few of the big winners.
William Bernstein also believes that diversification / market performance through a small portfolio – 15 to 20 stocks – is a myth. He refers to a paper by Malkiel which states:
- the volatility of individual stocks rose in the decades before 2000
- the correlation among stocks fell
- The effects of 1 and 2 cancel each other out, so the volatility of the market was unchanged
- But this means that the number of stocks needed to eliminate non-systematic risk had risen to perhaps 30
Bernstein thinks all this is misleading. The key risk is not volatility but “Terminal Wealth Dispersion” (TWD) – lots of 30-stock portfolios will still produce poor returns.
- Bernstein quotes Ed O’Neal’s finding that TWD reduces with the square root of the number of stocks – so 4 stocks are half as risky as one.
- This means a 30 stock portfolio would have 18% of the TWD risk of one stock. Not too bad from my perspective.
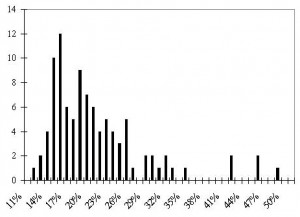
Bernstein looked at the S&P 500 as at December 1999 and formed 98 random equally weighted 15 stock portfolios, hypothetically held for the previous 10 years.
- The “market return” (all 500 stocks held in equal proportion) was 24.15%
- This is higher than the 18.94% return of the actual S&P for two reasons:
- the S&P is cap-weighted, not equal-weighted
- many of the stocks in the S&P in 1999 were not in the index at the beginning of the 10-year period
- the recently added stocks obviously had much higher returns than the companies they replaced, upwardly biasing returns
- Three quarters of the portfolios didn’t beat the market
- The scatter of returns was quite high, with more than a few portfolios underperforming by 5%-10% pa
The reason was that a disproportionate amount of the returns came from a few “superstocks” (eg Dell)
- Portfolios without these stocks lagged the market.
Bernstein concluded that not even 100 stocks could eliminate TWD risk. The only way to minimize the risks was to own the whole market.
The Capitalism Distribution
An article on ValueWalk takes this idea of a few big winners a bit further, and suggests that there is a Capitalism Distribution for life-time returns on stocks.
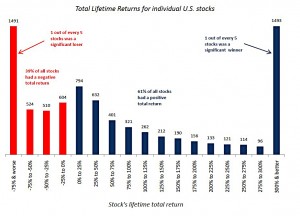
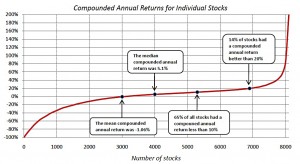
They looked at all the stocks that traded on the NYSE, AMEX, and NASDAQ 1983, including delisted stocks. They used a filter to refine this universe to the 8,054 stocks that would have qualified for the Russell 3000 at some point in their lifetime.
On a total return basis (dividends reinvested), this produced a non-normal distribution with very fat tails:
- 39% of stocks had a negative lifetime total return
- 18.5% of stocks lost at least 75% of their value
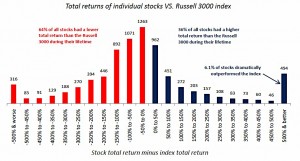
The second chart shows the compounded annual return relative to the index.
- 64% of stocks under-performed the Russell 3000 index
- 494 (6.1% of all) stocks outperformed by at least 500%
- 316 (3.9% of all) stocks lagged by at least 500%
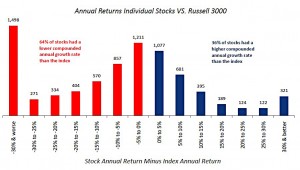
The third chart shows annual returns against the index:
- 1,498 (18.6% of all) stocks dramatically under-performed the Russell 3000 during their lifetime.
The fourth chart shows the cumulative distribution of the stock returns.
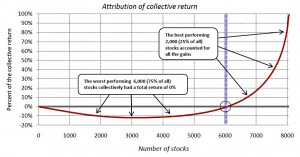
The last chart shows the contribution of the stocks (in profitability order) to the overall returns.
- Avoiding the best 25% of stocks would have led to zero returns.
Once again, it seems that the majority of returns come from a minority of stocks.
Conclusions
- on average passive funds beat active funds, because their costs are lower
- passive funds don’t need watching
- lots of “active” funds are closet trackers, and not worth their high fees – avoid these
- there are lots of ways to beat the market average – these are time-consuming, but if you have the time, they are worth using
- buying large-cap index funds is not really a passive (market-neutral) strategy, it’s more like a large-cap growth and momentum strategy
- the UK indices are particularly poor ones to follow
- the FTSE-100 is dominated by energy and resources stocks, plus financials, and widening your scope to the FTSE-All Share makes little difference in a market-cap weighted fund
- AIM is riddled with terrible companies, and the AIM index routinely loses money
- less liquid, poorly governed and badly covered markets are better accessed by active funds
- market-cap weighting is the worst form of indexing – equal weighting or low volatility weighting would be better
- stock returns are highly concentrated, which means that active managers – and private investors – can outperform if they include the winners in their portfolios
- as so often in investing, choosing this path will not only maximize your chance of getting rich but also maximize your chance of getting poor
I plan to keep using a mix of passive and active strategies.
Until next time.

