Portfolio Optimisation – ReSolve Framework

Today’s post looks at a paper from ReSolve Asset management which offers a framework for Portfolio Optimisation.
Contents
Handcrafting
A few weeks ago, I put together “The Perfect Portfolio” using the handcrafting technique from Rob Carver’s book Smart Portfolios.
- This is an improved version of the technique that I’ve been using to put together portfolios for the past thirty-five years.
Rob’s biggest improvements are in the treatment of alternative assets, and in providing a convincing mathematical background to underpin the choices within the framework.
As a result of that exercise, I have once again become interested in alternative approaches to portfolio construction.
- And additionally into ways to add useful active / factor overlays on top of the core passive portfolio. (( Note that in practice these will implemented through a seperate satellite portfolio rather than as overlays to the core ))
ReSolve
![]()
ReSolve are a Canadian asset management firm, who produce regular white papers on investment topics of interest.
Here’s a chart of their basic offer:
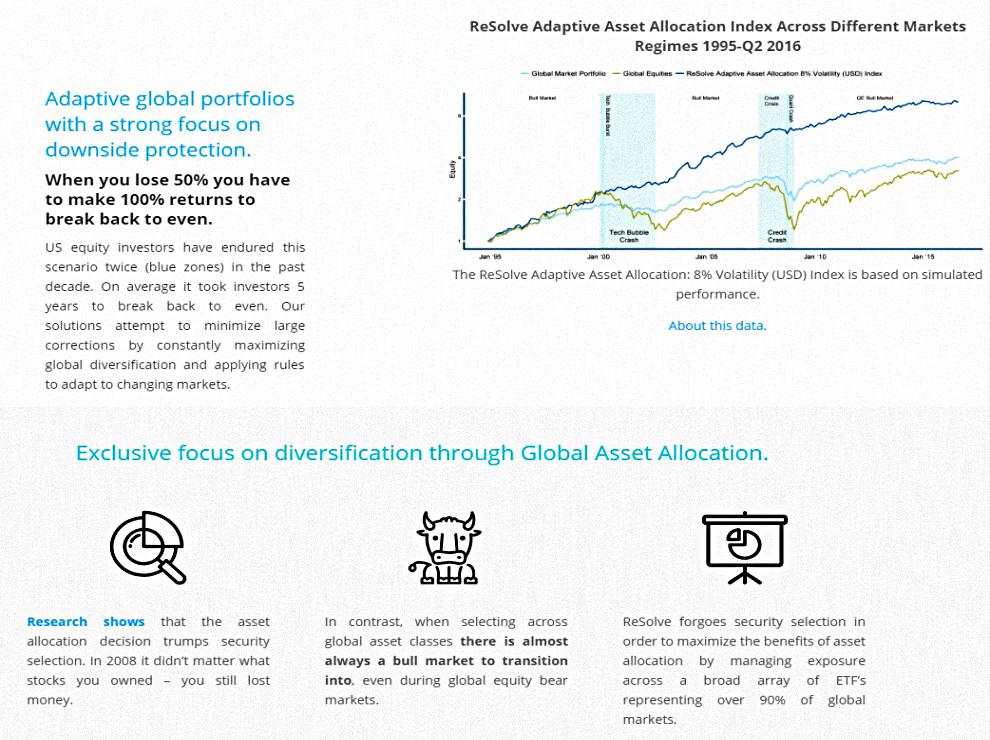
Today we’ll be looking at their paper on a Portfolio Optimisation Framework.
Portfolio Optimisation
It is widely accepted among investment professionals that, while portfolio optimization has compelling theoretical merit, it is not useful in practice.
Practitioners are concerned that optimization is an “error maximizing” process fraught with insurmountable estimation issues.
Optimisation is very dependent on the inputs – small input errors lead to large output errors – and can result in very odd weightings.
- It also often produces inferior results (in return terms) than simple equal-weighting (and indeed, than hand-crafting).
Why this should happen is not clear:
- input errors amongst assets with similar returns and risk will lead to very wrong allocations, but should not seriously impact portfolio returns, whilst
- errors amongst dissimilar assets should not greatly impact allocations (and therefore not greatly impact portfolio returns).
Constraints
Rob’s version of hand-crafting leads to the Max SR portfolio, which has relatively low (though not very volatile) returns.
- Getting from there to the max geometric return portfolio that is of more interest to many investors (including me) involves imposing constraints such as a maximum allocation to bonds.
Perhaps similar constraints can fix the shortcomings of the formal optimisation approach?
ReSolve think so:
Chopra and Ziemba (1993) found that historical data was quite useful in estimating volatilities and covariances.
The performance shortfall from using mean-variance optimization was almost entirely due to errors in estimates of the mean.
Portfolio optimization with constrained means, such as Minimum Variance, would solve this issue quite effectively.
Alternatives
There are four main alternatives to mean-variance optimisation:
- conviction weights, based on the manager’s assessment of an asset’s prospects
- market cap weighting
- equal weighting
- hand-crafting (not mentioned in the ReSolve paper).
What is rarely discussed among practitioners is that each of these heuristic portfolio choices implies strong views about the nature of the investments
Most investors are seeking to achieve the highest returns subject to a maximum risk threshold, so portfolios constructed using the above heuristics express strong views about market inefficiency.
Managers who form portfolios on capitalization weights are expressing the view that the investments should produce returns that are a linear function of their beta to the portfolio.
That this isn’t the case in practice is one of the key criticisms of CAPM, remember.
Equal weight portfolios express a view that market returns are entirely random. This is only optimal when expected returns have no relationship with risks.
Again, this is unlikely.
ReSolve’s position is that for each of these alternatives, there is a better “advanced” portfolio optimisation technique.
Remember, they don’t look at hand-crafting.
- Hand-crafting is a version of equal-weighting, but based on Sharpe ratios (so it takes risk and volatility into account).
Since it involves estimates of correlation (and indeed, volatilities and returns via the assumption of a flat SR across all assets) ReSolve would classify hand-crafting as an optimisation method, albeit one that is done by hand.
- For ReSolve, truly “naive” methods don’t require any information about volatilities, correlations or returns.
The Optimisation Machine
In the next section, ReSolve make the case for optimisation:
Investors prefer to own the portfolio that maximizes their expected return subject to a maximum tolerable portfolio volatility. Many investors care less about volatility than risks like “permanent loss of capital”, “maximum drawdown”, or “expected shortfall”.
A large expected mean relative to volatility strongly implies a smaller risk of permanent loss, a smaller expected maximum drawdown, and a smaller expected shortfall.
Certain strategies, especially those that are definitionally “short volatility” like high-yield credit, option selling, and merger arbitrage exhibit highly asymmetric return distributions with extreme negative skew. These are well-known exceptions to the rule.
Optimization under mean-variance utility requires that the returns to investments be reasonably well described by the first two moments (i.e. mean and variance) of their return distributions. We can reasonably claim this is true for diversified portfolios of stocks, bonds, commodities, and currencies.
ReSolve assume that investors have no problems with leverage, which allows them to conflate the max SR portfolio with the max return portfolio.
- I think that most investors would prefer not to leverage up the low-return max-SR portfolio, and so I’m sticking with allocation constraints (a bond ceiling).
They do however stick to long-only portfolios (no shorting).
Here’s their diagram of “The Optimisation Machine”, which at first glance doesn’t help me much.
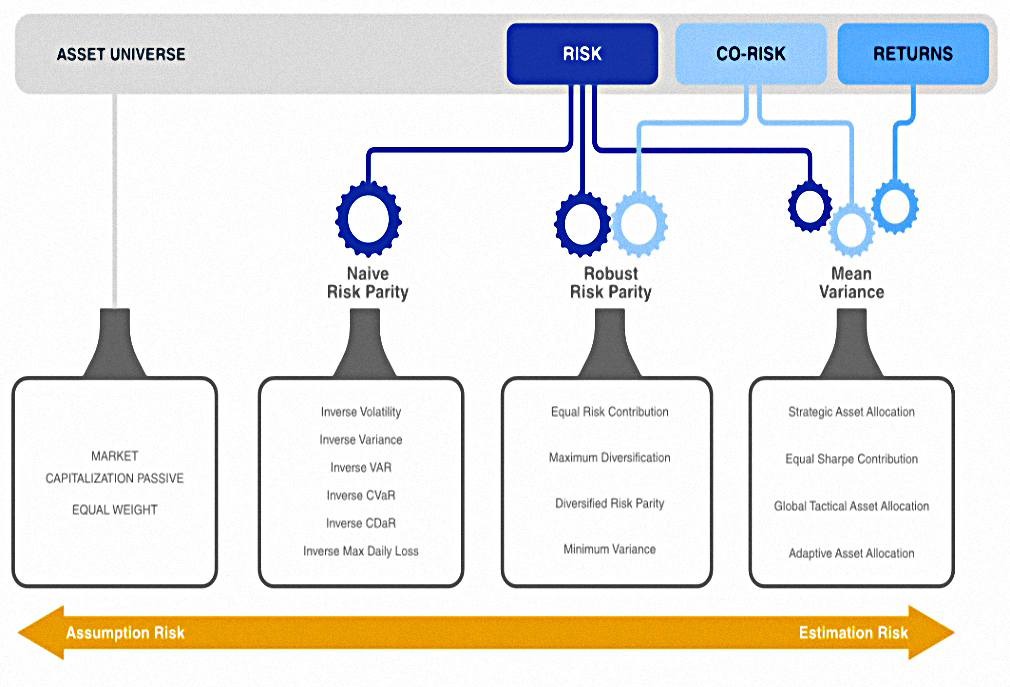
The three inputs are risk (volatility), co-risk (correlations of returns) and returns.
- Alternative definitions of the three dimensions are fine.
So far, so good.
Which process you should use is then down to which (if any) of the three inputs you have “active views” about.
The next chart shows the decision tree that you should follow:
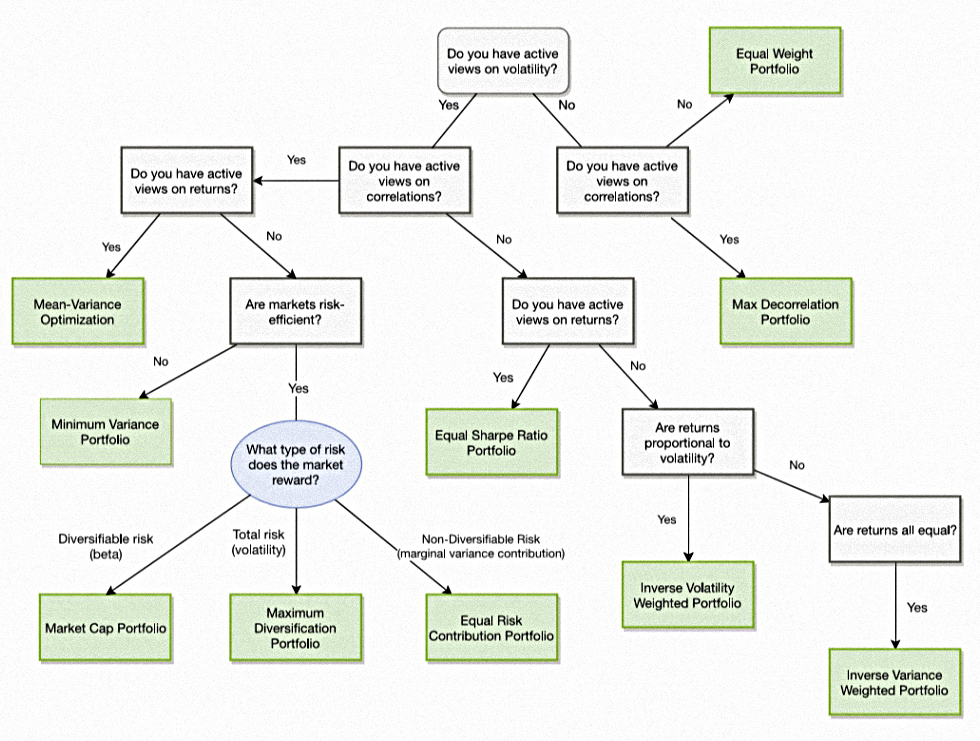
ReSolve also provide a taxonomy of optimisation methods and their characteristics:

I would view hand-crafting as a maximum diversification strategy, but one which avoids the negative characteristics that ReSolve report:
- Concentration is easy to avoid, simply by further subdividing your assets, and applying constraints such that many assets much be used (alongside the constraints used to boost returns).
- Normally the size of the portfolio (and therefore your trade size) will determine the level at which you stop subdividing.
- Sensitivity to correlations and volatilities can be avoided by using long-term historical averages for these values, rather than regularly re-calculating them from recent data.
Risk-Based optimisation
The next section of the report runs through the various risk-optimisation methods (with a bit of maths):
- minimum variance
- maximum diversification (Max SR)
- maximum decorrelation
- risk parity
- inverse volatility
- inverse variance
- equal risk contribution
Risk and return in stocks
CAPM mistakely predicts that returns should increase with beta (volatility relative to the market).
- Thus beta-adjusted returns should be flat across beta deciles.
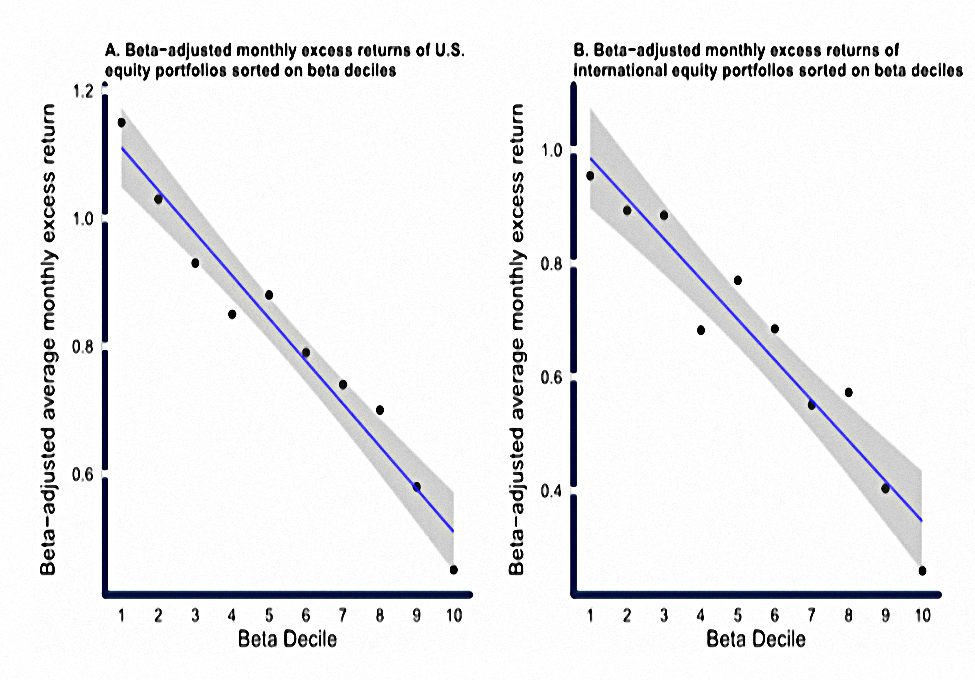
The charts above show that in fact, low beta produces better (ReSolve calls them “more efficient”) returns, for both US and international stocks.
An investor can borrow money to lever a portfolio with a β of 0.5 to achieve a β of 1, and earn a higher return than an investor who invests in a portfolio with a natural ß of 1.
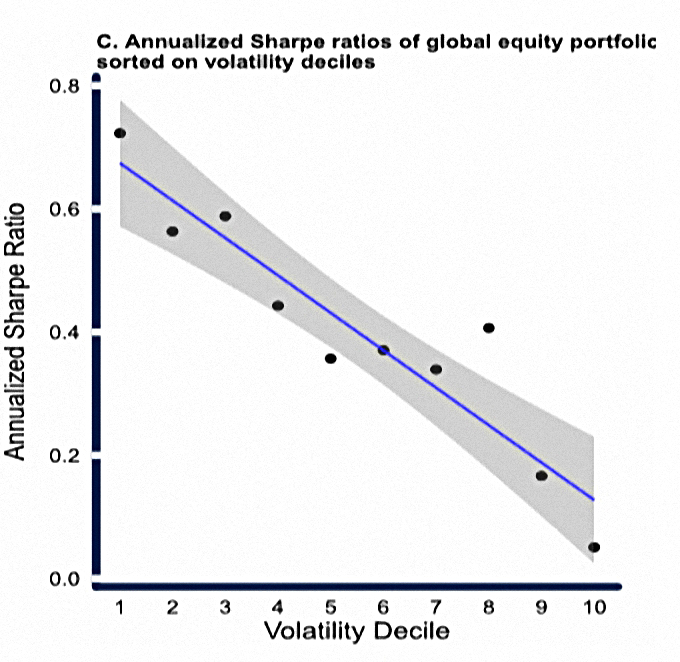
This chart shows that low-vol stocks have higher Sharpe ratios – they produce more return per unit risk (volatility).
- This is the Low Vol effect (also known as “betting against beta”).
DiBartolomeo (2007) makes the case that the low volatility effect is fully explained by misspecification of the CAPM as a single period model.
In a multi-period context, after adjusting for the combined impact of algebraic differences between arithmetic and geometric measures of return, plus skew, kurtosis, borrowing and transaction costs, stock returns are probably independent of risk.
ReSolve promise to test this theory in a future paper.
Asset returns under economic regimes
The long-term average pairwise correlations between stocks, bonds, and commodities are almost exactly zero since 1970.
At the asset class level, the role of diversification is to ensure the portfolio is positioned to deliver on its objectives in any macroeconomic environment.
Specifically, we are interested in how assets respond to changes in expectations about inflation and growth.
There are charts for the period between 1970 and 2014.
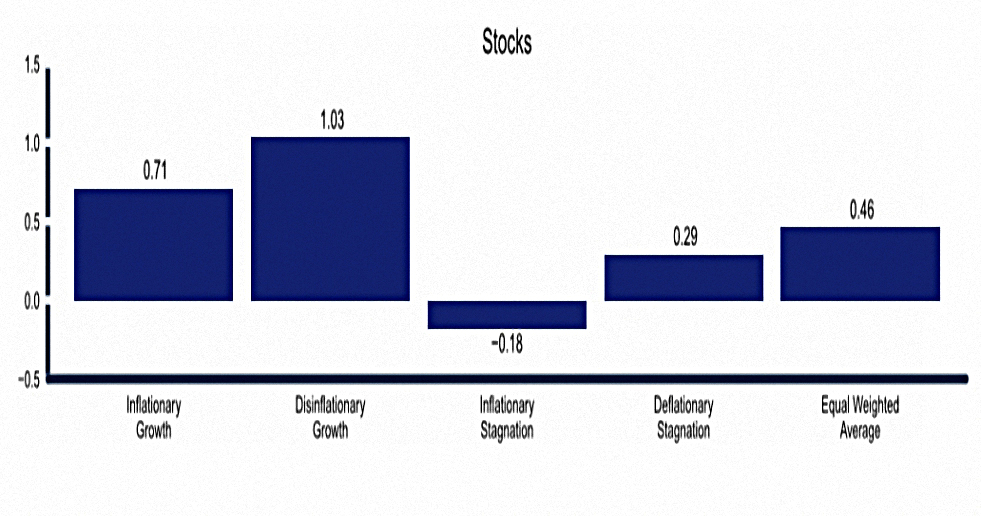
Stocks do well under growth.
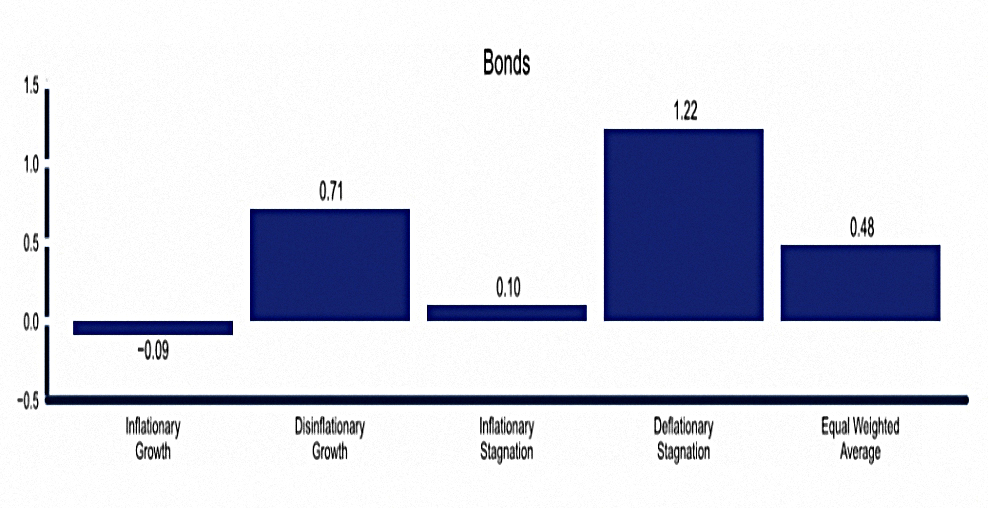
Bonds do well when inflation is low.
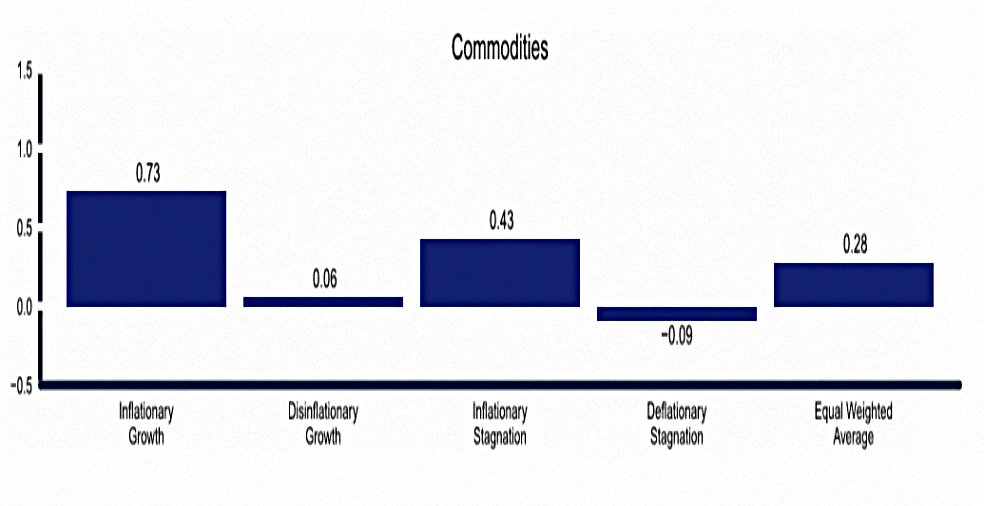
Commodities do well when there is inflation, and slightly better when there is growth.
Conclusions
This wasn’t quite the paper that I was expecting.
It was semi-interesting to place the hand-crafting method in the context of the universe of optimisation strategies.
- And for those who need to chose between optimisation strategies, the taxonomy and decision tree will be useful.
But I’m sticking with hand-crafting because:
- It’s a straightforward process that can be easily applied to portfolios of all sizes.
- It produces intuitive results rather than extreme weightings.
- It provides a simple method for moving from the max SR to the max return portfolio (which doesn’t involve leverage).
- It’s simple to adjust the allocation to take account of non-listed assets (property, DB pensions, cash etc).
The charts on asset classes under different growth and inflation regimes might prove useful in my active strategies portfolio.
I also look forward to the promised follow-up paper from ReSolve, in which the various possible relationships between risk and return will be explored through simulations.
Until next time.
Mike Rawson
Mike is the owner of 7 Circles, and a private investor living in London. He has been managing his own money for 40 years, with some success.