Benchmark for Annual Portfolio Review

Today is the first day of the new year. This means that I have to start the annual review of my portfolio’s performance. Before I do that, I need to work out which benchmark I will be comparing it to.
In previous years this hasn’t mattered too much, but now that I am going public with the results, I need to make the yardstick more relevant to the 7C investors.
Which Assets?
At the same time, I want to keep things as simple as possible, so for now I will use as few assets as I can: ((I will revisit the benchmark next year, when we have reviewed all the potential asset classes that might be useful to the 7C investors))
- UK stocks
- International stocks
- UK residential property
- Cash
I won’t use bonds because I don’t really hold any in the current investment climate, and because we can approximate their effect on the portfolio by holding more cash.
Asset Allocation
I’m going to calculate the residential property share from the average 7C target portfolio.
![]()
For those wanting to retire on £25K pa, the UK average property price of £272K works out at 30% of the total net worth required. For those wanting to retire on £42K pa, it comes to 20%. For the benchmark, I will split the difference and say 25% property. This will be somewhat light for me personally, as I live in London.
Cash will be 10%, which is more than I would hold normally, but reflects current uncertainties and the lack of any bonds in the benchmark. This is again a little light for me, as I’m building my 25% SIPP cash pot ready for withdrawal when I hit 55 next year. I’ll look at the effects of these weighting variations in my annual portfolio review.
I’ll split the rest between UK and World ex-UK stocks.
So we have:
- 32.5% UK stocks
- 32.5% World ex-UK stocks
- 25% UK residential property
- 10% cash
This is not a benchmark that many funds will be using, but it will serve our ends.
Individual benchmarks
We need to find total return (dividends reinvested) indexes for the stocks part of the benchmark. This is actually quite straightforward, as the FTSE website provides the relevant data for a wide range of indices. The results for 2014 are as follows:
- FTSE All-share, capital only = -2.21%
- FTSE All-share, total return = 1.11%
- All World ex-UK, capital only = 4.02%
- All World ex-UK, total return = 6.60%
For UK property, we have a variety of indexes, mostly produced by mortgage lenders but I prefer the official Land Registry data. It’s a lagging indicator, but it uses real sales prices rather than mortgage values, and it includes all completed transaction (and only these, rather than those which fall through).
The data is published a month in arrears, so we are actually looking at data from Dec 2013 through Nov 2014, but this lag applies to both the benchmark and the portfolio, so it will serve our purpose.
- England & Wales residential property price growth = 6.20%
For cash we need an upper quartile Cash ISA rate, going back 12 months. A useful source here is the Nationwide Champion ISA rate history page. This product offers a rate slightly higher than the average of the best five Cash ISAs, and the rate history page goes back 12 months:
- 12-month average ISA rate = 1.21%
The composite benchmark
To calculate the composite benchmark, we simply mix the four rates of return in the proportions we decided above:
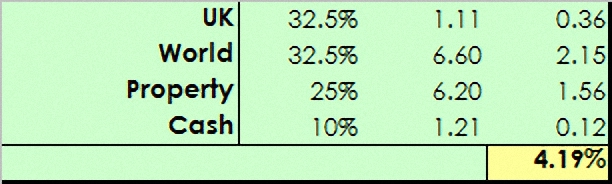
So our benchmark return for 2014 is 4.19%. Given the attention-grabbing struggles of the FTSE-100 and the current global economic conditions, that feels like a reasonable result.
In our next post, we will see whether I managed to reach this target, or even exceed it.
Mike Rawson
Mike is the owner of 7 Circles, and a private investor living in London. He has been managing his own money for 40 years, with some success.


Quick question. Should you make your benchmark weightings equal your target asset allocation weightings? Thanks again.
Hi Matthew,
I’m confused – I do use my target weightings. Do you mean that I should use my actual weightings (eg. I am overweight in property at the moment)?
Mike
Apologies, I didn’t realise that. Makes sense now that I say it out loud. Many thanks.