Globalisation and inequality – who gets what – part 2
Today’s post is once again about who gets what and why. This time we’re going to look at the topic from two different angles – globalisation and inequality, and the looming impact of technology.
Contents
Who gets what?
Last time out we looked at market design, as a solution to who gets what.
Today we’ll approach the subject from two other perspectives:
- globalisation, and people’s growing opposition to it despite the benefits it has delivered
- inequality, and how much of it people are prepared to tolerate
We’ll also touch on the similarities between the looming technological revolution and the consequences of globalisation which are now being resisted by those most affected.
Globalisation
We’ll start with globalisation. My jumping-off point here is a recent paper by the World Economic Forum, which I came across on Medium.
The paper ((Part of an interesting series on globalisation )) is called “There’s Never Been a Better Time to Be Alive“, and the title is justified by recent global progress along three dimensions:
- life expectancy, which has risen more in the past 50 years ((My lifetime, more or less )) than in the previous 1,000
- extreme poverty, which in 25 years has shrunk from affecting 40% of the world population to “only” one-eighth
- illiteracy, which has fallen from 50% to one-sixth in the same period
The end of the Cold War, China’s embrace of (a form of) capitalism, and the internet ((Not to mention global threats like climate change, and future energy and water shortages )) means that people are also more connected than ever.
The Backlash
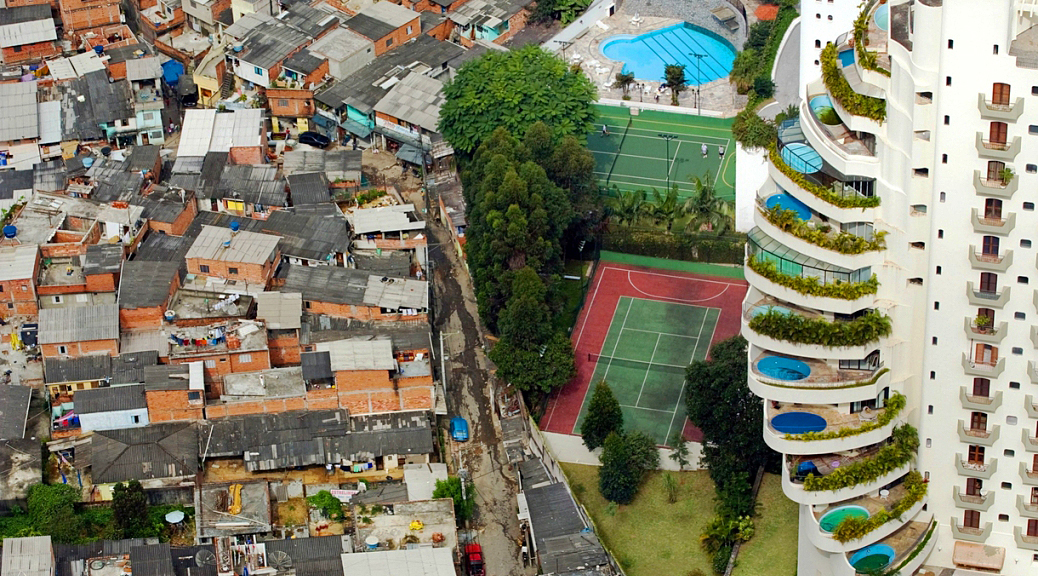
But within previously rich countries, the middle class and poor haven’t done so well.
- Sure, increasing trade with developing countries and cheap labour means that lots of goods and services are cheaper than ever.
- But globalisation has put pressure on first-world jobs, which have been increasingly automated, shipped abroad or taken by immigrants.
- Real wages have been stagnant for 25 years and social mobility has been reduced.
- The “trickle down” never happened.
And so now we have the rise of populist, nativist movements – on both the political left and right – throughout the rich world, hoping to put some of those old barriers back in place.
Unequality
Our second perspective for looking at who gets what and why is a paper with that same subtitle by Michael Norton.
The paper’s actual title is Unequality, which is Norton’s name for the type of inequality that most people in the West ((Norton’s paper focuses on the US, but I’m going to assume it’s a decent fit for the UK also )) are prepared to tolerate – that is, inequality of outcomes.
- All kinds of people – left- and right-wing, poor and rich – support inequality.
- The question is how much unequality?
Inequality and incentives
Economic inequality is one of the major incentives towards work and productivity in capitalism.
- Everyone receiving the same outcome would likely impact people’s willingness to work hard to improve their situation.
- Yet it’s also likely that too much inequality – being “locked out” from sharing in the success of wider society – would have the same effect.
As well as work behaviour, levels of inequality can be expected to impact voter acceptance of the policies around inequality – taxation, welfare, and spending on things like education and healthcare.
- There is also evidence that ethical behaviour will deteriorate as unequality increases.
As we’ve already noted, inequality in the west – as measured by incomes and net worth – has been rising for several decades.
- Despite this there’s been little work on what the optimum level of inequality should be.
The desert island game
Norton’s research uses a game where volunteers get to play dictator on a desert island.
- He asks people to describe by quintile how US wealth is distributed.
- Then he asks them to say how they would allocate wealth on their island.
On average people think that the richest 20% own 60%, but should own 30%.
- People think that the poorest 20% own 4%, but should own 10%.
The real answers show a much more skewed distribution: the top 20% own 85% of wealth and the bottom 20% own only 0.1% of wealth.
Wealth vs income
Of course, using wealth rather than income means that you are almost certain to get a result like this.
- Even if incomes were flattened completely, some people would spend every penny they received, and end up with no wealth at the end of the year.
- Others would save and accumulate.
- There’s no unfairness in this unequality.
It’s also worth pointing out that the public’s ideal wealth distribution is flawed and has serious consequences.
The distribution itself shows real anchoring problems to the 20% bands used to allocate the wealth.
- The top 20% are given 30% of the wealth (1.5 times the average).
- The bottom 20% are given 10% of the wealth (0.5 times the average).
And in the UK at least, a further complication is the economic dominance of London – not just of the UK, but of Europe – and the consequent wide variation in land values across the country.
- A house in the London street I live in costs twenty times the price of the house I grew up in (in Manchester), despite being only slightly larger.
Official statistics in the UK usually divide wealth by households, but I found some figures from 2014 showing wealth per head of £147K.
- The public’s ideal distribution would mean that those in the poorest 20% would each have £73K, while those in the top 20% would be worth £220K.
A world like this is hard to imagine, and to say that the social upheaval required to achieve it would be counter-productive is a massive understatement.
- Trying to equalise wealth is a fool’s errand, but we can certainly do more about incomes.
The CEO game and executive pay
Executive pay is one of the major public symbols of unequality.
The second game that Norton and his fellow researchers use involves people guessing the pay of CEOs and unskilled workers, then saying what they would like them to be.
- Americans guessed the ratio to be 30:1, and would like it to be 7:1.
- In fact, the ratio of CEO pay to unskilled labour pay has now reached 354:1 in the US.
One factor not reported by Norton is whether these figures are post-tax or pre-tax (more on this below).
The problem with using executive pay as a proxy for inequality is that there are so few executives.
- In practice, a person’s experience of inequality relates more to the Jones’ down the street than to a billionaire living on a private island.
- The recent focus on the “1%” versus the “99%” is not only inaccurate (it’s more like the 0.1% vs the 99.9%) but also runs the risk of ignoring the practical aspects of income redistribution.
- The income ratio between the 20th percentile and the 80th percentile is a much more realistic way to look at unequality.
That said, getting from 354:1 down to 7:1 on pay is at least conceivable (though it is not the case in any developed economy), whereas the idealised net worth targets are impossible to imagine.
- For the UK, with the minimum wage set to be £15K pa by 2020, this would set a pay ceiling of £105K pa.
- If we make the further assumption that the 7:1 ratio is post-tax, then the pre-tax pay ceiling might rise towards £200K, which is almost realistic.
Asymmetry of productivity
It’s well-known from behavioural psychology that losses hurt more than gains (loss aversion).
- The same appears to be true for wages and productivity.
Norton reports several findings in this area:
- when pay inequality is made public, lower paid workers become less satisfied but higher paid workers are not more satisfied
- when one of a pair of workers gets a pay cut, he works less, but the higher paid worker doesn’t work more
- CEOs often “choke” under the pressure from their pay packets and potential bonuses
Decision making
There’s also research to show that poor people make worse financial decisions partly because of the scarcity they face, rather than them just being “bad with money”.
- Poor people take too many risks (they borrow more, save less and actually gamble) in order to get out from the bottom.
- Norton calls this “last-place aversion”.
It’s also the case that the very rich take too many risks (the “house money” effect).
- So a more unequal distribution leads to more risky behaviour in society.
Ethical behaviour
Poor people give more to charity than the middle classes (the very rich give more as well).
- On the other hand, those paid less to complete experiments are more likely to cheat in order to earn the same as others.
- Those paid more often cheat in reverse, to restore equity.
Research also shows that richer people have less empathy for others.
- This is partly because people who have done well want to take the credit for it, and that means “blaming” those who have not done well.
- It’s also down to last-place aversion – the middle classes need to have someone beneath them to feel good.
Real world evidence for this includes people paid just above minimum wage not wanting the rate to increase such that it engulfs them with the “last-place” wage.
Conclusions
- Negative effects of too much inequality include lower productivity, poor decision-making and more unethical behaviour.
- The public supports unequality, but not too much.
- Their aspirations for net worth levelling are unimplementable, and those for income levelling barely practical.
- We could move relatively easily in the direction of income levelling via the tax system.
- This might counteract most of the unwelcome effects of inequality. ((It should be noted that the tax system in the UK is already extremely redistributive, with incomes under £12K pa treated favourably and those over £100K unfavourably – it’s the middle ground that generates most of the heated political debate ))
But what of the root cause we discussed at the top of the page?
- What can be done to make globalisation’s effects acceptable?
Fixes for globalisation’s inequality
The typical solution from those on the left is more bribes to the losers from globalisation:
- free education,
- retraining,
- health-care, and
- higher welfare and state pensions.
At the extremes, new ideas appear, like:
- wage insurance,
- the expansion of wage tax credits, and
- universal basic income.
But what if “the losers” reject this offer (assuming it can be paid for in the first place)?
- What if they don’t want to be better compensated losers?
Effect of technology
Left-wingers also point to the greater support for trade and globalisation amongst younger and non-white voters.
- But what if this youthful idealism disappears in the face of a growing realisation that globalisation won’t supply the good life they feel that they were promised?
- The service jobs they are likely to aspire to can soon be transferred just as easily to other countries – or to machines – as were the manufacturing jobs of their parents.
The lesson from Brexit is that controls on immigration are the least that the disaffected demand.
- But how will these help when automation, robots and AI reproduce the effects of globalisation from within?
I don’t have the answers.
Until next time.
Mike Rawson
Mike is the owner of 7 Circles, and a private investor living in London. He has been managing his own money for 40 years, with some success.