Invest in the Best 3 – Cash, Predictability and Ratios
Today’s post is our third visit to Invest In The Best by Keith Ashworth-Lord.
Cash

![]()
Chapter six of Keith’s book is about how earnings per share can be manipulated, and how cash flow is more important.
The idea behind using earnings is that they eventually turn into cash (in the hands of the shareholder).
- This leads to a valuation on the basis of the NPV of the expected future cash flows.
The trouble in practice is that earnings do not always produce the cash they are supposed to. Whilst earnings are often a matter of opinion, cash is a matter of fact.
Cash can really only be manipulated via fraud.
The fudging of earnings comes from indirect expenses which are not automatically matched to the revenues from a particular transaction.
- These include central overheads, R&D and depreciation.
Cashflow
The pre-emptive demands on cash flow are:
- Working capital = stocks + debtors - creditors
Essentially this is spending against goods that have yet to be sold, plus credit in both directions.
- This should be a matter of timing, and working capital should convert to cash (though it will, of course, be replaced by working capital fo the following period).
Any write-offs of obsolescent stock – or more favourable credit terms granted to customers – will hit the cash conversion process.
Working capital show grow in line with turnover, but no faster.
- Capex and depreciation
Keith runs through the various methods of working out depreciation.
- Straight-line and reducing balance are the most common.
- Straight-line leads to higher profits in the early years (but has no effect on cash).
If the equipment is sold half-way through its life, an adjustment for profit or loss on the sale will bring the P&L back into line with the cash flow statement.
- Capitalised expenditure
This is the most controversial area.
- Companies capitalise spend on new buildings, on R&D, on drug development and even on writing software.
Until the expected benefits accrue, there is a danger in this.
- It’s much more prudent to write off this spend as it occurs.
- Acquisitions
When a company takes over another, it has a one-off opportunity to adjust the net book value of the acquired assets.
- Assets may be written down (reducing future depreciation) and provisions for integration costs and bad debts made.
This “kitchen-sinking” can boost profits in later years.
The excess paid over the acquired company’s book value is goodwill.
- This has had every treatment possible: first, it was written off, then it was amortised, now it remains on the balance sheet as an intangible asset until “impaired” (when it is written down).
The most recent change happened in the mid-2000s, so the impact of amortised goodwill (ie. writing off an “asset” that does not need to be replaced) is largely over.
- Interest and taxes
Like working capital, there will be differences in timing here.
- Keith also highlights loan arrangement fees and DB pension deficits (cash contributions vs imputed charges) as sources of mismatches.
EBITDA
Keith is not a fan:
Interest and taxes have to be paid if the company owing them is not to be foreclosed upon and depreciation is a true economic cost to the business - a replacement provision for worn-out productive assets. My preference is to use free cash flow.
free cash flow = operational cash flow ± interest received or paid - cash taxes - net capex
The natural profit and loss measure to compare this with is earnings attributable to shareholders, i.e. profit after tax, minorities and preference dividend payments.
For companies like pub chains and equipment hire, some capex will be expansionary rather than maintenance.
Then the depreciation charge is probably a better approximation of the maintenance capex requirement of the business. In this case, the cash flow metric is better described as cash earnings to make the distinction between it and free cash flow.
Finelist
Keith uses Finelist as an example of a company that appeared to be making profits but still went bust.
- It was a vehicle parts firm that grew through acquisition.
Headline turnover growth had been phenomenal, averaging 89% compound per annum between 1993 and 1998. Finelist had also turned in compound annual EPS growth of 61%.
However, operational cash flow had fallen materially short of operating profits in five of those six years. Against aggregate reported earnings of £45.4m, Finelist generated only £12.3m of free cash, barely enough to cover £11.8m of equity dividends.
Acquisition financing came from either raising fresh equity or borrowing from the bank.
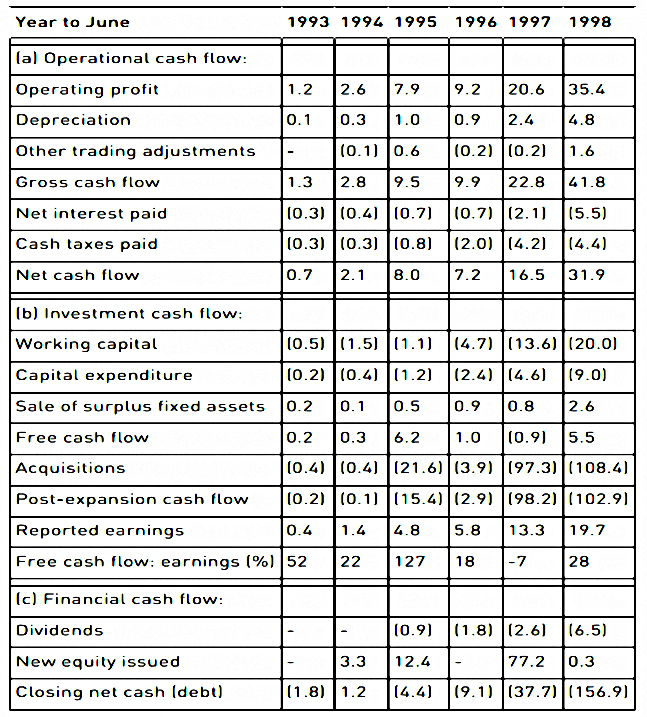
In 1997 over £9.8m of fair value adjustments were made, reducing the carrying value of the assets acquired by almost 30%.
A higher working capital requirement was the main reason for Finelist’s poor operational cash flow. The increase in working capital during 1998 was 161% compared to turnover growth of 70%.
Finelist went from net cash of £1.2m as at end June 1994 to net borrowings of £156.9m as at end June 1998, representing gearing of 228%. Net working capital to sales had been consistently escalating as the stock turn fell, despite Finelist appearing to take longer credit from suppliers.
ROCE fell from 45.4% in 1994 to 12% in 1998, whilst the more important ROE measure fell from 30.4% to 10.4%.
Earnings in 1998 were £19.7m, an excess of £18.3m over 1994. This excess represents a return of only 7.6% on the £240.3m of incremental equity raised or retained during this time.
Predictability
Buy only when there is an appropriate margin of safety between the price you pay and the value you believe you are getting. Try not to make calls that are anything other than blindingly obvious.
Beyond this golden rule, Keith prioritises predictable earnings and businesses.
- Unfortunately, the company he chooses to illustrate this approach is Dignity (DTY), the funeral provider.
Keith points out the favourable demographics (population growth and an ageing population, though deaths actually fell to 2014) and the scale economies of DTY.
- He also notes a trend to cremation over burial.
DTY’s share price fell off a cliff in 2017, a few years after Keith’s analysis. (( Full disclosure – I had shares in DTY too, and I can’t remember when I sold them ))
- The price fell by 70%, including 50% in a day.
DTY was forced to cut prices in order to retain market share as funerals became significantly more price competitive.
Keith’s other examples are NCC (share price crash in 2016) RWS (no crash – I hold) and Unilever (no crash – I hold).
- So maybe things aren’t quite as predictable as we would hope.
Ratios
Chapter eight of the book is about ratio analysis.
- He uses AIM flooring company James Halstead (disclosure – I hold) in his analyses.
Keith’s analysis focuses on four elements:
- Sales
- Earnings
- Assets
- Cash
Sales
For sales, the key ratio is sales per share.
- Keith looks for 5% compound annual growth over five years.
- Growth should be accelerating, or at least constant.
In the table below, Keith uses the following definitions:
net working capital (NWC) = stocks + trade debtors - trade creditors gross equity = shareholders' funds + goodwill written-off or amortised - revaluations
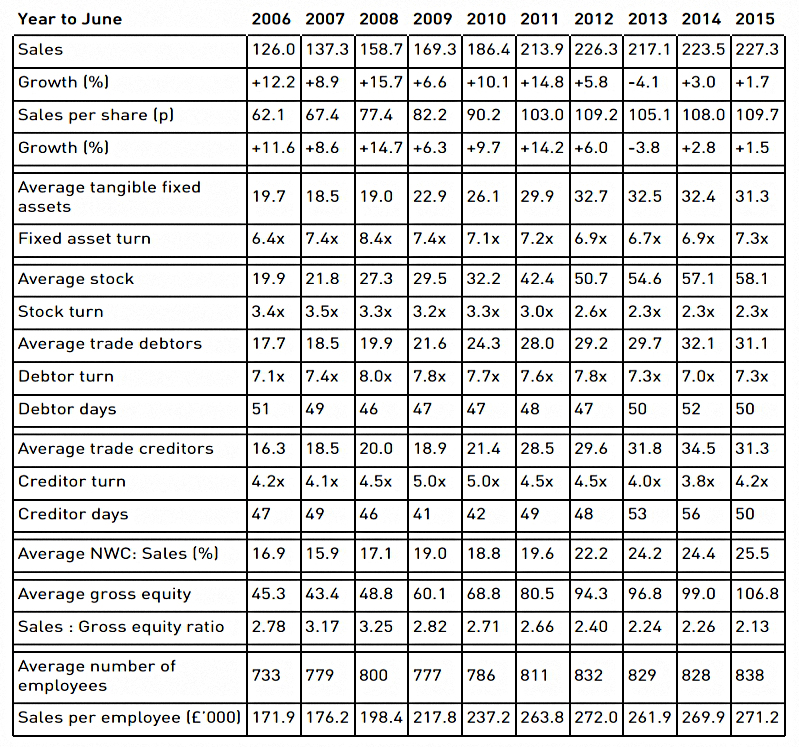
For the five years to 2015, sales growth was 4% pa.
- Over 10 years growth was 7.3% pa.
The corresponding sales per share figures are 3.7% and 6.9% pa.
Tangible fixed asset turn has been range-bound at 6.4 to 7.4, but the need for a higher level of working capital is evident. Stock turn has fallen from 3.3 to 2.3.
Debt collection has remained stable, but creditor days have lengthened a little. et working capital to sales has gone up from 16.9% to 25.5% over ten years.
Sales generated per £1 of equity have fallen from 278p to 213p over this period.
Sales per employee are up from £171K to £271K.
Earnings
When analysing the past record of earnings growth, it is important to ask whether this is stable and consistent, or variable. Has the rate of growth been static, declining or accelerating?
Increasing sales need to be converted to increasing earnings and profits, which means profit margins must not fall.
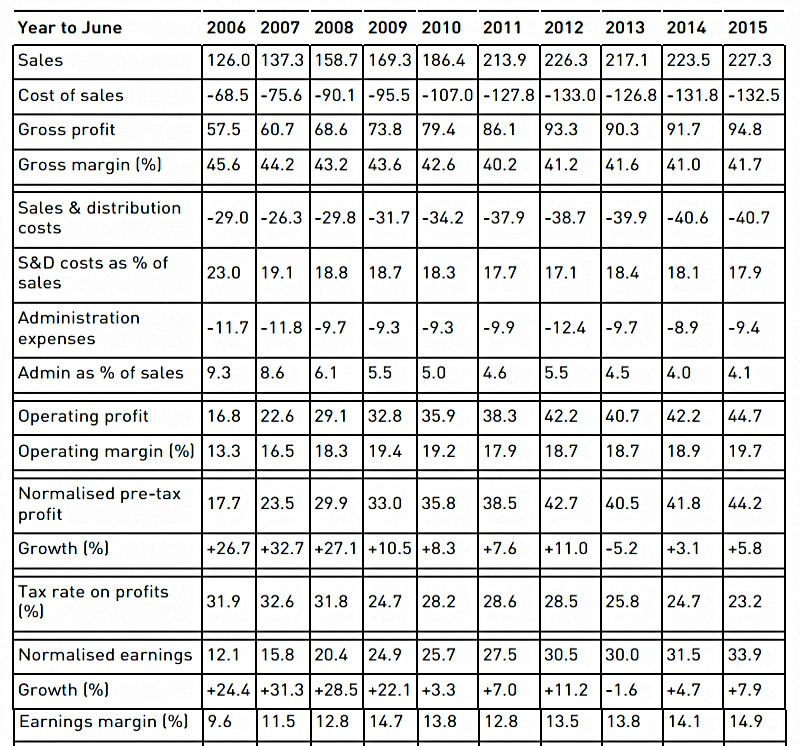
- Gross margins declined from 2006-11, but have since remained stable.
- Operating margins have improved as overheads have been controlled.
- Sales and distribution costs have fallen (relative to turnover) as have admin expenses and staff costs to sales.
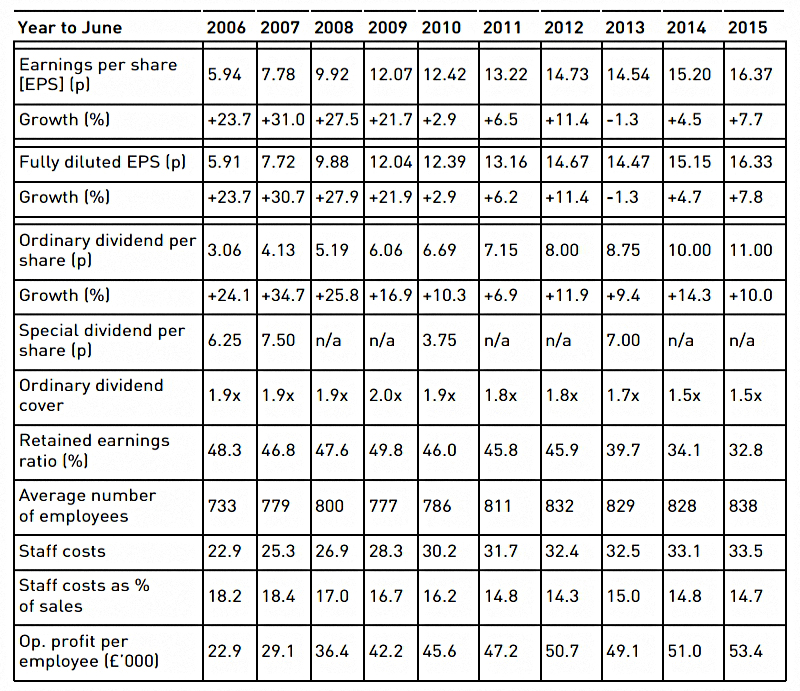
- Profit per head is up from £23K to £53K (due to economies of scale).
- Profit is up from £17M to £45M, at 11.5% pa (though only 4.5% pa over the last five years).
- Profit after tax is up and EPS has grown at 11.9% pa.
Assets
Keith uses the following definitions:
current ratio = current assets ÷ current liabilities

quick ratio = (current assets - stocks) ÷ current liabilities

gearing = net debt ÷ net equity (shareholders' funds)


- Assets have increased at 10.9% pa, or 10.6% pa per share.
- Most of this is tangible fixed assets, with only 3% of net assets made up of goodwill.
- Retained earnings are more than 80% of gross equity, despite £195M of dividends in the period.
- The share premium account is less than 3% of equity.
- There is just £0.2M of debt (irredeemable preference shares).
- The current ratio has improved and the quick ratio is more than 1.
- The big gap between the two reflects the high stock levels of this business.
Next up is the return on average equity.
ROAE = sales-to-equity * earnings margin
The first is down from 2.78 to 2.13 but the second is up from 9.6& to 14.9%.
- ROAE is therefore up from 26.6% to 31.8%.
Special dividends in 2007 and 2008 depleted cash and shareholders’ funds (equity), boosting ROAE.
Keith double-checks that the ROAE is sustainable in two ways:
- he looks at incremental returns to equity
- and he looks at operational return on assets
The sizeable cash balances generate single digit returns and lower the reported ROAE to beneath the operational (cash-adjusted) ROAE. In 2015, the average of opening and closing net cash in the balance sheet was £43.1m, whilst interest receivable was £0.2m, giving a return on cash of just 0.46%.
Net operating assets, defined as fixed assets plus stocks and debtors less creditors (i.e. excluding financial items and provisions), averaged £109.9m in 2015. Operating profit of £44.7m then produces an operational return of 40.7% on these assets.
Cash
Accounting earnings can be `restricted’ in the sense that what comes out in free cash is less than what is reported as earnings because of the demands of working capital and capital expenditure (capex).
We saw the dangers associated with this earlier when we looked at Finelist.
- The best way to guard against this is to compare the growth in free cash flow with that of earnings.
Keith also looks at the make-up of gross cash flow – money from operating profit is good, add-backs like depreciation and amortisation are bad.
After that, he looks at depreciation versus capex spend.
- In a growing business, capex may be higher, but this should not go on forever.
He also looks for capitalised spending (R&D or software) being dripped back via amortisation.
- And he compares the interest paid with the operating cash flow plus interest received (cash interest cover).
Another check is to compare cash tax payments with the tax charge in the interest statement.
- If the former is consistently lower, then the taxman is not seeing all of the reported earnings.
Keith also looks to see that profits are not being absorbed by higher levels of working capital.
- He compares operating profit with gross cashflow + change in working capital (known as operating cash flow).
The final check is whether the sustainable free cash flow would pay in the interest on the debt needed to buy the whole business.
- He calls this the private equity test.
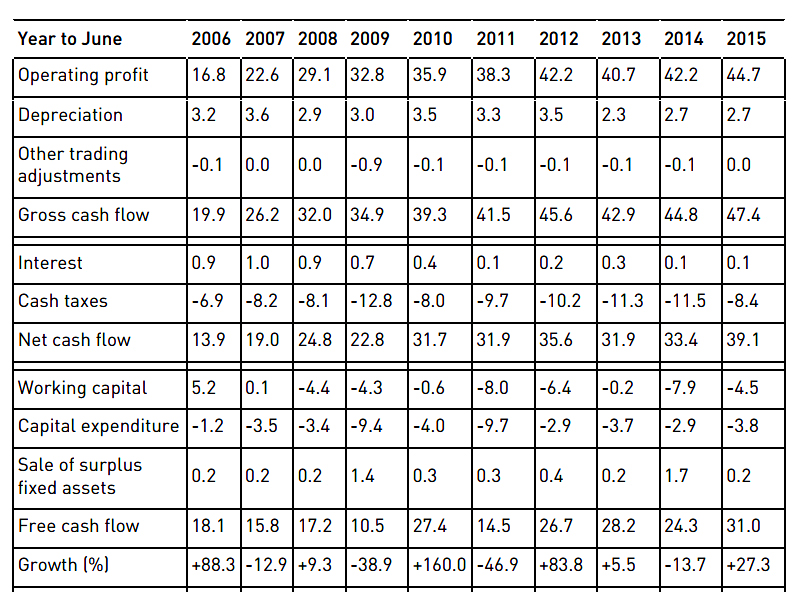
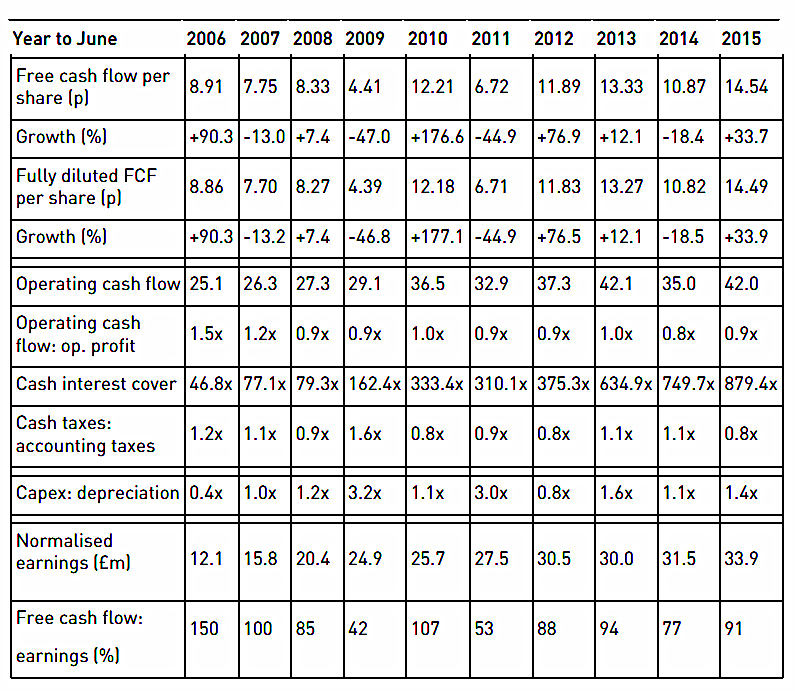
- Halstead is light on tangible assets (turnover of 7.3 times) so depreciation is only 6% of operating profits.
- Over 10 years, depreciation is £14M lower than capex, due to spending on new factories and warehouses.
- Aggregate depreciation is 69% of aggregate capex in this period.
- With little debt and lots of cash, cash interest cover is very large.
- Cash taxes are comparable to income statement taxes.
- Working capital to sales has been rising steadily because of higher stock levels.
- £31M has been absorbed into working capital, while revenue increased by £115M – that’s 27p of working capital for every £1 of revenue, which is high.
- Free cash generation is up from £18M to £31M, at 6.1% pa.
- The aggregate conversion ratio is 85%.
- From aggregate free cash of £213.7m, there have been £195M of dividends.
- Net cash is up £25M to £47M.
Conclusions
It’s been a mixed bag today – the chapters on Cash and Ratios were good, but the one on Predictability was disappointing (largely because of the choice of example company).
- But Keith’s style remains more approachable than similar UK textbooks I’ve read on these topics.
One slight disappointment for me is that he didn’t set thresholds for the various ratios he looked at.
- That would make it easier for me to derive a stock screen from the book, but who said that things were meant to be easy.
We have one more article to come in this series (plus a summary, and then the stock screen).
- That will look at Valuation and Portfolio Management.
Until next time.
Mike Rawson
Mike is the owner of 7 Circles, and a private investor living in London. He has been managing his own money for 40 years, with some success.