Invest in the Best 4 – Valuation and Portfolios
Today’s post is our fourth visit to Invest In The Best by Keith Ashworth-Lord.
Contents
Valuation

![]()
Chapter nine of Keith’s book is about valuation, which he admits is more of an art than a science.
There are no absolutes in valuation; you are looking for the range of values that you think the business might be worth.
Keith looks at a number of valuation methods.
The first group captures only the first couple of years of potential future value creation in a business:
- PE ratio
- Price to Book
- PEG
- Enterprise Value to EBITA / EBITDA
The last two are more long-term measures:
- compounding earnings model
- discounted cash flow
Enterprise value = equity value + debt - cash.
Price to earnings ratio
The PE ratio (PER) is the most commonly used valuation method.
PE = share price / earnings per share
Keith says it’s normal to use projected earnings rather than historic.
- But the studies I’ve seen show that historic earnings have more predictive power (since projected earnings are estimated rather than real).
The PER can be thought of as the number of years it will take the company to earn back the amount of [your] initial downpayment [the purchase price of the share].
Since the payback period will be quicker if earnings rise, growth companies tend to have higher PERs.
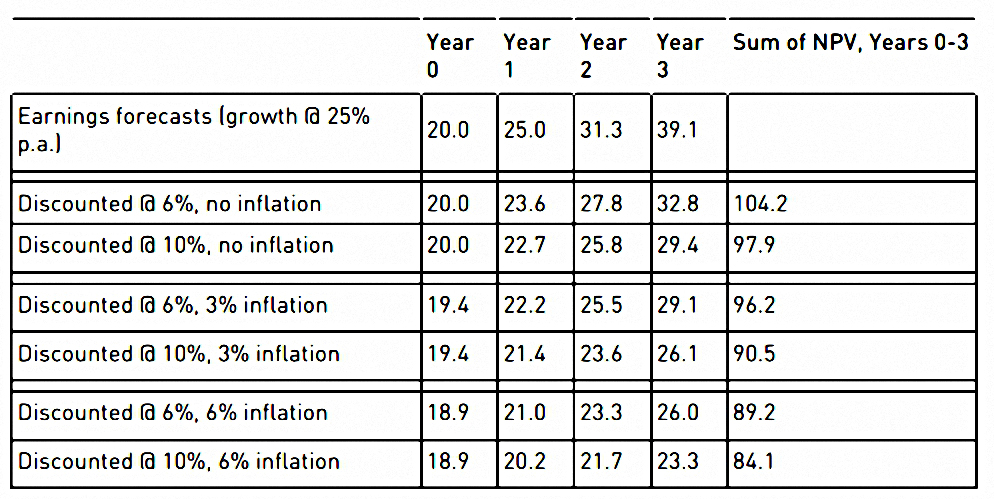
Low interest rates reduce the discount factor and so support higher PEs.
- Low inflation also increases the present value of future earnings.
Earnings yield
Earnings Yield = 1 / PER * 100 %
The earnings yield is the reciprocal of the PER.
The dividend yield is that part of the earnings yield which is paid out to shareholders and will be lower.
PEG
The PER ignores the growth rate of a company, but the PEG – popularised by Jim Slater in his Zulu Principle books – does not.
PEG = PER / EPS growth rate
So a PER of 10 and a growth rate of 15% means a PEG of 0.67.
- Keith likes the PEG to be less than 0.75, and definitely below 1.
Unfortunately, PEG is non-linear and the same PEG is better with a lower PER:
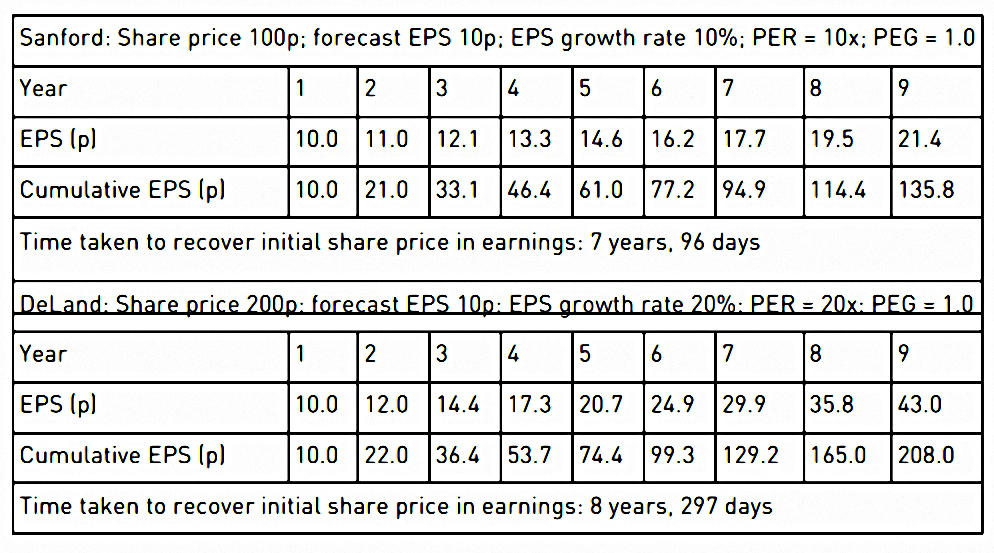
Jim Slater found that PEGs worked best when the PER was between 10 and 20 and the EPS growth rate was 15-25%.
Enterprise value to profit
This is a similar concept to the PER except that the profit measure is struck before interest and tax. Therefore the correct comparator is enterprise value.
Since amortisation (of goodwill and intangibles) is added back, this is known as EV/EBITA.
Which is not to be confused with EV/EBITDA.
- Keith sees depreciation as a true cost to the business (replacement of productive assets) and so thinks EBITDA is worthless.
EV to sales
This is used where the company is not yet profitable (or is a turnaround currently making losses).
- Turnarounds will have low EVSRs, blue-sky firms can have high ones.
Price to book value
Book value is not the value of the company, just the carrying value of the net assets in the balance sheet.
- Keith doesn’t like the mixing of intangible and tangible assets and prefers to compare price to the tangible asset value.
Compounding earnings model
Keith prefers models to metrics, and the first he looks at is the compounding earnings model.
- It tries to work out the value of a firm at the end of a future time period (say five years)
Step one is to value the equity at the end of five years by capitalising an estimate of the following year’s earnings at that time.
The starting point is the value of shareholders’ funds today, to which is added back any goodwill or acquired intangible assets that have been previously written-off to reserves or amortised. This is gross equity.”
Next, calculate the current return being achieved on this – earnings after all taxes, interest, minority interests and preference dividends have been paid.
Future earnings are projected by applying the present return on equity to the opening shareholder equity, as increased by retained earnings, year after year to the end of the projection period.
Keith uses a five-year average for the dividend pay-out ratio ( = 1 – retention ratio).
Here’s the calculation for AG Barr:
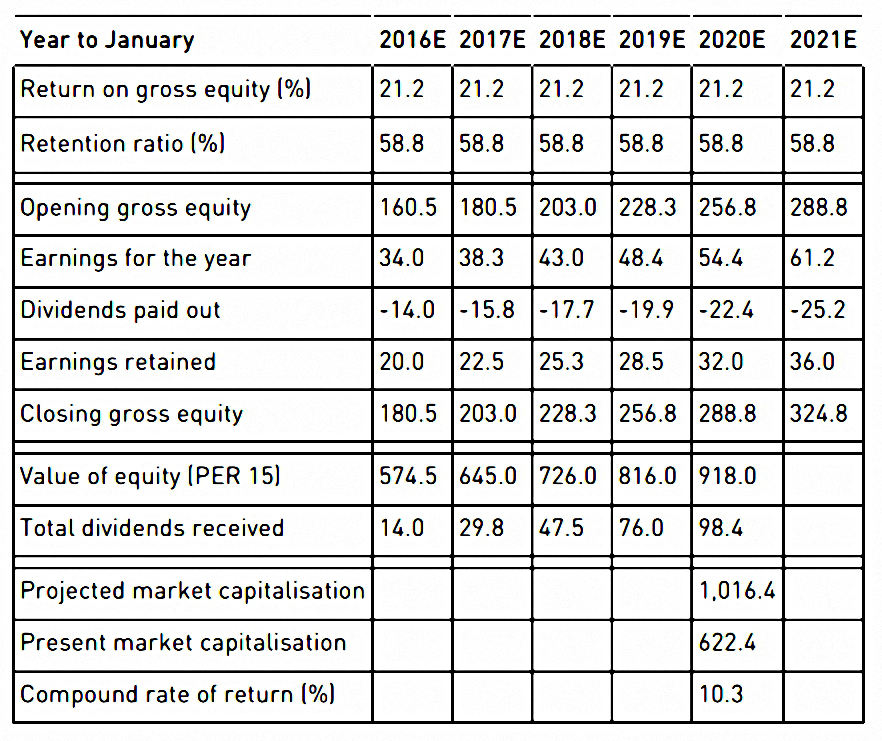
At the end of year five, we have an earnings expectation for the following year (2021) of £61.2m. In the classic compounding earnings model, we would use the reciprocal of the current yield on the benchmark 10-year government bond [to capitalise these earnings].
But as Keith points out, this doesn’t work with the present low bond yields.
- So Keith uses the long-run average PER of the UK stock market, which is 15.
That makes the earnings of £61.2M worth £18M.
- Keith adds dividends over 5 years to give a total of £1,016M.
This gives a compound return of 10.3% pa from the current price.
- Keith thinks this is fine, but he really looks for 15% pa.
DCF analysis
Keith doesn’t like the fact that the methods we’ve looked at so far rely on accounting models.
- He prefers a method which uses what he calls “the economic model of valuation”.
The economic model of company valuation focuses on the sources and uses of cash. So it doesn’t matter where the cash outlays get recorded.
Business Perspective Investors care only about how much cash seems likely to be generated over the lifetime of the business and the risk that it won’t materialise.
The idea is to capture the value of the business in perpetuity.
- Discounted cash flow (DCF) analysis is the most common approach.
The analysis is usually split into two parts:
- the initial stage of some years, where detailed assumptions are made
- the “steady-state” stage where the same assumptions apply for all remaining years (usually including growth at the same level as GDP – 2.5% pa)
Keith simplifies the analysis by using a 10% discount rate rather than a weighted average cost of capital (WACC).
- This is a high hurdle, but Keith prefers to be conservative.
I normally prepare specific forecasts going out three years. Then I look at the company’s return on equity and its retention ratio. The earnings growth rate is then the product of the ROE and the retention ratio.
I will use this growth rate for years 4-5 of the projection period, halve it for years 6-10 and then assume steady state growth at 2.5% per annum.
Here’s a worked example using AG Barr again:
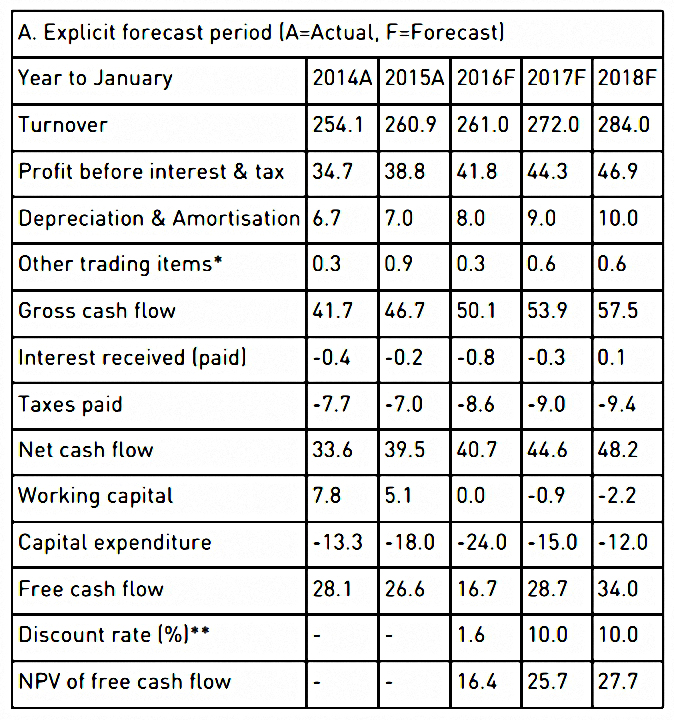

Keith has a short cut alternative:
- value the FCF as an annuity, and discount it back at 10% (ie. multiply it by 10).
- compare this with the market cap and express as a percentage.
In AG Barr’s case, £26.6M of FCF has a value of £266M, which compared to a market cap of £613M is 43%.
- So 57% of the current value is being paid for growth yet to be delivered.
The closer this percentage is to zero (ie. the closer that the existing FCF value matches to the market cap), the better.

Keith ends the chapter with tables showing the pros and cons of
PER and DCF.
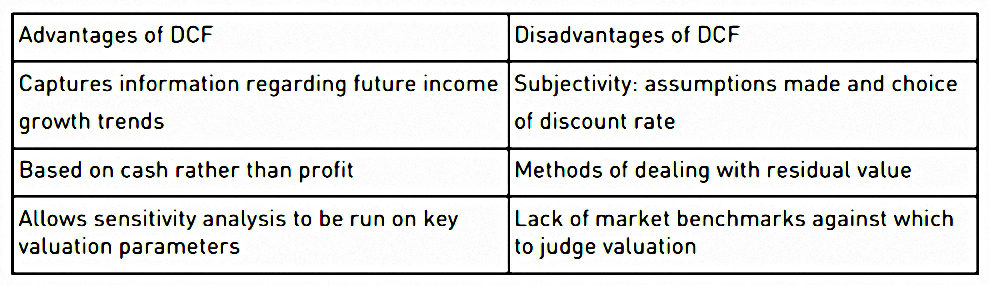
I’m not a fan of DCF because you can produce almost any valuation you like, depending on the assumptions you use.
Portfolio Management
Chapter 10 begins with a discussion of price versus value and the vagaries of market prices, plus the circle of competence.
- We obviously want to buy stocks which are selling at less than their intrinsic value – which won’t be all stocks or all of the time.
Keith professes to be against diversification since it assumes that price volatility is the same as risk.
- But he holds 25 to 35 stocks, so it all comes out in the wash.
I view real risk as being that of investing in the wrong businesses. And by loading more and more companies into your portfolio, you are almost certainly adding businesses at the margin that you know relatively less about. That heightens the risk of backing a dud.
I prefer a bumpy 15% average annual return to a smooth 10%.
My advice would be to select a few companies that are likely to produce above-average returns over the long run and then concentrate the majority of your investments in their shares. Next, make sure you have the mental strength to hold steady during any short-term market ructions.
This is the antithesis of what most people think that portfolio management is, or should be, about.
You can say that again.
- I think that Keith is recommending an unnecessarily risky strategy that requires unusual skill to pull off successfully.
Selling
As you might imagine, Keith is a long-term holder of stocks and has a low portfolio turnover.
- In particular, he won’t sell to bank a profit – like me, he thinks you should cut your losses and let your profits run.
He has five reasons for selling:
- Mistakes
- In this case, cut your losses quickly (rather than holding on in the hope of selling at a small profit).
- Permanent deterioration
- To the franchise, its growth prospects or the management, or perhaps from disruptive competition.
- Switching
- To an alternative superior investment (this is risky).
- Over-inflated asset prices
- Taking money off the table in a bubble (also known as market timing).
- Or a short-term over-valuation of a specific stock or sector.
- Black Swan hits the markets
- Keith has to go back to the oil shock of 1973 to find an example.
- I’m not convinced this is much different to 2008, and selling out there would have been a mistake.
Dividends
Value investors like Keith who seek out compounders of cash should have no interest in dividends – the money is better reinvested in the company.
But he does like dividends:
They provide a useful check during the process of assessing a company as an investment prospect that management is being rational about allocating capital.
A commitment to a progressive dividend policy forces the company to generate sufficient free cash flow to fund it.
- Any excess can be returned periodically through buy-backs or special dividends.
Clearly, reinvested dividends form an important part of the overall return from stocks.
- But you have to have somewhere to invest them.
In general, dividend stocks outperform – yield/carry is one of the outperformance factors along with value (indeed they are closely related).
- Unfortunately, today’s macro circumstances (low yields) mean that reliable dividend payers (“bond proxies”) will be chased up in price and are less likely to outperform in the future.
Checklist
As a conclusion to the book, Keith provides a checklist of ten features to look for in a good business (and the ten corresponding features of a bad business):

Conclusions
And so we have reached the end of the book.
I have two more articles planned in this series:
- a summary of the four written to date
- a return to the Buffettology stock screener that I put together after listening to Keith speak at the Mello funds day in 2019.
I still think that Keith’s book is one of the better examples of its kind (UK stock-picking, with an emphasis on value and growth).
- But this concentrated approach (essentially, only holding a couple of dozen UK stocks as my entire investment portfolio) is not for me.
I believe in value, but only as a small part of my strategy.
On the practical side, Keith’s preference for DCF analysis is disappointing, though his FCF valuation shortcut looks interesting.
- Keith also doesn’t specify many of the preferred values for the metrics he describes (PEG excepted).
This might make updating our stock screen quite difficult.
- Until next time.
Mike Rawson
Mike is the owner of 7 Circles, and a private investor living in London. He has been managing his own money for 40 years, with some success.