Invest in the Best 2 – Return on Capital
Today’s post is our second visit to a new book – Invest In The Best by Keith Ashworth-Lord.
Contents
Return on capital

Keith prefers return on capital employed (ROCE) – what he calls the balance sheet profitability measure – to net profit (the income statement measure).
- Higher ROCE means that a business is worth more.
The less capital you have at risk to generate a given level of sales and earnings, the better off you are because your return for each £1 invested is higher and so the free cash flow generated will be higher too.
It is free cash that ultimately determines value.
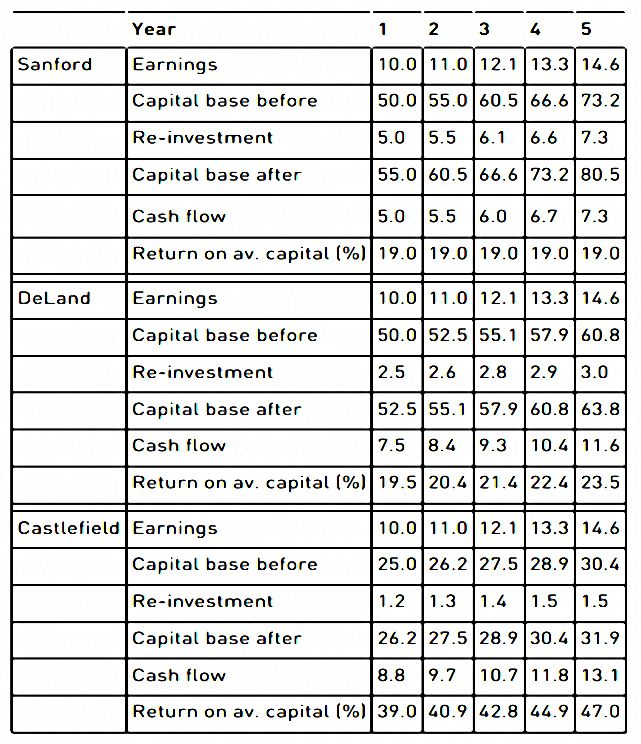
Keith compares his two mythical companies Sanford and DeLand – plus Castlefield, a third company – to illustrate.
- All are growing earnings at 10% pa.
The more capital-intensive Sanford must add to its capital base by 10% p.a. whereas 5% p.a. suffices for the less capital-intensive DeLand.
So over five years, DeLand increases its free cash flow by more.
Castlefield also has lower capital intensity (lower capital growth) but also has a smaller capital base, to begin with.
- It grows its free cash flow even more quickly and has an even higher ROCE.
Keith explains that above-average returns on capital come from some intangible USP that allows them to charge premium prices.
He calls this “economic goodwill”, which should not be confused with accounting goodwill.
- The best way to have avoided this confusion would have been to use a term that doesn’t include the word goodwill.
Without economic goodwill (let’s call it a moat from here on, as Buffett does), higher prices would be competed away by new entrants.
If you add more customers, your moat gets bigger.
- Franchises are good for this, as their growth doesn’t need much capital.
Capital-intensive businesses (measured by comparing fixed and working capital to sales) usually have lower ROCE.
The moat can be proprietary technology, the skills of staff (particularly where developed by the firm itself), or “mind space” (usually known as brand loyalty).
Examples of these great businesses would be Hargreaves Lansdown, RWS Holdings, Bioventix or Games Workshop.
Further down the scale are stocks where more capital is needed, but the return on capital is good (and higher than the cost of capital).
- Keith mentions Rotork, Spirax-Sarco Engineering, Victrex and A.G. Barr.
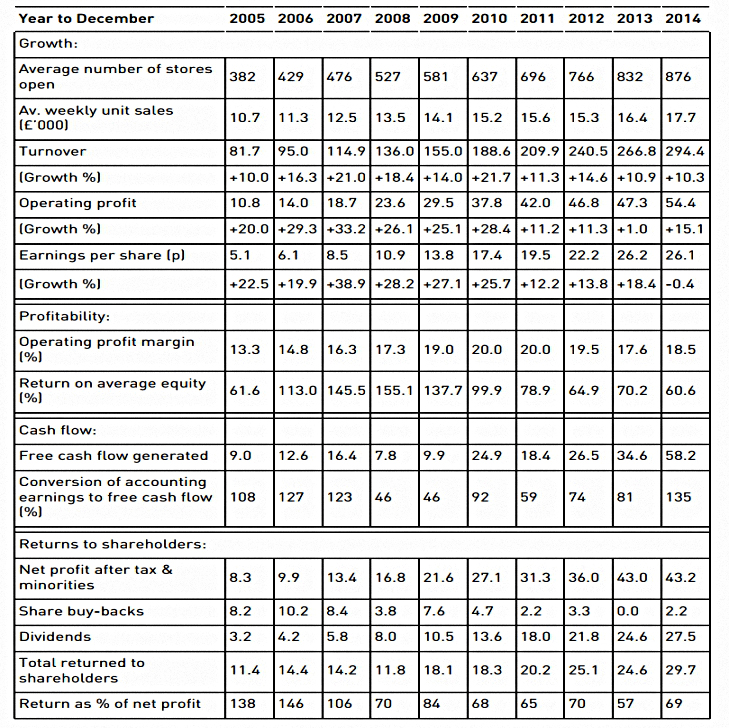
Keith uses Domino’s Pizza as an example of a “land grab” company which captures a large share of a growing market to great effect.
He notes the following features:
- Enduring competitive advantage, based on quality of ingredients, response time, reputation and sophisticated ordering technology. You get the same offering whichever store you buy from.
- Roll-out potential - more than an eight-fold increase in UK store numbers over 20 years. Yet there is still significant growth potential.
- Stores’ capital investment is borne by the franchisees but the parent company takes approximately 40% of stores’ sales through royalties, franchise fees, sale of ingredients, property leasing and IT systems.
- There are margin benefits from economies of scale.
- There is strong cash generation allowing a progressive dividend policy and periodic returns of capital
Note that performance slows down after 2011 when the company acquired the loss-making master franchises for Germany and Switzerland.
Risk and reward
Keith notes that potentially superior returns often come with potentially greater risks.
Business Perspective Investors tread the middle ground, seeking to fence off as much risk as possible whilst still making decent returns.
“hey define risk as business risk, not risk associated with stock market price fluctuations that bear little correlation to the economic realities of the business in question. They believe that ultimately economic value and share prices converge.
“usiness Perspective Investors look for above average returns predictable to a high degree of certainty and carrying the lowest possible risk of permanent capital loss.
Cost of capital
Keith notes that as a business matures, typically new capital attracts a lower and lower return until returns equal the cost of capital and no more capital can be raised.
- Capital intensive businesses will become ex-growth at this point and will start to shrink.
The cost of capital has three components:
- cost of debt (credit risk)
- cost of equity (financial risk from shareholders low position in the capital hierarchy)
- cost of business risk (uncertainty)
Equity is the most expensive class of capital because of the equity risk premium demanded by ordinary shareholders for shouldering additional risk.
Keith ignores academic theory like CAPM:
A realistic equity investor should be looking for a total annual return of somewhere in the range of 8- 10%. So taking 10% as the cost of equity is a reasonable stab.
Better to be approximately right like this than precisely wrong from the CAP-M equations.
Debt
Next, Keith looks at the use of debt:
Interest payments provide a valuable tax shelter. That is why it can make sense for companies to gear up to buy back shares.
The breakpoint is when interest payments can’t be covered from profits.
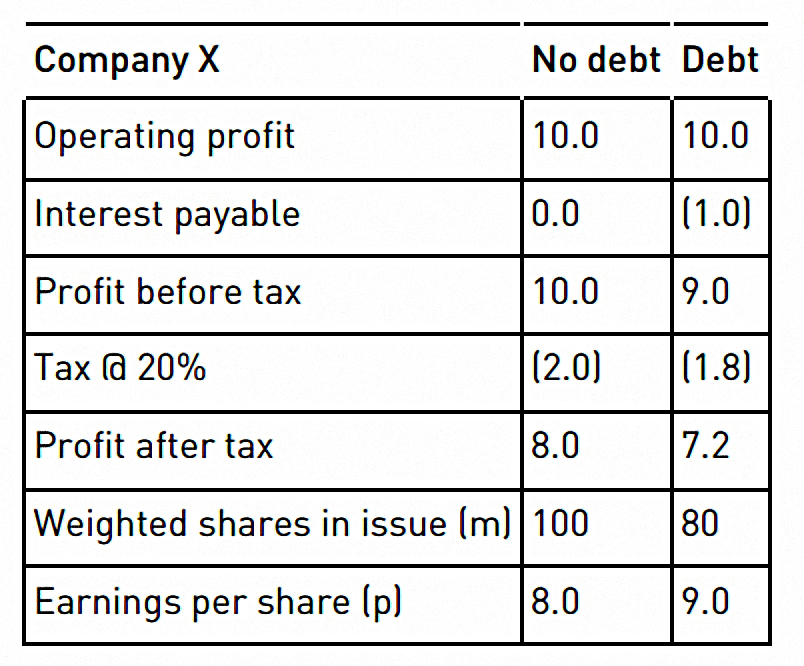
In the table above, Company X has capital of £100M:
- £100M of equity
- £80M of equity plus £20M of debt at 5% pa interest
Using debt increases EPS, even though profit after tax falls.
- Note that the extra risk from debt will reduce the PE at which the market values the share, but probably not by enough to cancel out the impact of the EPS increase.
Companies should borrow if they are able to, not because they have to. The fewer requirements a company has to raise capital for expansion, the more money it should borrow.
As soon as more free cash is generated than can be reinvested for profitable growth, the cash could be used to service more debt with its substantial tax sheltering advantage.
The capital can then be used to pay special dividends, or to retire equity thus allowing future earnings to be shared out among fewer owners. Crucially, though, the strategy only makes sense if equity is being retired at sensible prices.
If a good cash generator doesn’t gear up, it will become an acquisition target.
ROCE and debt
Take a company that has 100 units of capital on which it earns a return of 10 units (i.e. a 10% ROCE). “Suppose it borrows a further 20 units of capital at 5% upon which it earns a return of 8%.
Its earnings will now be increased by the capital borrowed times the spread (8% – 5% = 3%). This increases its earnings from the original 10 units to 10.6 units. But this will have been achieved on 120 units of capital, so the ROCE is 10.6 ÷ 120 = 8.83%.
So leverage can increase EPS but can also reduce ROCE, if the earnings on the new capital are lower than those on the existing capital.
ROE
Keith prefers ROE to ROCE:
ROE is so much more specific because it concentrates exclusively on how good, or otherwise, management is at compounding your equity investment. That means working for you, the ordinary shareholder.
ROE starts with the surplus on trading earned for shareholders after deduction of all prior claims (interest, tax, preference dividends, minorities, etc.).
This is then divided by the book value of equity on the balance sheet (after adding back any written-off or amortised goodwill or acquired intangible assets, and deducting any pure accounting items such as a revaluation reserve).
It is usual to take the average of opening and closing equity, rather than the value at the year-end; hence return on average equity or ROAE.
As you might expect, earnings need to grow more quickly than equity for ROE to go up.
DuPont Analysis
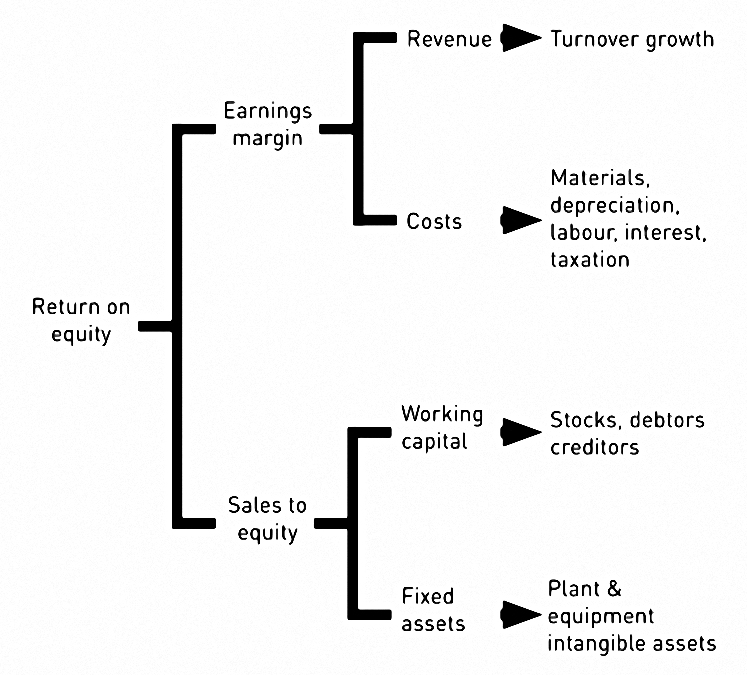
Du Pont analysis breaks down ROE into its components.
- The two big drivers are the sales per equity and the profit margin.
There’s more on this later in the book.
Incremental returns
Keith likes to calculate the ROE on “the most recent slug of investment in the company”.
This just means looking at the numbers from two consecutive years:
marginal return on equity = (earnings 2 - earnings 1) ÷ (y/e equity 2 - y/e equity 1)
Keith compares the marginal return to the average historical return (and presumably the marginal return from the previous period – though he doesn’t explain how to calculate these.
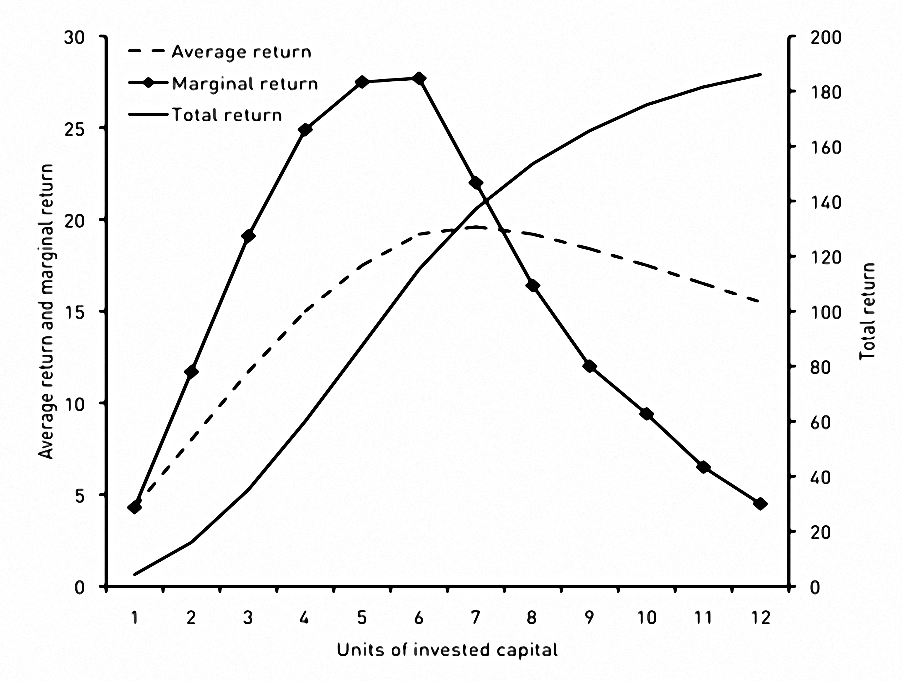
The chart shows the typical pattern of diminishing returns.
- Note that the average return continues to rise after the peak return has passed.
Marginal returns act as a leading indicator compared to average returns (as per Rentokil in an earlier chapter).
- Sometimes Keith uses a 3-year average, particularly if there has been a lot of new investment.
Economic profit
Economic profit is basically the excess of ROE over a company’s cost of capital (times the book value of the capital).
- The cost of capital has to be imputed, which is potentially the tricky bit.
Keith then adds another two variables – growth rate and conversion ratio of earnings to free cash.
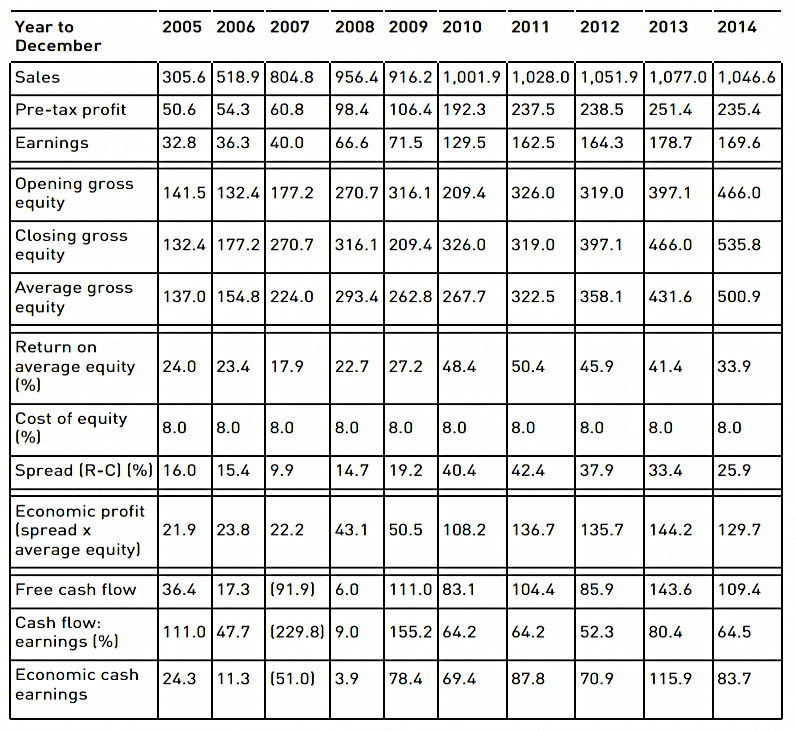
The chart shows the calculation for Croda:
1 – average gross equity (AGE) = shareholders funds + goodwill written off – revaluation reserves
2 – return on average equity (ROAE) = after-tax earnings / AGE
3 – economic profit = ( ROAE – cost of equity ) * AGE
4 – “apply the cash conversion factor” – Keith doesn’t make this step clear, but you express the free cash flow as a percentage of earnings, then multiply the economic profit by this percentage to produce the “economic cash earnings”
The imputed `cost’ of using equity capital is the return an investor might expect on the next best alternative use of his capital if it was invested in a security of the same risk class.
I generally use 8% on equity, this being my 10% required hurdle rate of return on equity, less the standard corporation tax rate of 20%. (It is net of tax, because the earnings you have used to calculate returns are also net of tax.)
In effect, Keith imagines a holding company lending capital to its subsidiaries.
Growing economic profit
There are four ways to capture economic profit:
- Improve the rate of return (new products, pricing, markets)
- Invest in projects with returns higher than the cost of capital (8%)
- Get rid of underperforming assets
- Adopt a more tax-efficient structure (more debt)
In the end, new entrants and/or disruption from new technologies and products should drive economic profit down.
- Keith thinks that expert management of simple businesses is a better bet than a technical edge.
Market value-added
This is the market value of the shares above the share capital itself.
Keith uses this number in a form of annuity calculation.
- If the business was earning 20% on capital and the risk-free rate was 5% (we wsh!) then you might pay four times net asset value to access the equivalent of a 5% annuity (assuming that earnings can be maintained)
- If you can buy at a lower price, you are doing well
Conclusions
This second section of the book has been a bit denser than the first.
- We haven’t covered as much ground as I had hoped today, and I think we might need four rather than three articles to get through the whole book.
On the other hand, I’m enjoying the book more than I expected.
- The next article will look at Cash, Predicability and Ratios.
Until next time.
Mike Rawson
Mike is the owner of 7 Circles, and a private investor living in London. He has been managing his own money for 40 years, with some success.