ISA Statistics 2019
Today’s post takes a look at the recently released UK government’s ISA statistics 2019.
Headlines
The “new” stats – from HMRC – are not that new in terms of the underlying data.
- They only go up to the end of the 2018/19 tax year, so it’s taken more than a year to get them to us.
The main headlines are:
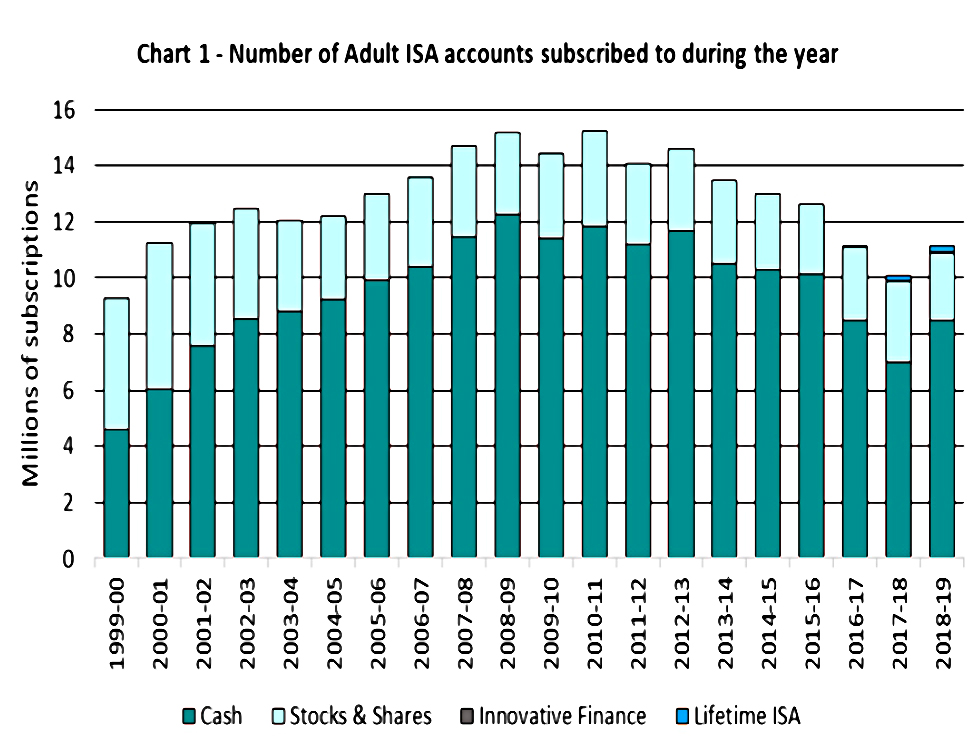
The number of ISA subscriptions rose for the first time in five years, from 10.1M to 11.2M.
- Stocks and shares (S&S) ISA subscriptions fell from 2.9M to 2.4M
- Cash ISAs went up from 7M to 8.5M
- Cash ISAs were therefore 76% of subscriptions (up from 70%)
- Junior ISAs were up to 954K from 907K in 2017/18
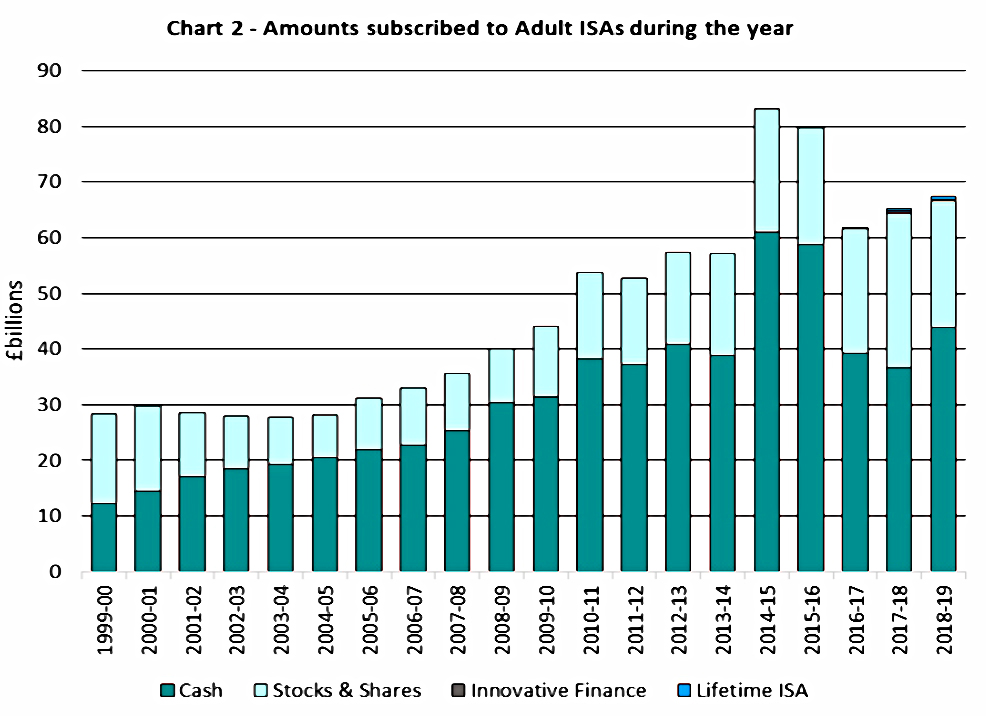
Total subscriptions were £67.5 bn, up from £65.2 bn.
- The record year was 2014/15 when £83.2 bn was subscribed after the annual allowance was increased from £11.5K to £15K
- Cash ISA subscriptions were up from £36.7 bn to £44 bn
- Stocks and shares ISA subscriptions were down from £27.8 bn to £22.6 bn
- £974M went into Junior ISAs, 57% of which was in cash
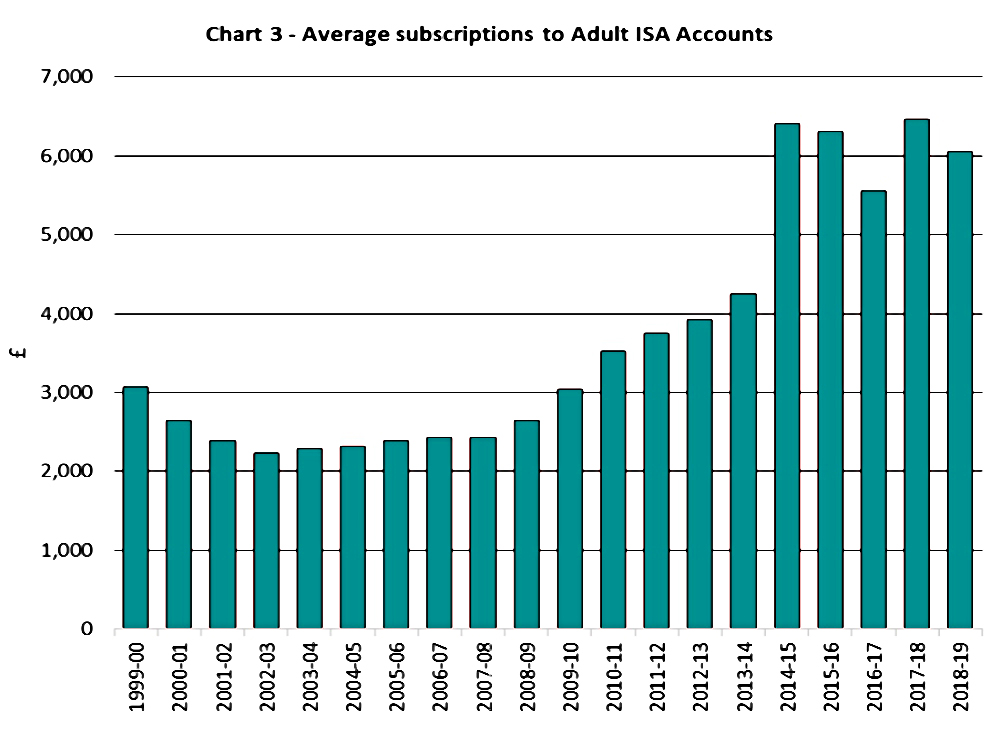
Average subscriptions were just over £6K (down 6% on the previous year).
- The average subscription to an S&S ISA was £9.3K and to a Cash ISA was £5.1K – both slightly down on the 2017/18 figures.
- It seems like the current main annual allowance of £20K is too much for most people, which is not surprising with average incomes at not much more than £25K pa
- At the same time, some people are constrained by the annual limit.
- The average Junior S&S ISA took £1.4K and the average Junior Cash ISA took just £830
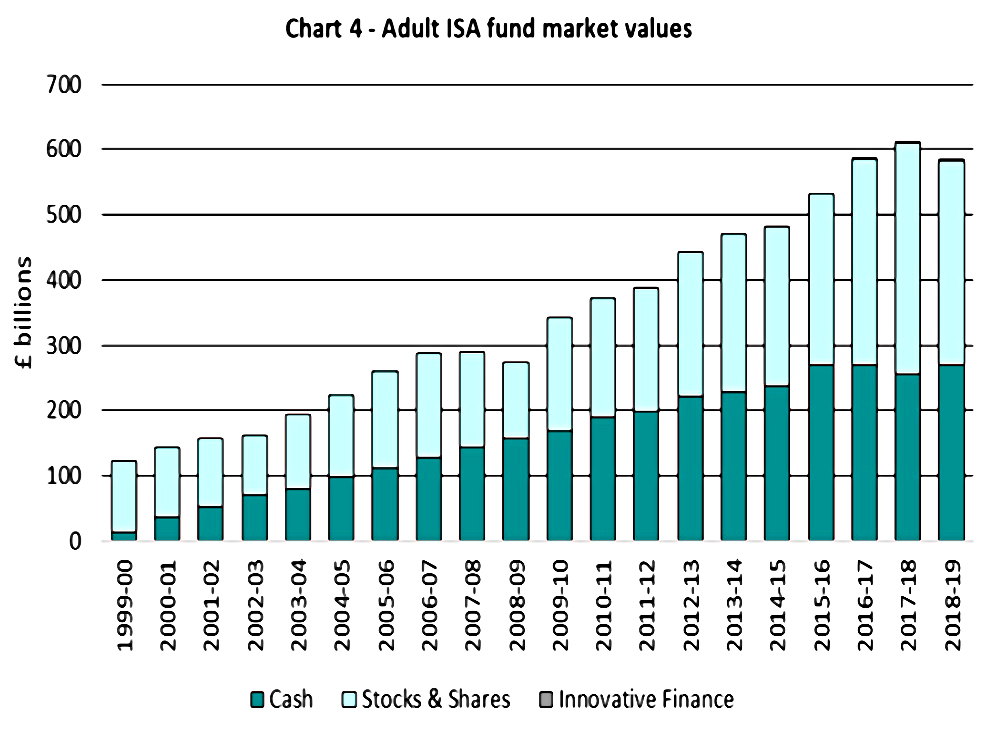
The total value of Adult ISAs was £584 bn, down 4% on the previous year because S&S ISAs fell in value by 11%.
- Cash ISAs were 46% of the total, an increase of 4% on the previous year.
Recent changes
There have been a few relevant changes to tax rules in recent years:
- The ISA limit (for Cash and S&S ISAs, and any split inbetween) increased to £20K in 2017/18
- The Lifetime ISA (LLISA) was introduced in April 2017 (for people under 40, with contributions until age 50)
- There are cash and S&S flavours of LISAs and they appear in the appropriate category in these stats.
- Help to Buy ISAs (HISAs) were closed to new savers from November 2019 (effectively replaced by LISAs), though existing users can contribute until November 2029
- HISAs are treated as Cash ISAs in these stats.
- The final type of ISA is the Innovative Finance ISA (IFISA), designed for P2P loans.
- It has not proved popular.
- The Personal Savings Allowance (PSA) of £1K in tax-free interest (£500 for higher rate taxpayers) was introduced in April 2016
- This makes Cash ISAs less attractive at current low interest rates (£1K in interest equals more than £60K in cash savings).
- The Dividend Allowance (now £2K pa) for tax-free dividends was also introduced in April 2016 (at £5K pa)
- This makes S&S ISAs less attractive to smaller savers (£2K in dividends equals around £50K in savings, though the original £5K allowance could shelter more than £100K).
ISA limits
The report includes a helpful table of the subscription limit since ISAs were introduced in 1999 (before that we had PEPs for stocks):

Income

The median ISA holder has an annual income of around £15K and total ISA savings of £23K.
- The smaller number of people in higher-income bands have much higher average balances.
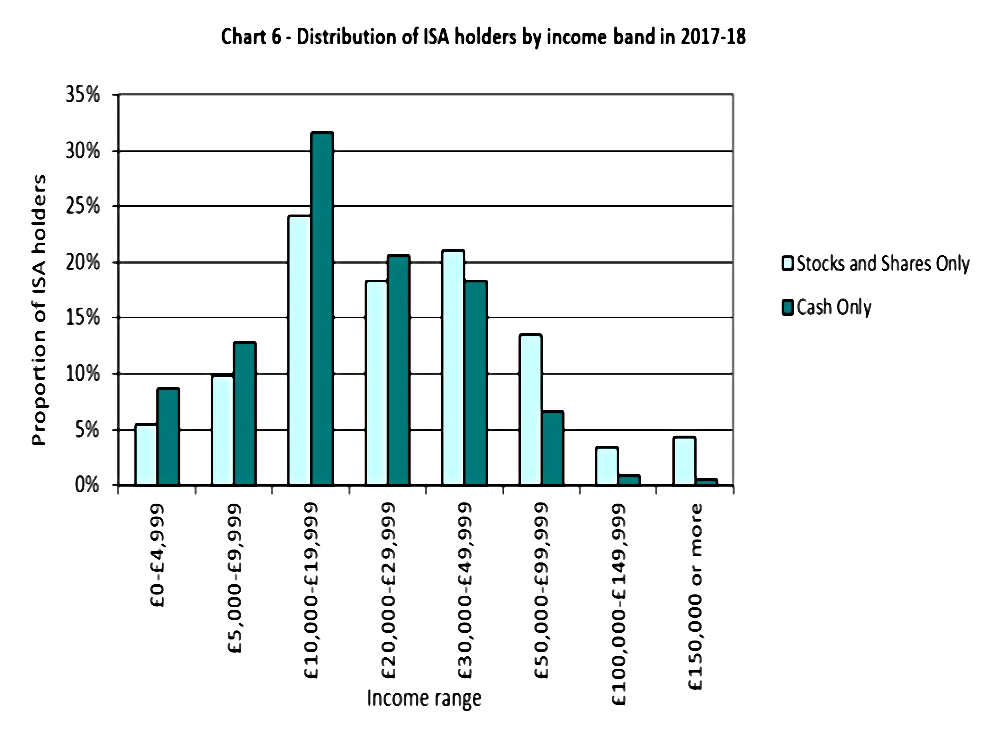
Those on higher incomes prefer S&S ISAs, those on lower incomes prefer Cash ISAs.

Almost half of people (44%) save less than £2.5K into their ISA, but those with higher incomes save more.
- 19% saved the maximum, but 61% of those with incomes above £150K did so.
Some people appear to save more than their income, from savings or gifts from others.
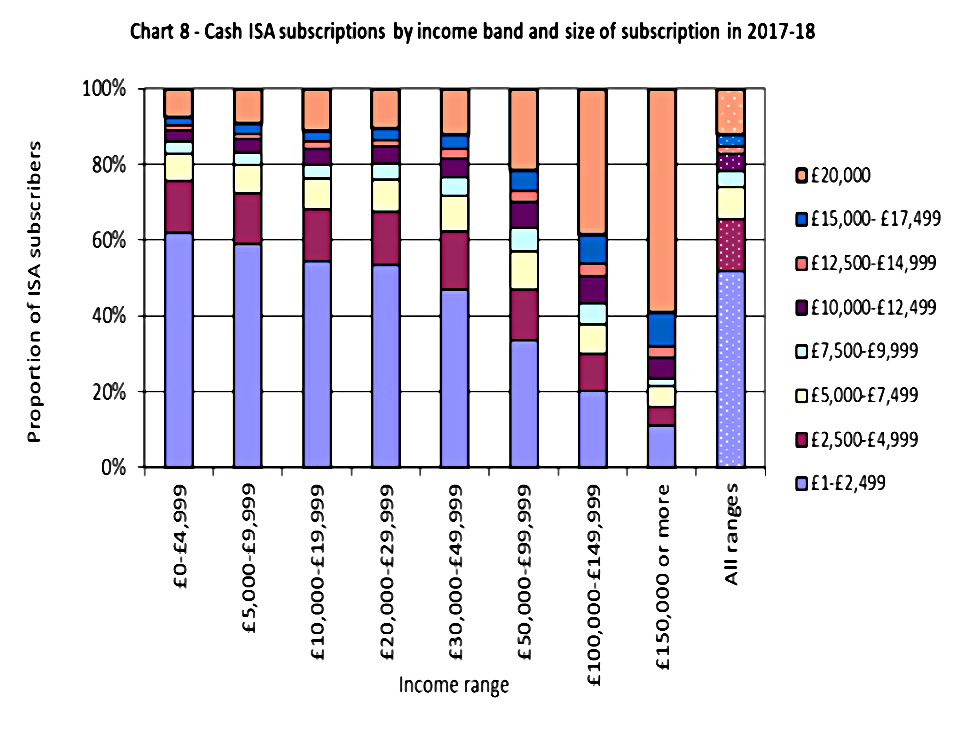
12% of Cash ISA subscribers invested the full £20K.
- The proportion varies from 7% to 57% as we move up through the income groups.
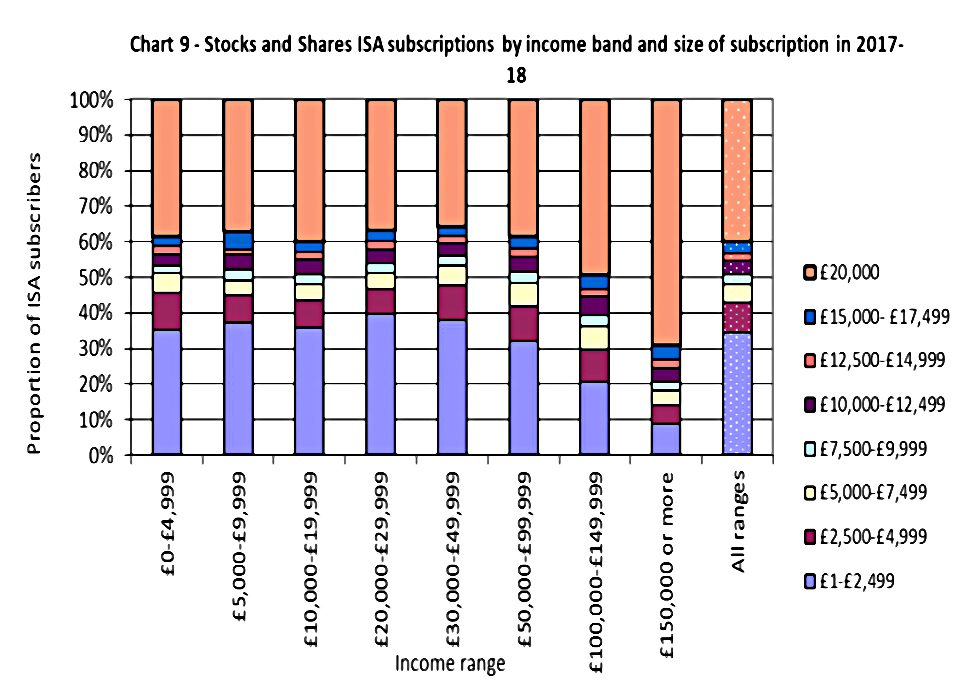
37% of S&S ISA subscribers invested the full £20K.
- The proportion is fairly constant up top an income level of £100K pa, but increases above that.
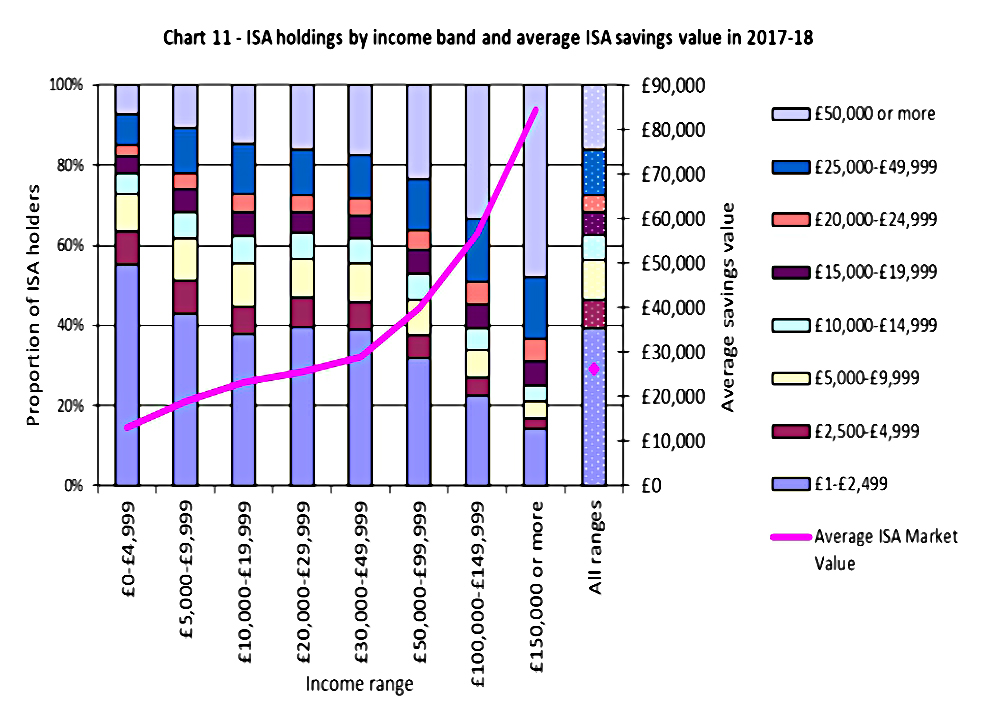
The size of ISA holdings rises with income, but the overall average is around £25K.
- 48% of those with incomes of £150K or more have ISAs worth more that £50K (compared to just 7% of savers with incomes below £5K).
- The average value for these high earners was £85K.
Age
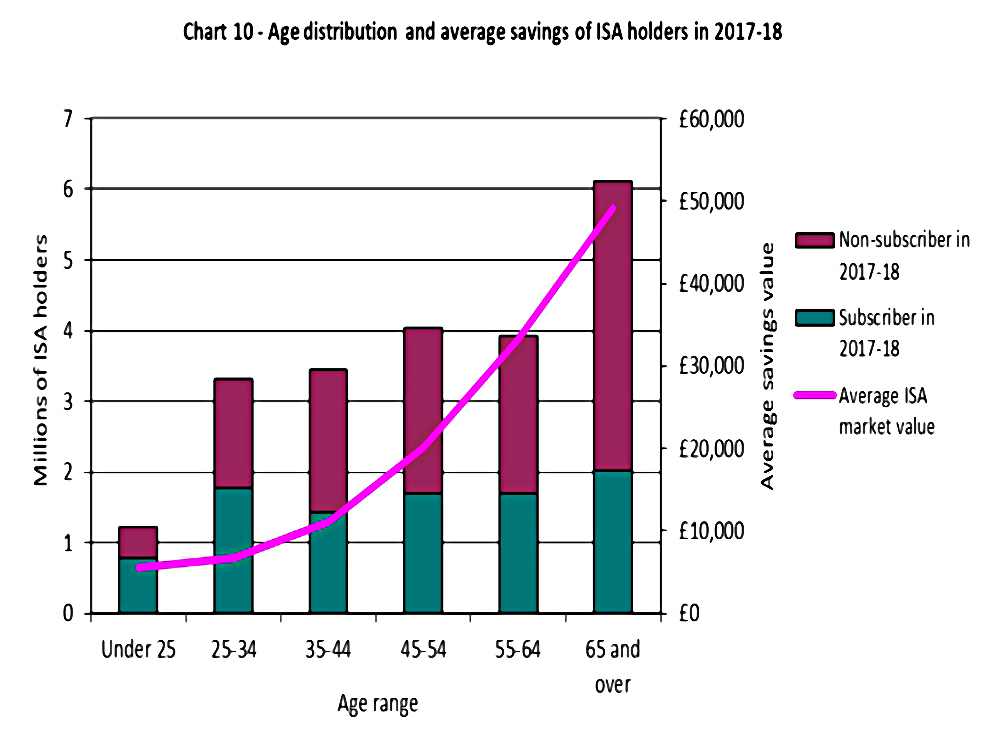
Younger people are less likely to have an ISA, but of those that do, a higher proportion is active savers in the last tax year.
- More older people have an ISA, but a smaller proportion of these holders contributed last year.
Older people naturally have larger account balances than younger people.
- Those aged over 65 have an average balance of £49K, compared with £6K fo those under 25 and £7K for those aged 25 to 35.

The proportion of ISA holders with ISAs valued at £50K or more is highest amongst those aged 65 or more, whilst the proportion of ISA holders with ISAs of less than £2.5K is highest amongst those aged 25-34.
Gender
Gender data is only available up to 2017/18.
- Women hold 11.5M accounts and men 10.6M
- However, male average balances are higher (£28K vs £25K)
Cash ISAs are more popular with women, attracting 74% of subscriptions (down from 80%).
- So the recent move to cash might reflect higher female contribution levels.
This gender preference inevitably means that over the long term, female pots will grow more slowly, exacerbating the savings gap.
Interpretation
Some commentators have seen the move from S&S ISAs to Cash ISAs as reflecting Brexit uncertainty.
- Since S&S ISAs can be filled with international ETFs, the logic isn’t perfect here.
But there was also a bit of volatility in all stock markets across the end of 2018 and early 2019.
If lower risk appetite was the driver, then we can expect more of the same in next year’s stats, as the popular tax year-end ISA contribution boost will have taken place as the coronavirus lockdown was implemented.
- Of course, Cash ISAs have returned less than inflation until recently (inflation is now so low that some cash accounts come out ahead), so the move to cash is a somewhat pyrrhic victory.
That’s it for today.
- Until next time.
Mike Rawson
Mike is the owner of 7 Circles, and a private investor living in London. He has been managing his own money for 40 years, with some success.