Hitting the target – PLSA report on pensions

Today’s post is about a report from the Pensions & Lifetime Savings Association (PLSA) on Pensions. It’s called Hitting the target.
Contents
PLSA
The Pensions and Lifetime Savings Association is a national association that aims to “help pension professionals run better pension schemes”. Their members operate 1,300 pension schemes with 20 million members and £1 trn in assets.
We work to get more money into retirement savings, to get more value out of those savings and to build the confidence and understanding of savers.
Hitting the Target
The report is a PLSA consultation paper, and contains questions and policy proposals. Responses will be accepted until 12th Jan 2018.
Whilst workplace pension auto-enrolment means that more people than ever are saving into a pension, contribution levels are falling (since those from auto-enrolment are low) and many workers think that the current levels are “enough”.
Saving rates are also at record lows and property ownership is falling, so the PLSA worries that millions could be heading for disappointing incomes in retirement.
Income
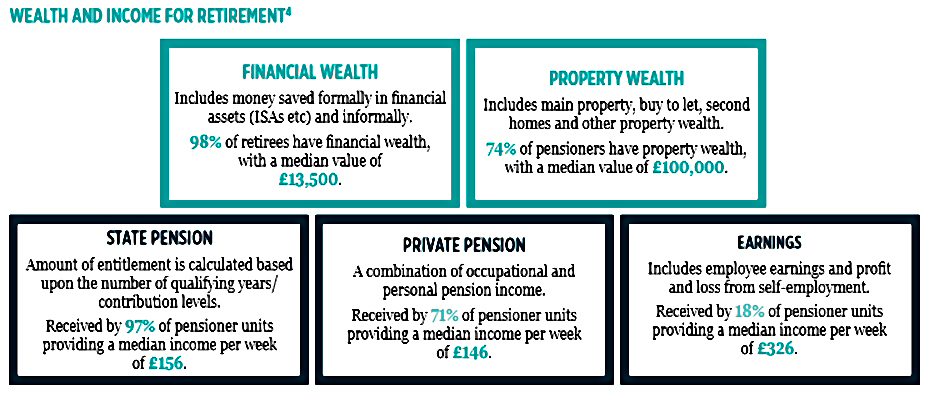
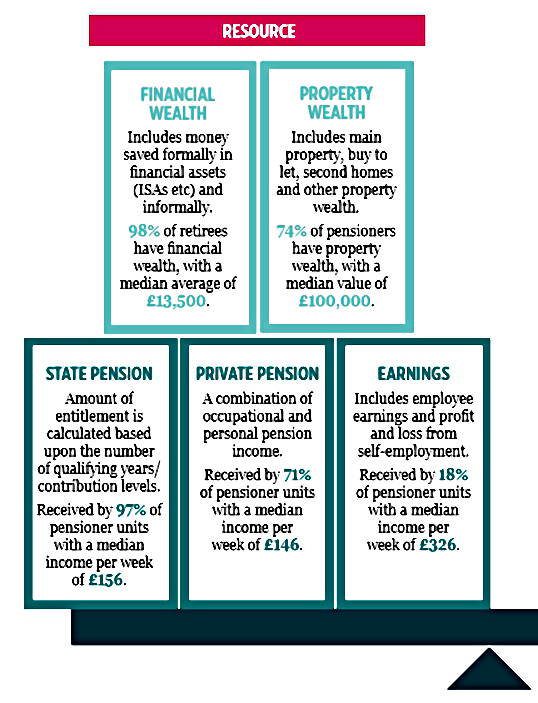
Most people have state pensions, possibly a private pension, and possibly property wealth. (( Note that retirement income data treats a couple as pensioners if only one of them receives the state pension, so some income may be from a partner working ))
- 97% of pensioners get the State Pension, with an average weekly income of £157
- 71% of pensioners get a private pension, with an average weekly payment of £146
- the top 20% of pensioners get at least £9,600 per annum from a private pension
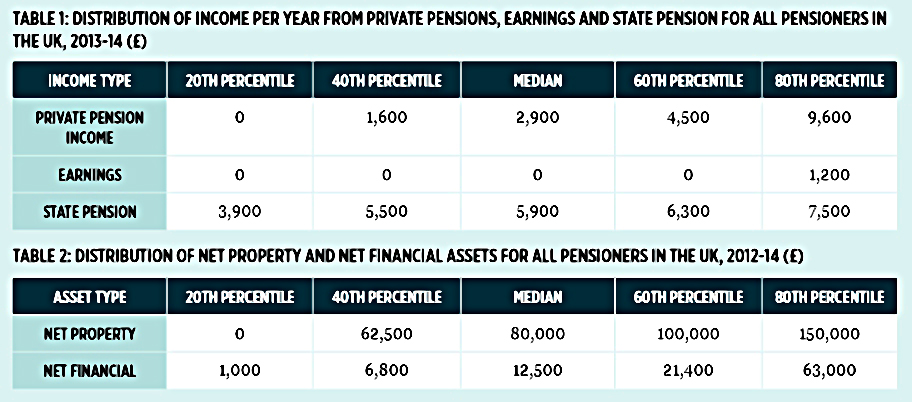
For the bottom 60% of pensioners, financial assets are low in value (less than £22K)
- Even for the top 20% (with £150K or more in property wealth) property can’t produce a sizeable income.
- Very few pensioners use property to generate additional income.
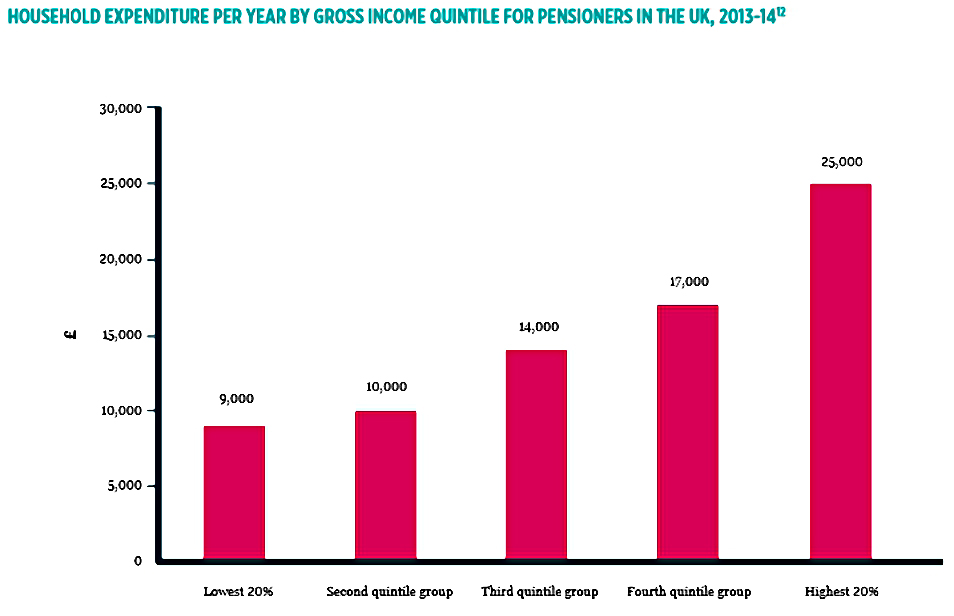
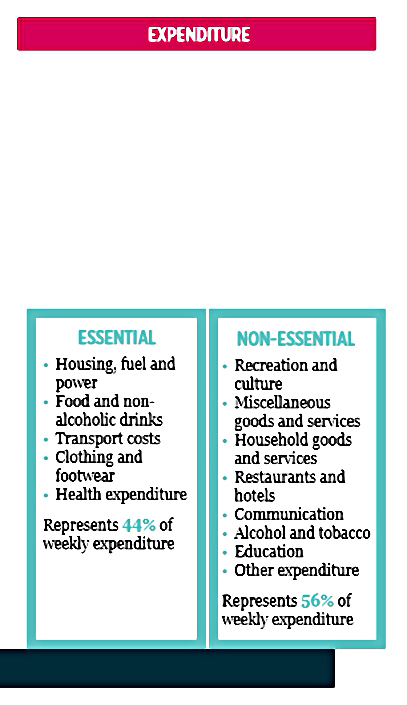
Expenditure
The bottom 20% typically spend £9K a year, while those in the top 20% spend £25K.
All income groups tend to spend less as they get older.
- A household headed by someone over 80 spends 43% less than a household headed by a 50-year-old.
- Health problems are a key driver, as is the desire to leave a bequest.
For most current pensioners, income and expenditure are in balance.
Generational issues
There are significant differences between generations.
- Millennials = those aged 22-34
- Generation X = those aged 35-54
- Baby Boomers = those aged 55 – 64
Retirement costs are expected to rise because of rising longevity, increase care costs and a trend towards more debt and more rental payments into old age.
- Future generations are less likely to find they have adequate income in retirement.
Contributions and targets
Average DC contributions are 4% pa at the moment, though the minimum will rise to 8% in a couple of years.
- This may trigger some level of opting out, but for those who remain, average contributions will rise.
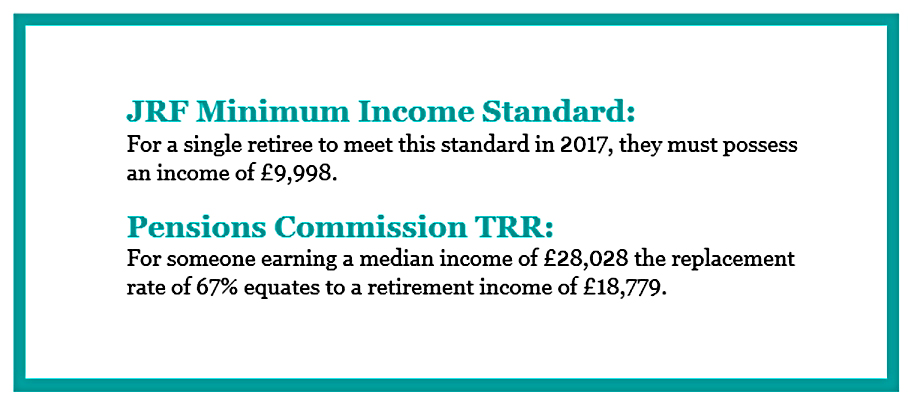
Reasearch shows that 8% pa will mean that 94% reach the JRF minimum target of £10K of income.
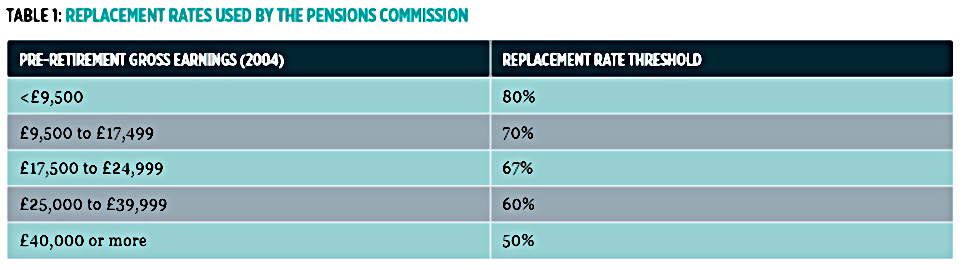
Far fewer will meet the Pension Commission’s Target Replacement Rate (TRR).
- For a worker on median income of £28K, the TRR is 67%, or £19K in income.
Shortfalls vary by generation:
- 39% (3M of 7.5M) of Millennials will miss the target
- As will 51% (6.9M of 13.6M) Generation X workers, and
- 45% (2M) of Baby Boomers.
In each generation, most who will meet the target have some access to DB pensions.
- Those without are much less likely to hit their TRR
So auto-enrolment as currently configured won’t solve the problem.
Declining property wealth
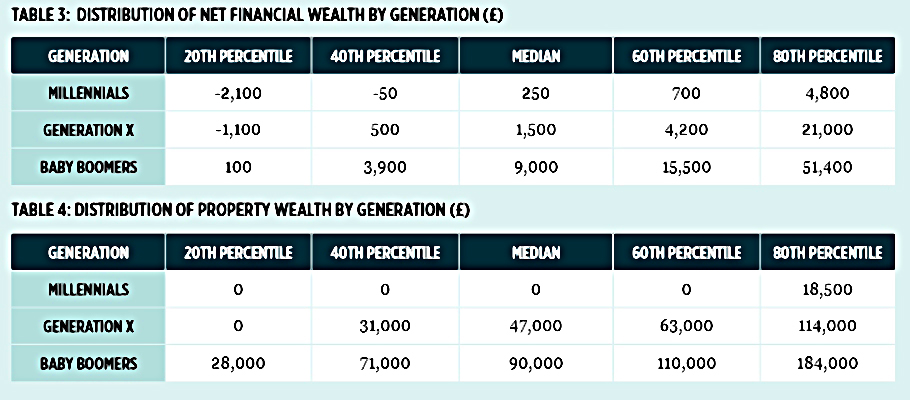
Property wealth is unequally divided between and within generations.
Baby Boomers have an average of £90K of property, with the top 20% having £184K or more.
- So few can generate a significant income from property.
And property wealth is falling across the generations, as home ownership rates decline.
- 71% were homeowners in 2001, but this was down to 63% by 2016.
Financial wealth
Financial wealth is relatively small outside of the top 20% of each generation.
The bottom 40% of Millennials and the bottom 20% in Generation X have net financial debt.
Even amongst Baby Boomers, only the top 20% (£51K or more) could make any contribution to retirement income.
Longevity
Life expectancy at birth has improved consistently over the course of the last century.
In 1951, life expectancies of men and women were 66.4 and 71.5 years.
- By 2011, this had grown to 79 and 82.8 years.
So living costs will need to be supported for longer, requiring a bigger pot.
Care costs
As people live longer, their chance of contracting a major chronic condition increases significantly.
- The proportion with an illness rises from 16% at age 65 to 50% at age 85.
So the demand for social care is likely to rise.
- Even if a shared risk solution is found to care costs, the average cost per person will go up.
Increased housing costs
In 2016, 72% of those aged 65 or more owned their property.
- 5% still had a mortgage and 22% were renting.
But bigger mortgages to pay for more expensive housing means that in the future, more people are likely to carrying debt at an advanced age.
- This obviously means that they are not building up the required assets to fund retirement (outside of their property).
- If they downsize, or access equity release, they could raise some retirement income.
And more retirees are likely to still be paying rent.

How much is enough?
One of the key issues raised by the report is “How much is enough?”
People know they need to save, but they lack guidance on how much to save. Simple targets, presented in straightforward pounds and pence, could help them get on top of their savings needs.
Most people (77%) don’t know how much they need to save, and the previously mentioned JRF target and the TRRs are not well understood by the public.
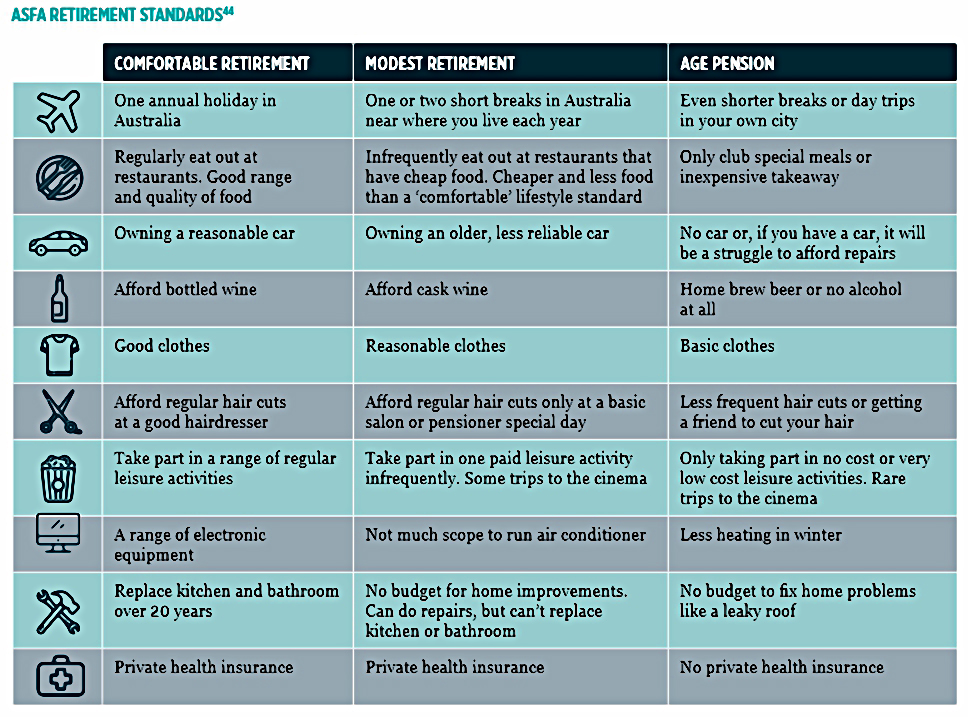
The PLSA wants to adopt the Australian approach of explaning how much money is needed to reach a series of targets (minimum / modest / comfortable).
The Australian system defines goods that can be purchased at each retirement level, and matches these to income levels for single people and for couples.
- The lowest income level is matched to the state pension alone.
- There are also different targets for younger and older retirees, who usually have different needs.
All of these numbers are updated quarterly to reflect changes to CPI.
I like this approach in principle, but the PLSA falls short of defining the income levels (and lifestyles) for the UK.
- They do recommend that the JRF MIS of £10K be useds as the “minimum” level.
They recommend a basket of goods approach (as in Australia) for the other levels.
- They expect the two higher numbers to be £15 to £20K pa and £20K to £30K pa.
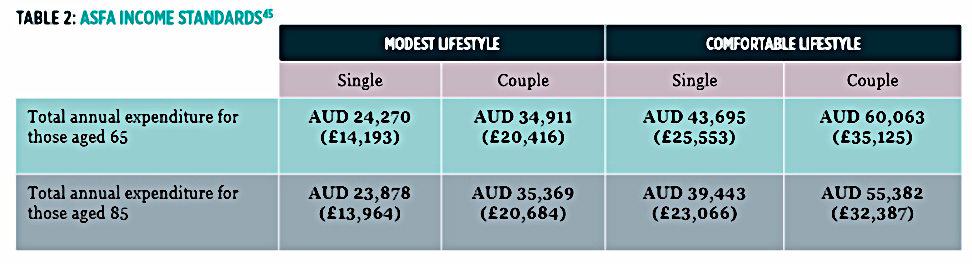
A single person on the comfortable lifestyle needs £25K pa in Australia, which seems reasonable from a long way away.
When UK workers of all ages were surveyed, they came up with the following targets:
- minimum = £10K to £15K pa
- modest = £20K to £25K pa
- comfortable = £35K pa or more
When people aged 55-64 were asked, the numbers dropped:
- minimum = £10K pa
- modest = £10K to £15K pa
- comfortable = £15K to £20K pa or more
This presumably reflects people’s expectations of what they might actually be in line to receive.
![]()
The PLSA also note that targets might need to take into account property status (owner vs renter) and regional variations (costs vary widely across the UK).
Hitting the target
The PLSA acknowledge that most people find long-term financial decisions difficult, and are disengaged from their retirement savings process.
There are two ways to address this at the individual level:
- defaults – opt-in, default funds and default contribution levels
- engagement – interventions (tools and advice) at key points to make decisions easier.
There are also two approaches at the market / product level:
- governance – using a surrogate customer to act in the scheme member’s best interest
- regulation – to correct market failings

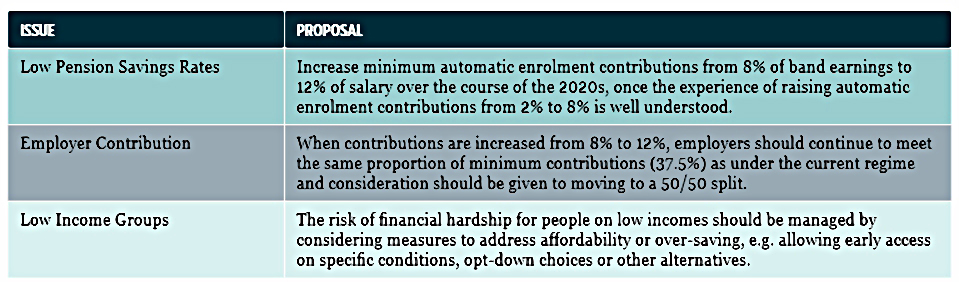
The main policy change that the PLSA would like to see is an increase in contributions levels to auto-enrolment workplace pensions from the planned 8% to 12 pa.
- They would like 50% of this to come from employers – the current target is 37.5%

Research in the US and New Zealand suggests that workers rely on default levels as a guide to how much they need to save.
- As we have already seen, 8% pa will not be enough for most people.
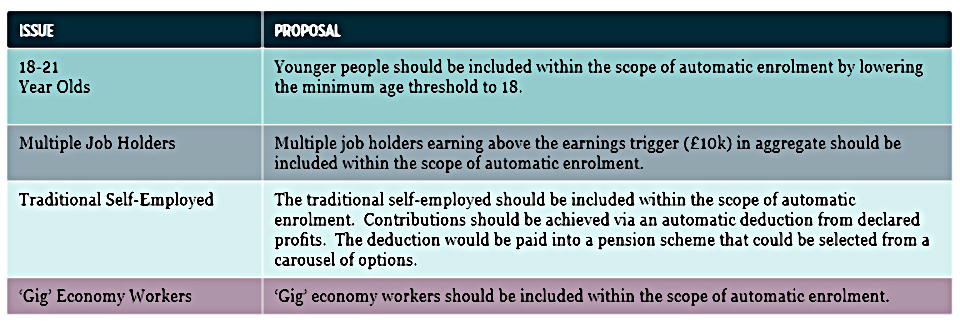
The PLSA would also like to see the scheme widened to groups of workers not currently included.
And they would like to see the role of tax relief on pension contributions reviewed, though they support the existing EET (exempt, exempt, taxable) system over TEE.

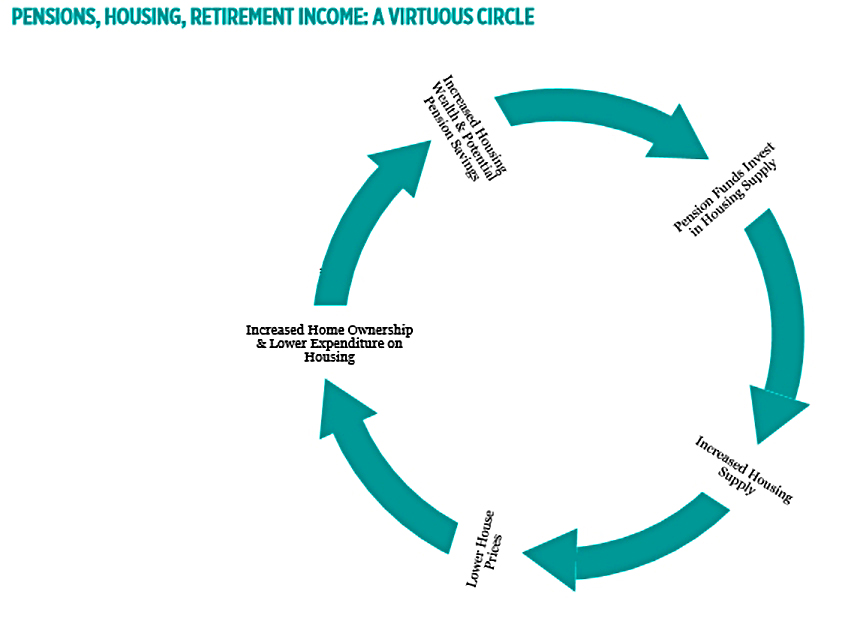
Property
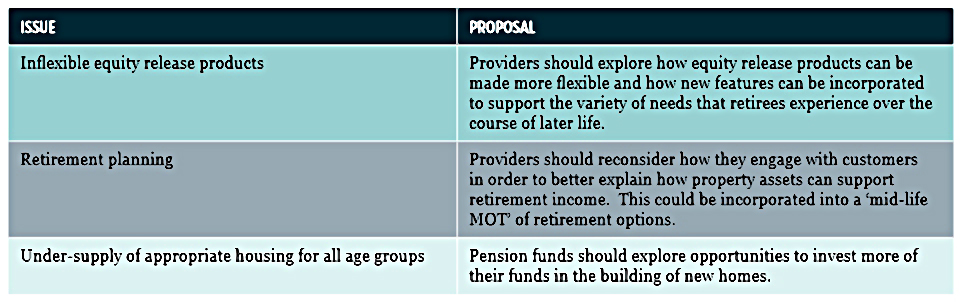
The PLSA are also keen on equity release as a way for pensioners to access their house equity.
This is not popular at present because people worry about the debt spiralling out of control (consuming all of the equity) and because most people want to pass on money to their descendants.
Downsizing would be a safer way to access the equity, but there is a general shortage of housing and a particular shortage of housing suitable for older people.
- And for those of us in the south of England, the high levels of stamp duty make trading down expensive.
Only 2% of current housing and 3% of new housing is elderly or sheltered accommodation.
- The PLSA would like to see pension fund provide the finance for more of this type of housing.
Legal & General has just bought a firm with a view to building 3,000 homes for the elderly over the next five years.
- At that rate, it will take some time to help the 3.3M people who would like to downsize.
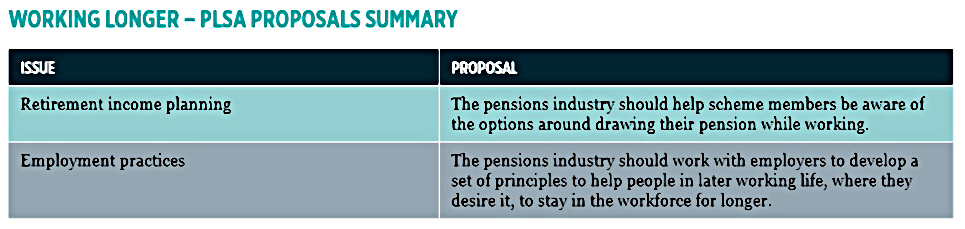
Working Longer
The PLSA come to the fairly obvious conclusion that those who haven’t saved enough (in pensions or property) will have to work longer.
- They want the industry to do a better job of explaining to people how they can stay in the workforce for longer, and the issues around drawing a pension whilst still working.
Governance
There’s not much new in this section – its all about the role of trustees in making sure that schemes are value for money.
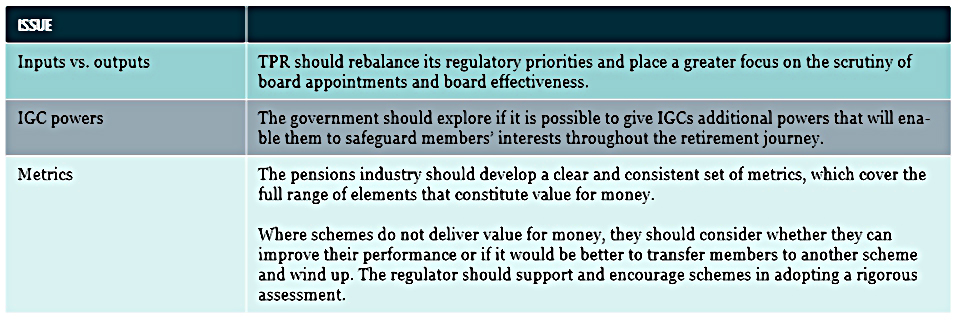
I’d prefer to see a price cap on schemes, of say 0.5% pa.
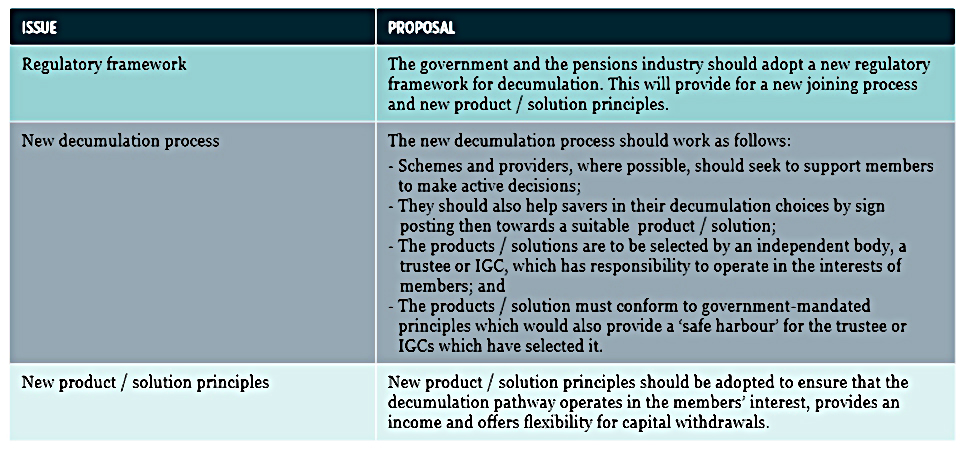
Decumulation
The PLSA would like to see a new decumulation roadmap.
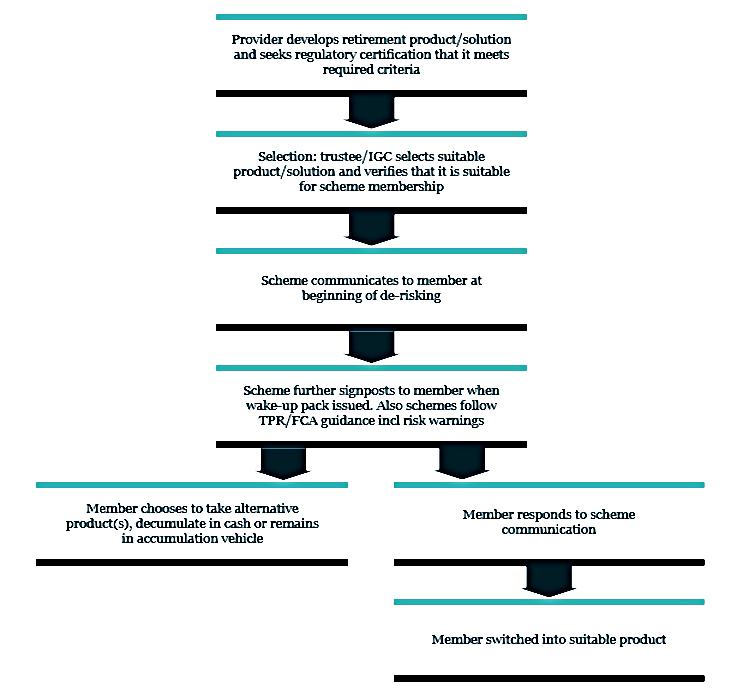
I’d just like to see the transition from accumulation (in a SIPP / workplace pension) to decumulation (via flexi-drawdown, in a a SIPP / workplace pension) made seamless.
- There’s no reason for drawdown to feel any different to accumulation.
- You’re just taking money out instead of paying it in.
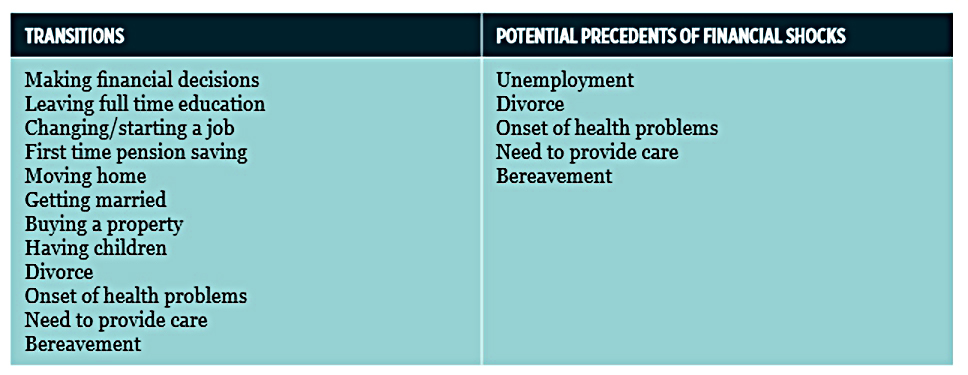
Engagement
Most savers are not engaged with their savings.
The PLSA believes that their retirement income targets could help with this.
- They would supplement this with the pensions dashboard,
- And with standardised messages and rules of thumb delivered at various teachable moments throughout a saver’s lifetime.
I agree with this approach, subject to two caveats:
- the income target needs to be translated (via a pension pot size target) into a percentage savings target.
- the pensions dashboard needs to show progress towards a chosen target, with recommendations for what to do when there is a shortfall.

Conclusions
The report looks at current pensioner wealth (in state and private pensions, as well as property for some) and looks at the pressures on each of these areas for future generations.
- Younger savers are not accumulating wealth at the same rate as earlier generations.
- They can expect longer lives to fund, and will potentially be paying rent at more advanced ages.
The PLSA believe (as do I) that auto-enrolment minimum contributions should be increased.
- They recommend a 12% target to be reached over the next dozen years.
- I would prefer 15%, and over a few years (say five).
- I would also like the opt-out to be removed.
The PLSA also want to extend the scope of auto-enrolment to cover basically everyone, which sounds good to me.
The PLSA is keen on equity release for those pensioners with property, but I don’t like this product.
- It reverses the snowball effect of saving – where yearly increase in wealth tend to accelerate – with a “spiral of doom” as the rolled up interest on the loan escalates each year.
The PLSA also want to encourage more engagement from savers with their pension pots.
- The income targets should help here, but there is also a role for the Pensions Dashboard.
- And the PLSA has developed a list of “teachable moments” where positive savings behaviours can be reinforced.
The key proposal in this report is that a set of UK retirement income targets (modelled on those in Australia) should be developed.
But this only takes us halfway to a solution:
- a retirement lifestyle requires a retirement income,
- which needs a retirement pot to generate it,
- which requires pension contributions whilst working.
The second half of the story is missing here.
- Interestingly, the Australian system does include target lump sums (eg. £320K for a single person to achieve a “comfortable” retirement) but the PLSA report doesn’t mention it.
- The Australian system doesn’t include a target contribution rate, but their Superannuation system makes mandatory deductions of at least 9.5% pa in any case.
I can’t help feeling that it would be simpler to work out what is the annual level of contributions needed for the modest lifestyle, and make that the mandatory minimum level for workplace pensions.
- Then those aiming for the comfortable lifestyle could be told how much on top of that they would need to save.
It’s more contributions that we’re aiming at, not just a better understanding of required retirement incomes.
Until next time.
Mike Rawson
Mike is the owner of 7 Circles, and a private investor living in London. He has been managing his own money for 40 years, with some success.