Leverage in Retirement

Today’s post looks at a couple of articles from ERN on using leverage in retirement.
Contents
ERN

ERN (not his real name) is one of the heroes of this blog.
- He runs the Early Retirement Blog.
We’ve leant on his work in two areas previously:
- His Safe Withdrawal Rate (SWR) series to work out what you can spend in retirement
- His options trading
ERN’s work has two key advantages for me:
- The SWR series uses historical data rather than Monte Carlo analysis – I prefer this because I believe in sequential returns in stock prices (eg. sharp recoveries after crashes).
- The options trading strategy (which he hasn’t quite tempted me into yet) is attractive because it’s very conservative and ERN himself uses it for a large portion of his retirement pot. (( ERN has already FIREd ))
Today’s posts are also from the SWR series, which is now more than fifty articles long.
Leverage in Retirement
The first post we’ll cover is SWR 49, from November 2021.
- It looks at leverage as a solution for sequencing risk.
Instead of selling assets in retirement, why not simply borrow against your portfolio? And pay back the loan when the market eventually recovers.
ERN notes that borrowing against assets is very common amongst high net worth households.
- You can avoid capital gains tax by waiting for the “step-up” in the cost base on inheritance.
This is known as the “buy, borrow, die” approach.
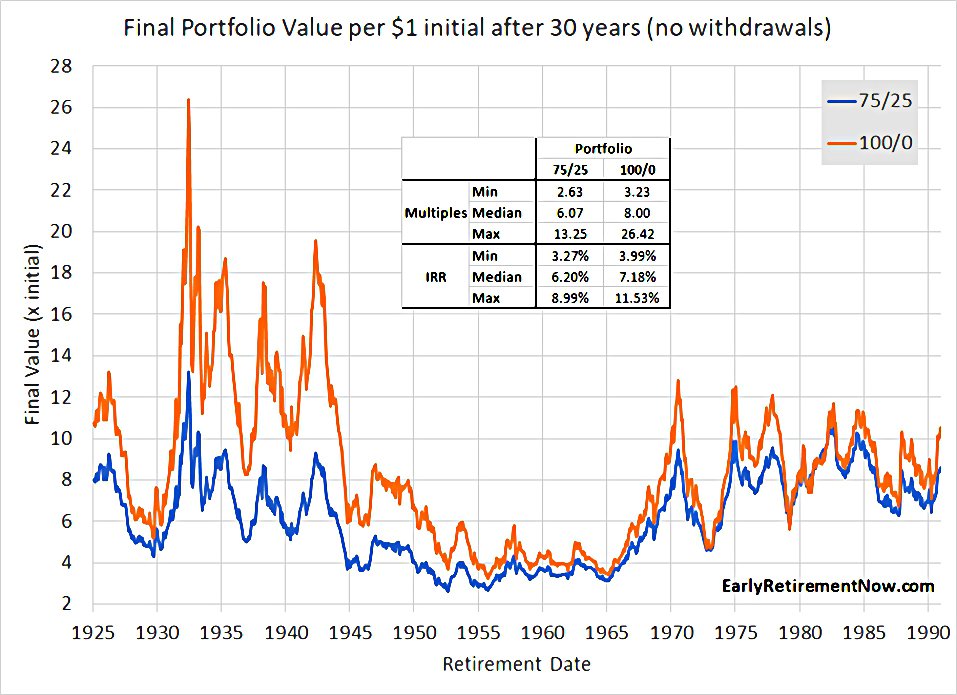
ERN starts by looking at a 30-year retirement for cohorts between 1925 and 1990.
- He compares a 75/25 stock-bond portfolio to 100% stocks, with returns after inflation (CPI).
For the 75/25 portfolio, the final value ranged from $2.63 to $13.25 per dollar of initial capital. That’s a geometric average return of between 3.27% and 8.99%.
For the 100% equity portfolio, the worst-case outcome was a 3.23x multiple and in the best-case scenario, the portfolio grew more than 26.4x. So, even in the worst-case scenario you still had a 3.99% real return.
ERN’s previous SWR work led me to arrive at a failsafe withdrawal rate of around 3.25% pa from a 75% stocks portfolio, so these numbers are close to what I expected.
To model the SWR with a margin loan, ERN makes two assumptions:
- interest rate
- size of loan
Interest rate
Interactive Brokers (IBKR) offers margin loans from 0.3% to 1.5% above base rate, depending on the size of your account.
- For a $1M loan, the rate might be 1%
If we assume that the long-term forecast for the Fed Funds Rate is 2.5%, the long-term CPI inflation forecast is 2%, and the IB spread is 1%, then we should
be able to borrow at about 1.5% above inflation.
ERN decides to model three rates: 0%, 1.5% and 3%.
Size of loan
Assuming a $1M portfolio that grows to $3M over 30 years, and a 25% margin requirement (the deposit, in home mortgage terms), the maximum loan would be $2.25M.
- But margin rates can change and most investors won’t hold all their wealth in a taxable brokerage account (the only marginable kind) at IBKR. (( At the time of writing, only 8.4% of my wealth is in taxable accounts ))
So instead, ERN calculates the “SWR” with a loan of various sizes for his $1M portfolio growing to $3M, at his three chosen real interest rates.
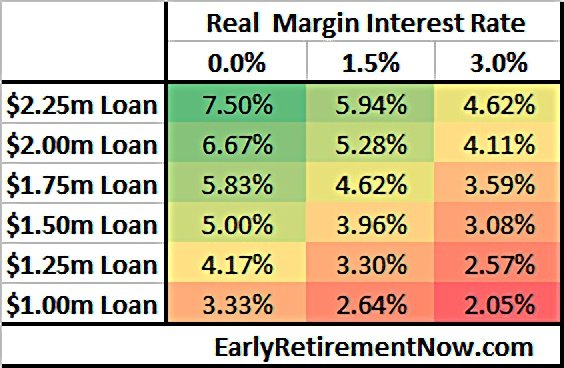
Using the central 1.5% interest rate, the L-SWR for a loan of $1.5M is 3.96%, and for a loan of $2M, the L-SWR is 5.28%.
That’s pretty amazing because this would imply a 5.28% safe withdrawal rate with capital preservation! In contrast, you’d normally just scrape by with a 4% Rule and a zero final portfolio target.
So what’s the snag?
The margin requirement has to be satisfied not just after 30 years, but at all times along the entire retirement horizon.
This means we need to look at the cohorts with the worst sequence risk.
1965 cohort
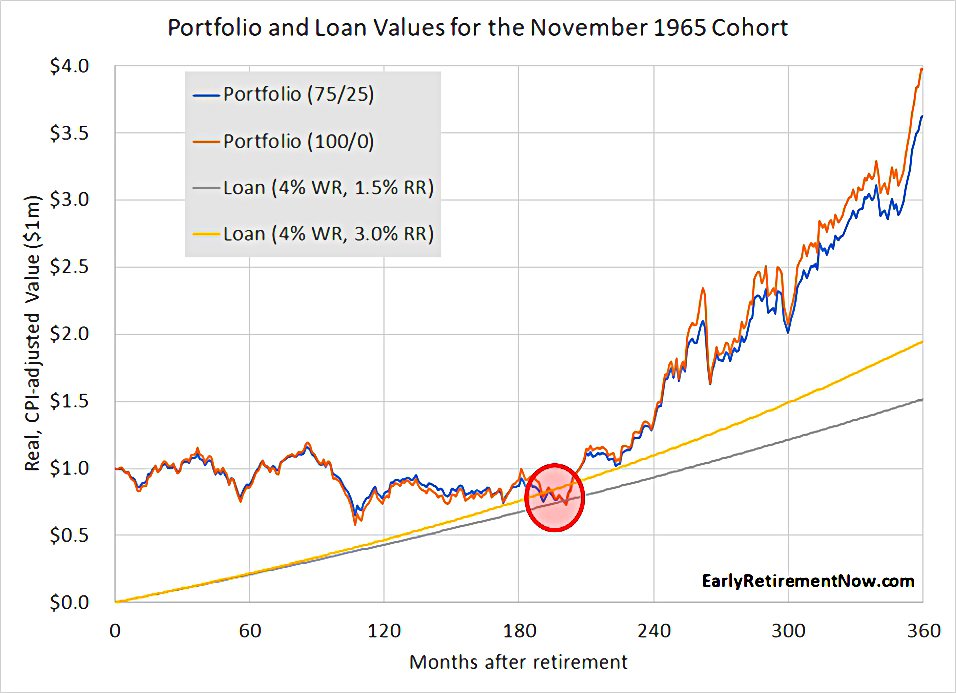
The chart shows the portfolio values for 100% equities and 75/25 from 1965-1995.
- It also shows the size of the required loan for a 1.5% and 3% real interest rate.
The base rate averaged 2.1% above CPI from 1965 to 1995, so ERN thinks that 3% is the realistic rate and that 0% would have been impossible to obtain.
The loan works out fine over 30 years (360 months), but runs into a problem at around 190 months, even with a 1.5% interest rate.
You would have wiped out your portfolio and run out of money after only 15 years. The subsequent recovery of the portfolio during the 1980s stock market rally is irrelevant.
This is why people are scared of margin.
1929 cohort
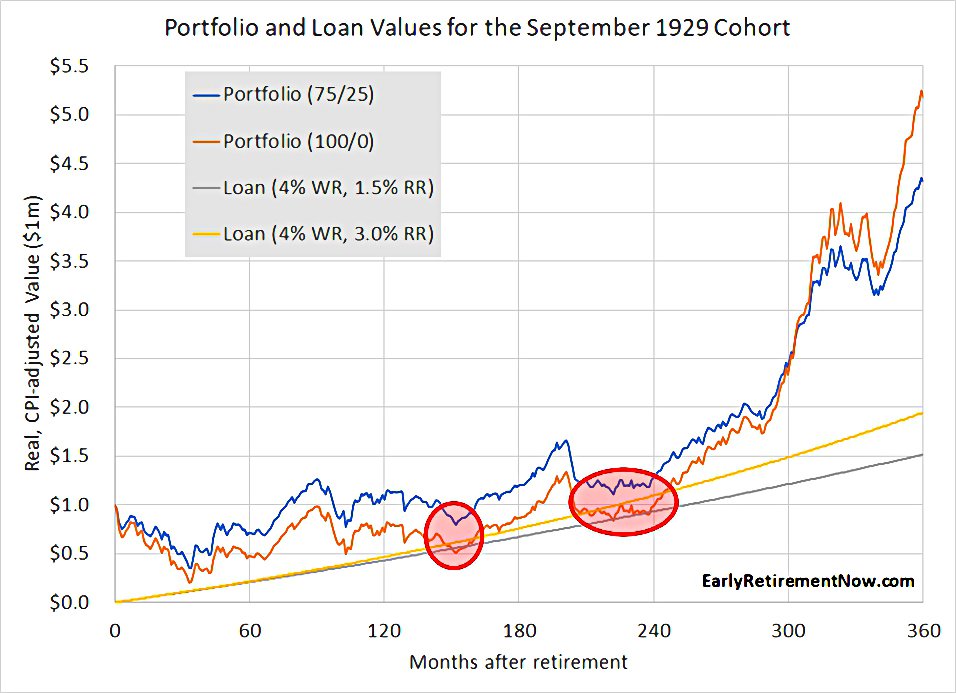
The 1929 cohort, which ran into the stock market crash of the Great Depression, does a little better, but not well enough.
- The 100% stocks portfolio is wiped out after 12 years, but the 75/25 portfolio appears to survive in nominal terms.
In month 238 the $1,085,000 loan was covered by a 1,185,000 portfolio. Your net worth was only $100k – down 90% and utterly insufficient to support a $1m+ margin loan. Another margin call blowup.
50% loans
ERN’s conclusion is that a 100% loan (for all your retirement spending) is too risky.
- For the next analysis, he assumes $20K of withdrawals pa (a 2% SWR on the initial $1M portfolio).
The other $20K pa ($1.667K per month) needed to support a 4% lifestyle will be borrowed as before.
- We might call this 50% leverage in retirement.
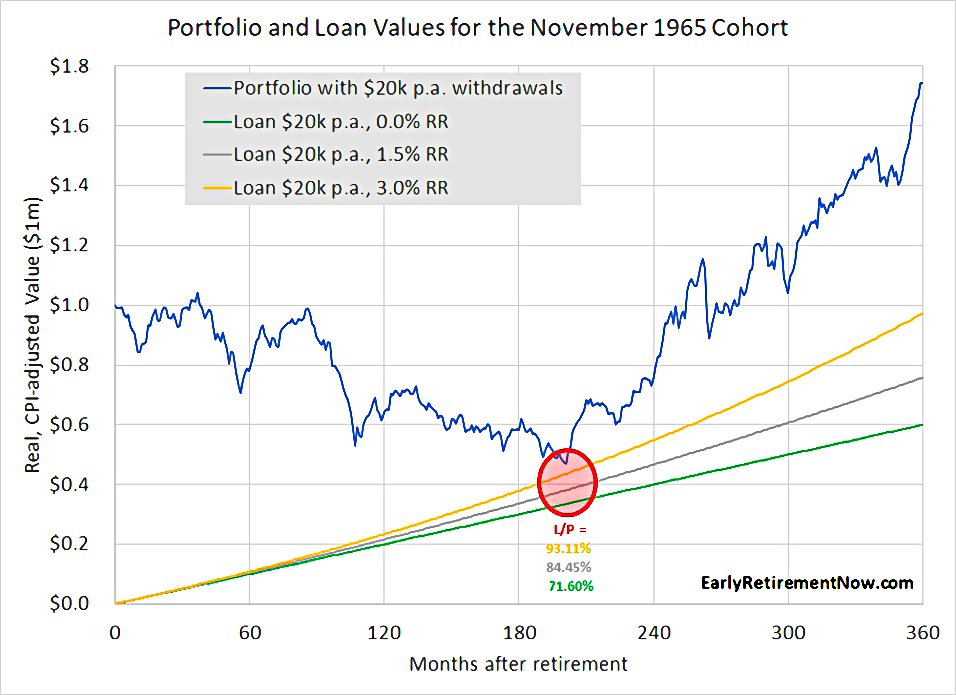
Things are still tight because the withdrawals mean that the portfolio doesn’t grow so much.
201 months into retirement and at the bottom of the 1982 recession, the loan-to-portfolio ratios were 93%, 84%, and just under 72% for the three alternative interest rate assumptions. That would have likely triggered a margin call in all but the most optimistic 0.0% real margin interest assumption.
Which as we noted above, is unrealistic.
25% loans
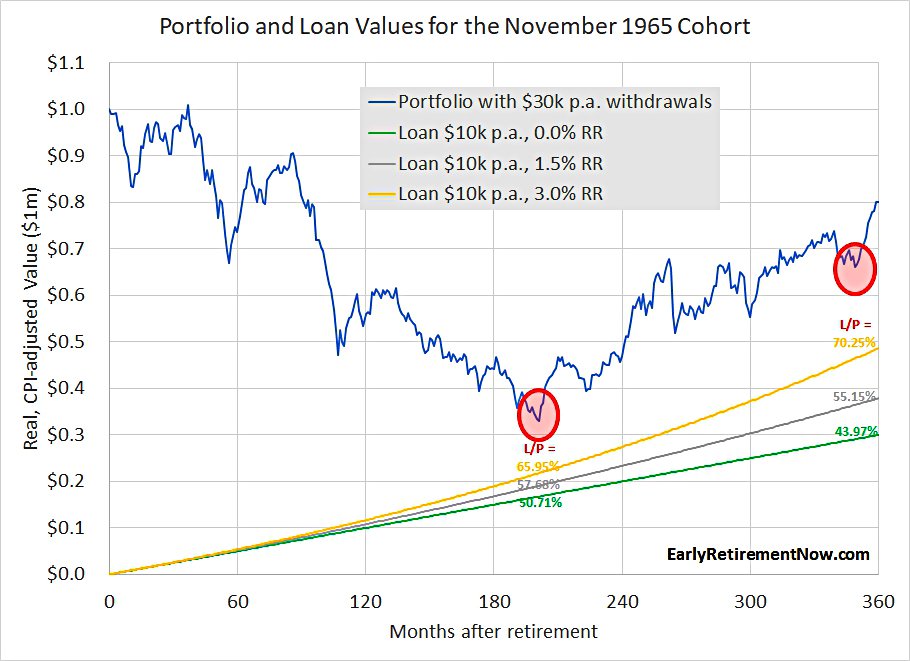
When we withdraw $30K pa and borrow the remaining $10K, things improve:
Even with a 3% annual real interest rate, the loan to portfolio value always stays at 70% and below.
A second “near miss” is added in 1994 (around month 350) for the Mexican Peso crisis.
- But the real test of nerve remains at 17 years in, when you don’t know that the stocks market rally of the 1980s is coming to save you.

The 1929 cohort also now survives.
ERN concludes that only the very rich can fund their retirement entirely through leverage.
Using excess leverage in retirement will likely exacerbate Sequence Risk unless you are so rich that, say, a ~1% initial draw rate is all you need to live comfortably.
ERN reckons this is a strategy for “9-figure net worth households” ($100M) but I guess that depends on what you call comfortable.
- At the time of writing in the UK, lots of people are comfortable on a £50K income, which is a 1% SWR on a £5M pot.
But ERN concedes that the 25% loan warrants further investigation.
Timing leverage
SWR 52, published in March 2022, looks at timing your use of leverage in retirement.
For example, borrow only when the stock market is down “far enough” and use withdrawals from the portfolio otherwise. And if the market is doing well again, potentially pay back the loan again!
New interest rates
Since the first post, ERN decided to change the interest rates he used.
If you want to borrow on margin, your broker will likely not quote you a rate as “x% over CPI inflation” but, more likely “x% over the Federal Funds Rate (FFR).
A HELOC (Home Equity loan, or Equity Release) is priced at or just below the Prime Rate, which is 3% above FFR.
- M1 Finance charges between 2% and 3.5% above FFR
- IBKR charges 1% for medium-sized loans (to $1M) and 1.5% for small loans
- A box spread options trade provides leverage at potentially less than 0.5% above T-bill rates (( This is a technique covered by ERN in a post from December 2021, which I will write about in a future article ))
So ERN re-runs the calculations for the 75% loan for the 1965 cohort using the following interest rates:
- 1.5% above CPI
- FFR + 0.5% (box spread)
- FFR + 1.25% (IBKR)
- FFR + 2.75% (HELOC)
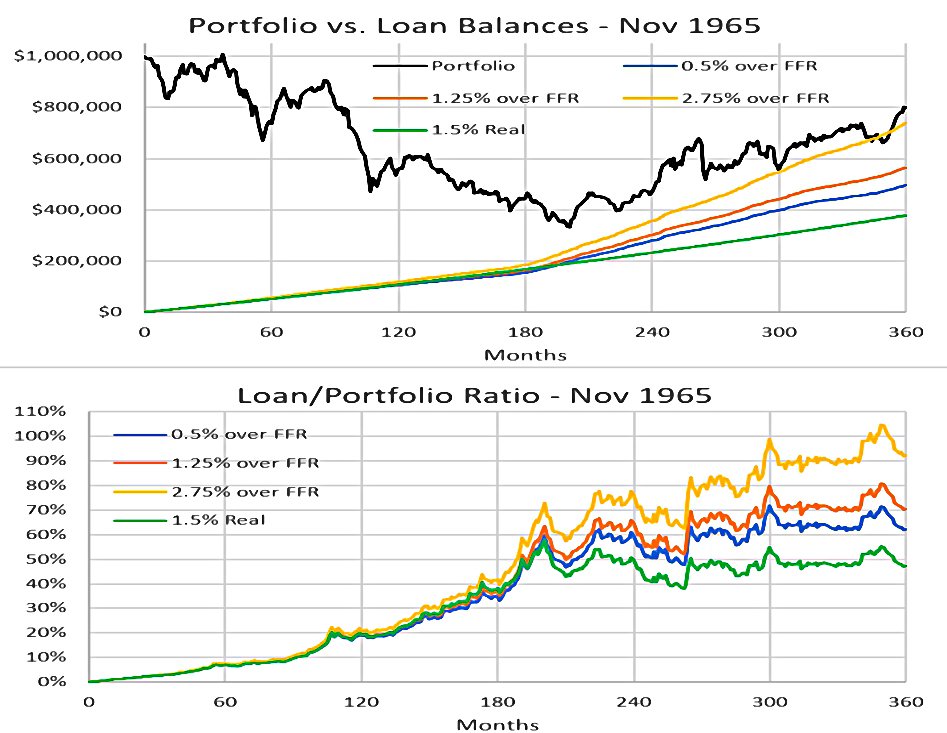
The new rates are much worse than the old ones during this timespan.
Inflation-adjusted short-term rates were much higher during the crazy 70s and early-80s than I previously assumed!
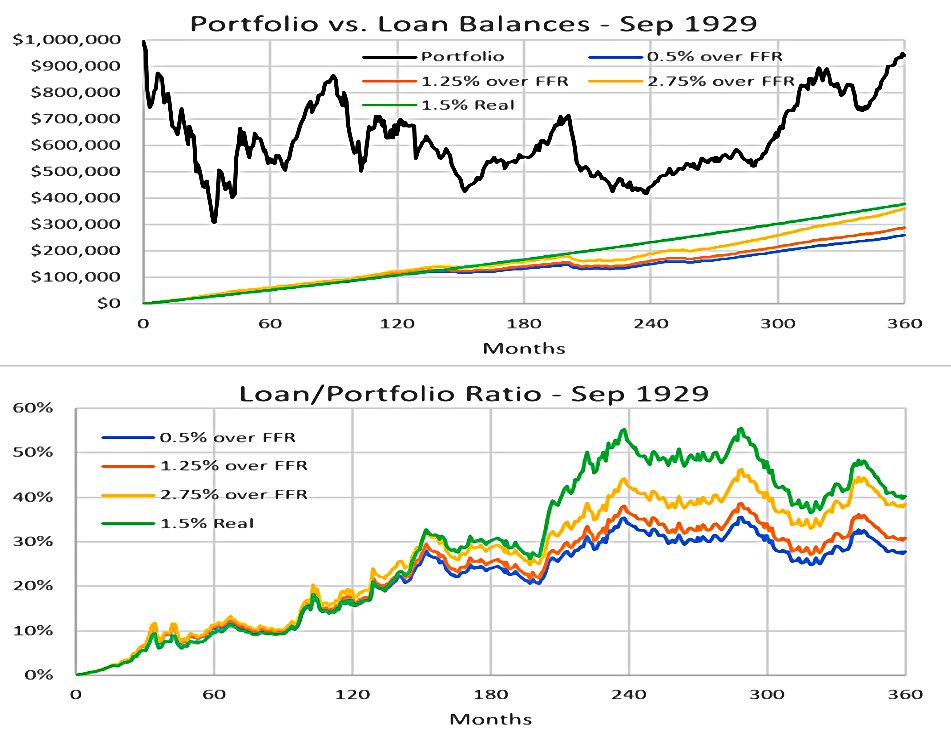
We get the opposite effect for the 1929 cohort.
The realized short-term real rates were quite low during the Great Depression.
ERN decides to look in more detail at the 1965 cohort that has the most to gain from timing its leverage.
4% SWR & 25% loan
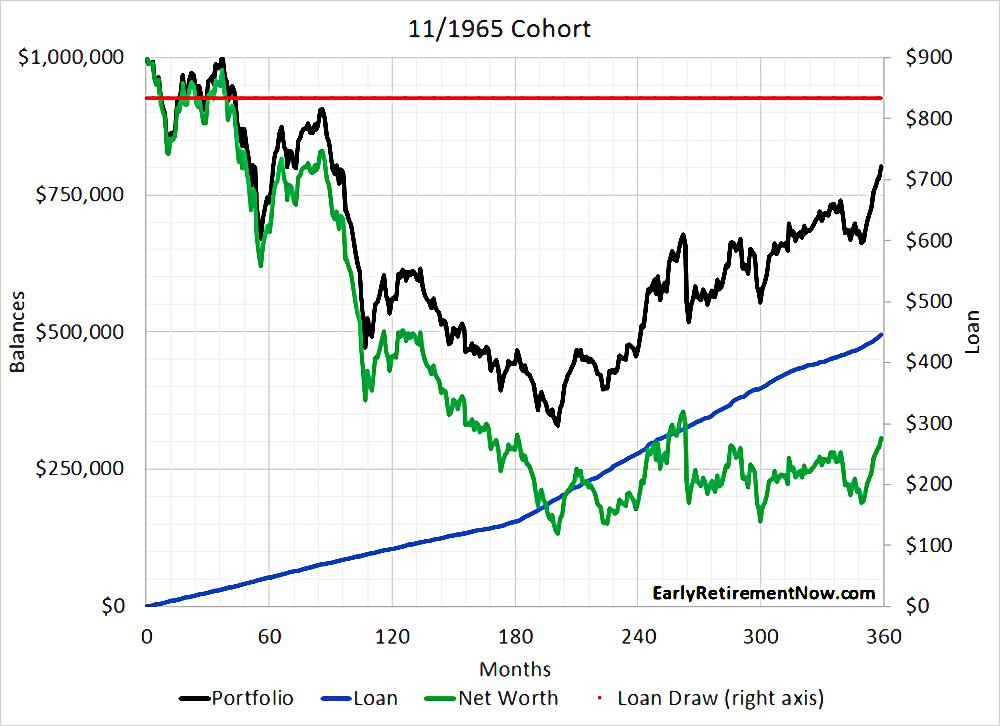
The base scenario (no timing) appears to survive but has a maximum loan to value of 7.23%, which might have led to margin calls.
I simulated this only at a monthly frequency, and daily and intra-day fluctuations would have easily pushed you beyond your margin constraints [assumed to be 75% max].
3.78% SWR & 2X leverage
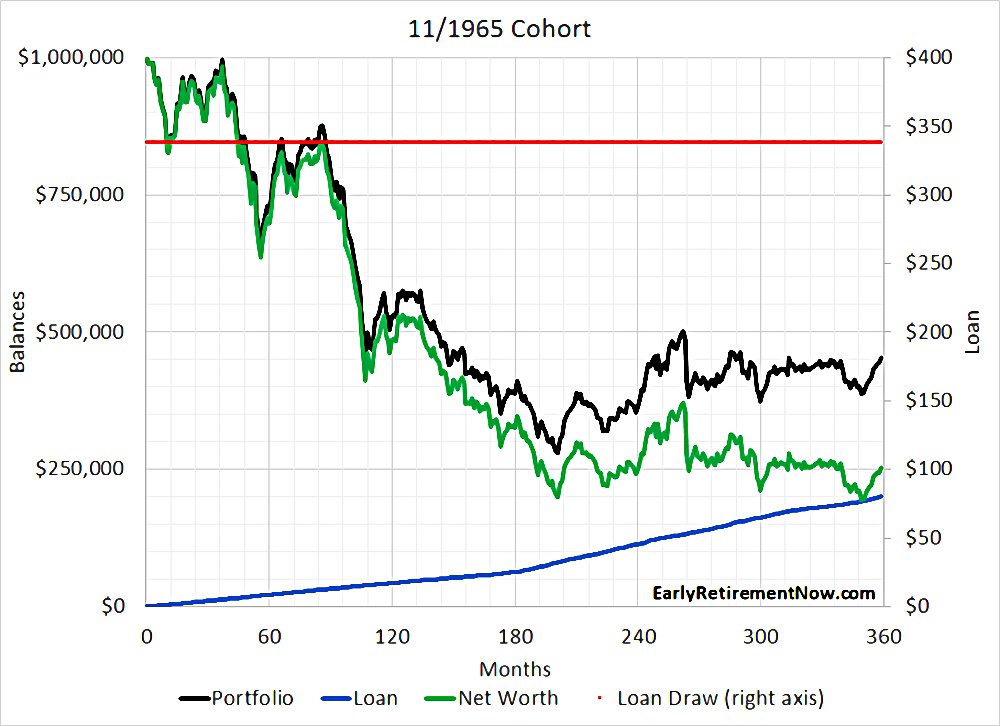
ERN’s next step is to work out how much he needs to reduce the loan and/or the SWR to make things work.
- With a terminal $250K “safety cushion” after 30 years, a 75/25 portfolio leads to a 3.58% SWR (my own 3.25% SWR uses a 100% terminal value, or $1M in this example).
Using a maximum LTV of 50% (2X leverage), this increases to 3.78% pa.
- The loan works out at 10.8% of the portfolio.
Timing
The next step is timing, using the distance of the S&P 500 below the all-time high.
- 20% is the drawdown target, to begin with.
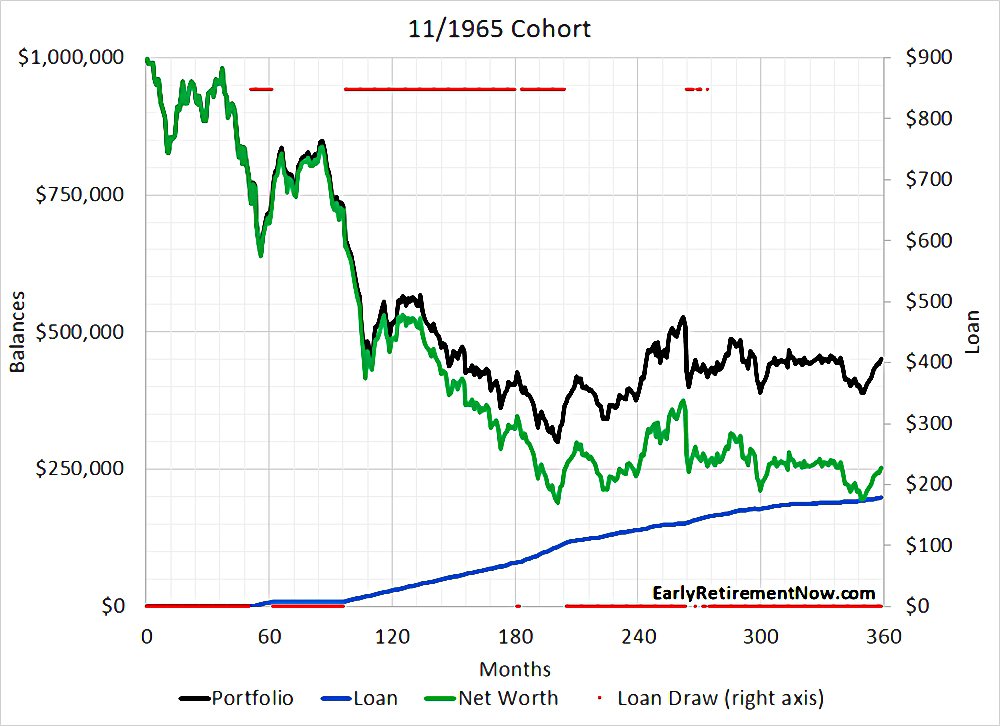
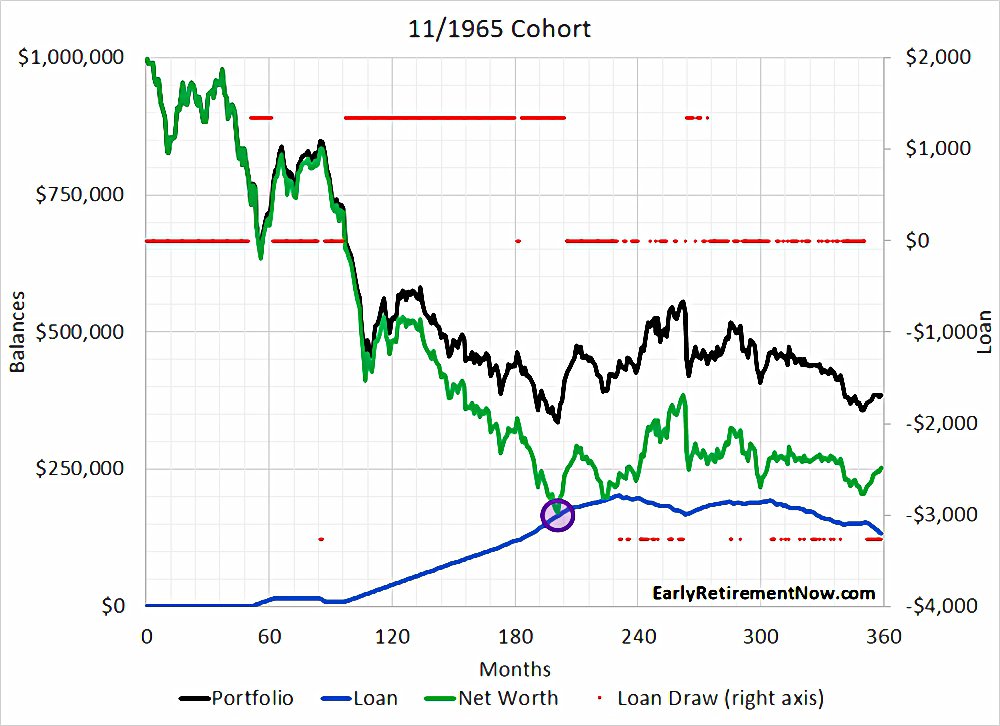
This is the same chart as before, but with the red line split between top and bottom to show when the loan is active.
- Now the SWR is 3.84% and the loan is 26.5% of the portfolio.
Out of the 360 months of retirement, we’d use the margin loan “only” 125 times. Also notice that we easily spot the time when the margin loan constraint binds: When the blue line touches the green line we’d have loan+net worth=portfolio, and thus loan=0.5*portfolio, i.e., exactly 2x leverage.
Pay the loan back
The next step is to add a rule to pay back the loan when the stock market hits a new all-time high (in the total return index).
- The mechanism to do this is to double the cash withdrawals from the portfolio and use half to pay down the loan.
This raises the SWR to 3.91% and the loan becomes responsible for 41.1% of withdrawals.
We still draw the margin loan during 125 months but we also pay back the loan for a few months in 1972, and then again starting in 1985, for a total of 47 months. Notice that the maximum margin constraint is now binding in 1982 again.
The red line (loan payments) now has three levels – taking money out, paying money in, and no action.
More simulations
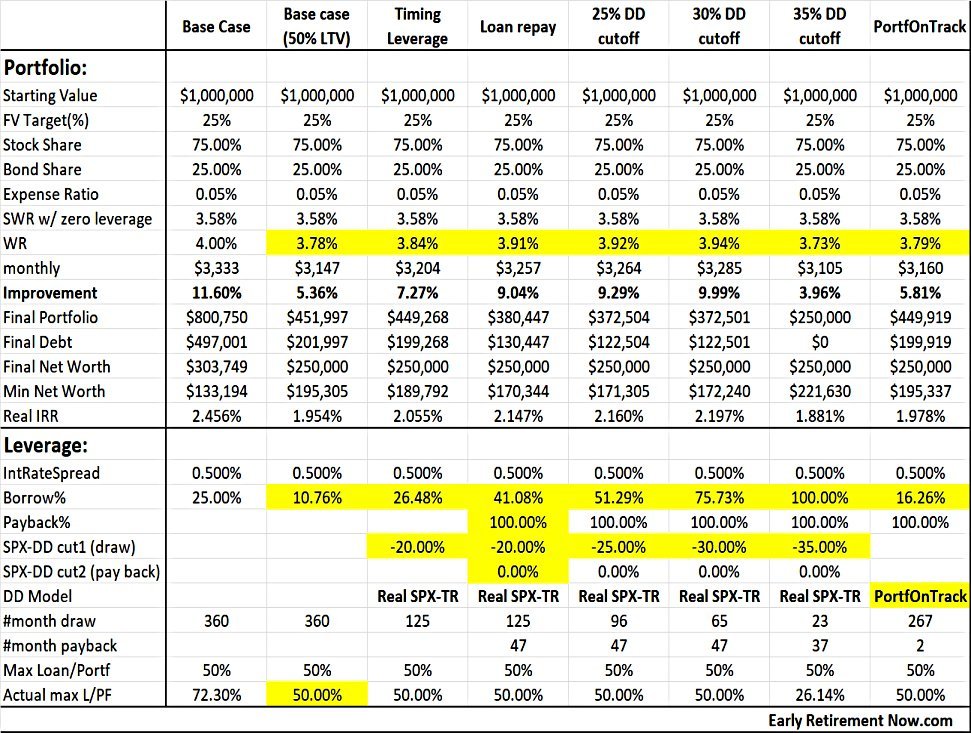
We can push the safe withdrawal rates even a little bit higher if we move to a 30% cutoff [stockmarket drawdown], but at 35% there is a huge deterioration again. Having to wait until the market drops by 35% appears to be too restrictive, at least during the 1970s.
The higher interest rates from IBKR and HELOCs make the strategy less attractive.
The withdrawal rates for the 25% drawdown timing mechanism go from 3.92% to 3.87% and 3.75% when raising the loan spread rate from 0.5% to 1.25% and then to 2.75%, respectively.
1929 cohort

For the 1929 cohort, the margin loan makes a big difference.
- The baseline SWR was 3.61%, but even without timing the loan, you can get to 4.39% using 31.9% of loan payments.
Using timing (with a 35% drawdown) the SWR increases to 4.93%.
Conclusions
The main thing I’m taking away from this interesting analysis is that a little bit of leverage is helpful, even in retirement.
- Most of my wealth is tied up in tax shelters and accounts that I won’t be able to take out a margin loan against.
I have spread-bet accounts, and I’m looking into leveraged ETFs and options (including ERN’s box spread leverage).
- But I already have negative leverage from my SIPPs, and I’m too old and have too low an income to take out big property loans.
So I might struggle to get my net leverage above 5% or 10%.
- But perhaps that might be enough to help.
ERN reckons that if you use the 25% drawdown timing rule, you can safely replace 50% of your retirement budget with a loan.
Note that you wouldn’t use leverage too often:
Under the leverage timing rules studied here, you would use leverage only during the 2002-2003 or 2007-2009-style market meltdowns, not the garden-variety volatility we’ve seen post-2009.
He also notes that margin worked well in the 1930s but not the 1970s.
- Low real interest rates are what help, not the headline inflation rate.
Until next time.
Mike Rawson
Mike is the owner of 7 Circles, and a private investor living in London. He has been managing his own money for 40 years, with some success.