HFEA 2 – Long-Term Leveraged ETFs

Today’s post looks at the Long Term Behaviour of Leveraged ETFs.
Contents
Long-Term Leveraged ETFs
Today’s article is the second in a series investigating the use of leverage in portfolios.
The majority view on the internet is that leveraged ETFs are not suitable for long-term buy and hold (as required by the HFEA strategy we looked at last time).
Here are a few articles for you to check out:
- Leveraged ETFs – should investors avoid them? (Hargreaves Lansdown)
- Why I’d steer clear of leveraged ETFs (Investors Chronicle)
- The risks of holding leveraged ETFs for more than one day (interactive investor)
- Leveraged ETFs? No Thanks (Larry Swedroe on The Evidence-Based Investor)
But the double-digit numerics website has a post from a few years back that busts this myth.
- There’s also a longer version of the article presented as an academic working paper, which was published in 2010.
It’s called Alpha Generation and Risk Smoothing using Managed Volatility, by Tony Cooper.
The myth
The myth arises from the following equality:
(1 + x) * (1 - x) = 1 - x2
Most of the worked examples of leveraged ETF “failure” show the market moving down by x on one day, then up by x on the next.
- If x is 5%, then after two days the market is at (1+5%) * (1-5%) which works out at 0.9975 ( a loss of 0.25%).
Since x2 is always a positive number, any amount of volatility appears to make us lose money.
- This is often called volatility drag.
The bigger the volatility, the larger the drag, so leveraged ETFs will multiply the volatility and increase the drag.
- You might have spotted the first flaw in the logic – even if the leverage is 1 (ie. a straightforward index tracker), volatility ought to lead to losses.
And yet we know that an unleveraged index fund is safe to hold forever.
- This is because the underlying market has positive returns.
Long term returns
Long-term returns from leverage would also seem to disprove the myth.
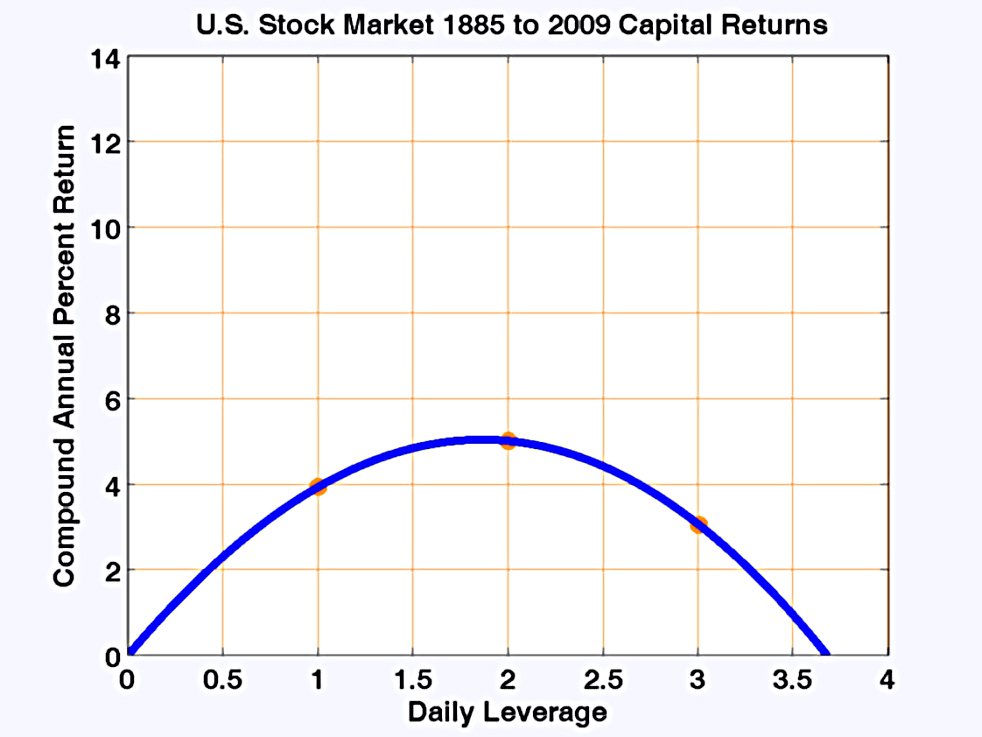
- The chart shows returns (dividends not reinvested) from the US market between 1885 and 2009.
It’s true that the 3x leverage produces lower returns than 1x (the index), but 2x leverage produces higher returns.
- The reason for this is that the positive return from the stock market compensates for volatility drag – up to a point.
Since the return is a multiple of leverage and the drag a multiple of the leverage squared then eventually the drag overwhelms the extra return obtained through leverage. So there is a limit to the amount of leverage that can be used.
The real formula
The real formula (presented in the academic paper) is fairly complicated.
It involves terms containing the skewness and kurtosis of the benchmark. It does not assume that benchmark returns are Gaussian or that returns are continuous as do formulae derived using Ito’s lemma.
Tony provides an approximation for low levels of leverage (up to about 3):
R = kμ - ½k2σ2/(1 + kμ)
R is the compound daily growth rate of the ETF, k is the ETF leverage, μ is the mean daily return of the benchmark, and σ is the daily volatility (i.e. standard deviation) of the daily return.
The first term is the leveraged return and the second is the volatility drag.
Since k2σ2 is always positive and (1 + kμ) is always close to 1 then the volatility drag is always positive.
Since the equation is quadratic and the square term is negative, the resulting curve is always a parabola with a maximum at k = μ/σ2 (as in the first chart).

This chart plots R versus μ and σ (all annualised).
- Red is good (high returns) and blue is bad (low returns).
For a given Daily Return as you move horizontally rightwards on the chart in the direction of increasing Daily Volatility the return R becomes more blue.
This chart will come in useful later.
Optimum leverage
Optimum leverage will depend on the returns and volatility (which we cannot know in advance.
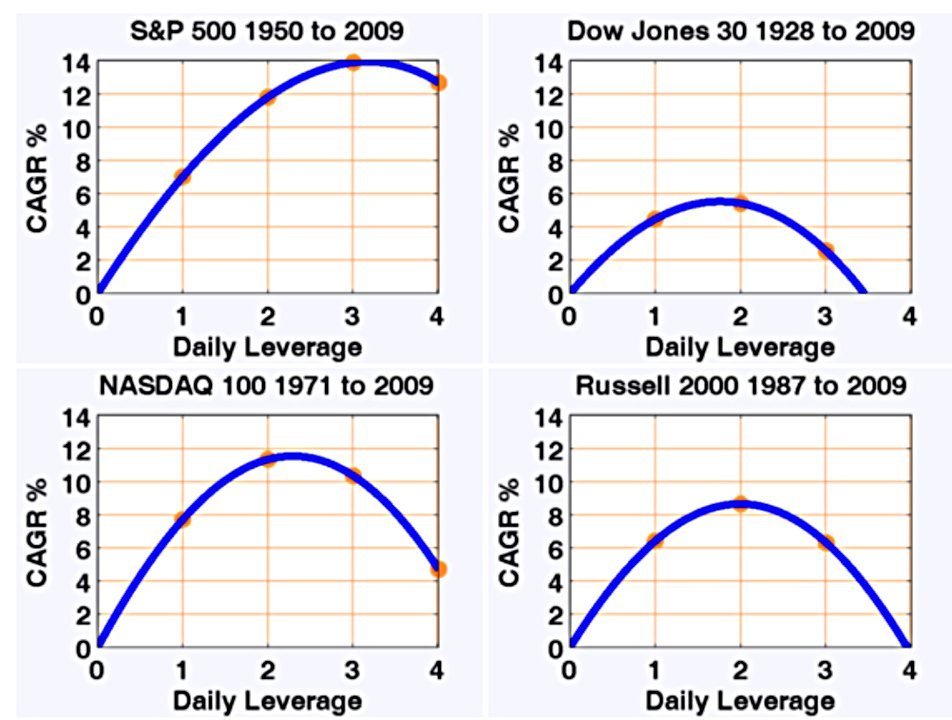
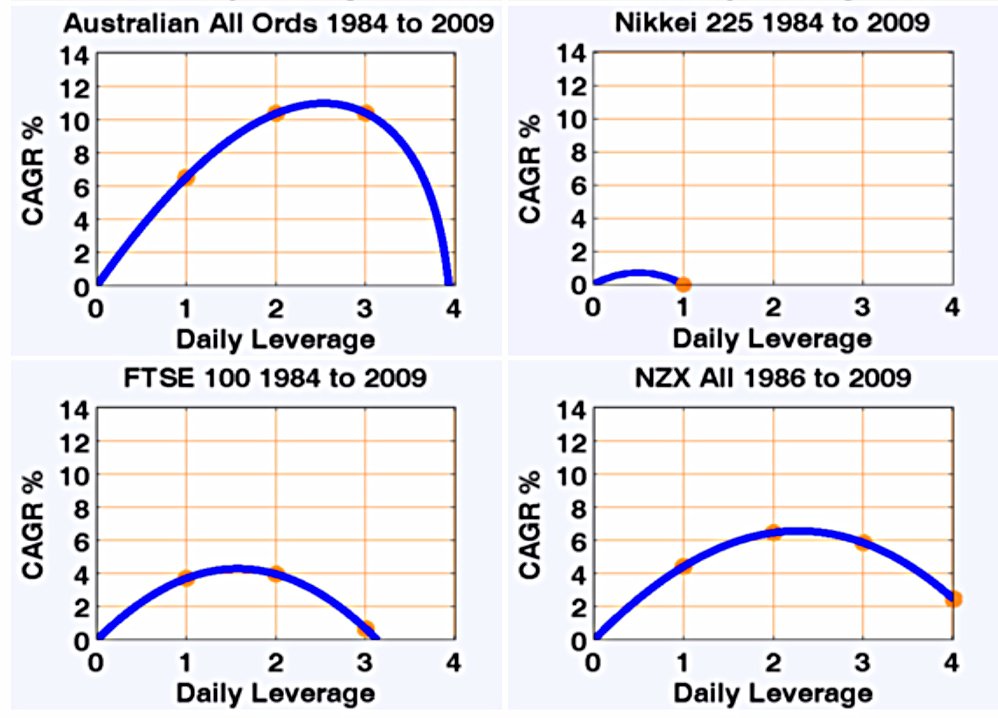
- Tony presents charts for various markets and timeframes.
Optimum leverage is most often in the 2 to 3 range, though sometimes it is below 2.
- Japan between 1986 and 2009, it is below 1 (but perhaps returns were negative there).
Tony also plots these return curves as straight lines on the contour map we saw earlier.

Over various markets over various time periods the optimal leverage is about 2.
Fees
The other issue with holding leveraged ETFs is the fees.
![]()
Leveraged ETFs are usually more expensive than the unleveraged type, and the gap was likely even larger when Tony was writing his article.
- So we need to consider fee drag as well as volatility drag.
There is also the tracking error to think about – ETFs won’t exactly match their benchmarks every day.
[Tracking] errors are serially correlated – if the ETF is a little short of the mark one day then it tends to exceed the mark over the next one or two days. In general the tracking error adds extra volatility to the ETF and there is a volatility drag that results. But the effect on the returns is small compared to the fees.
So Tony focuses on the fees.
- The chart above adds a 0.95% fee to produce the dotted line (fees are lower today).
The long-term (135 years) curve still peaks at 2, but the peak is now at the same CAGR as the unleveraged ETF, so the benefits of leverage have been lost.
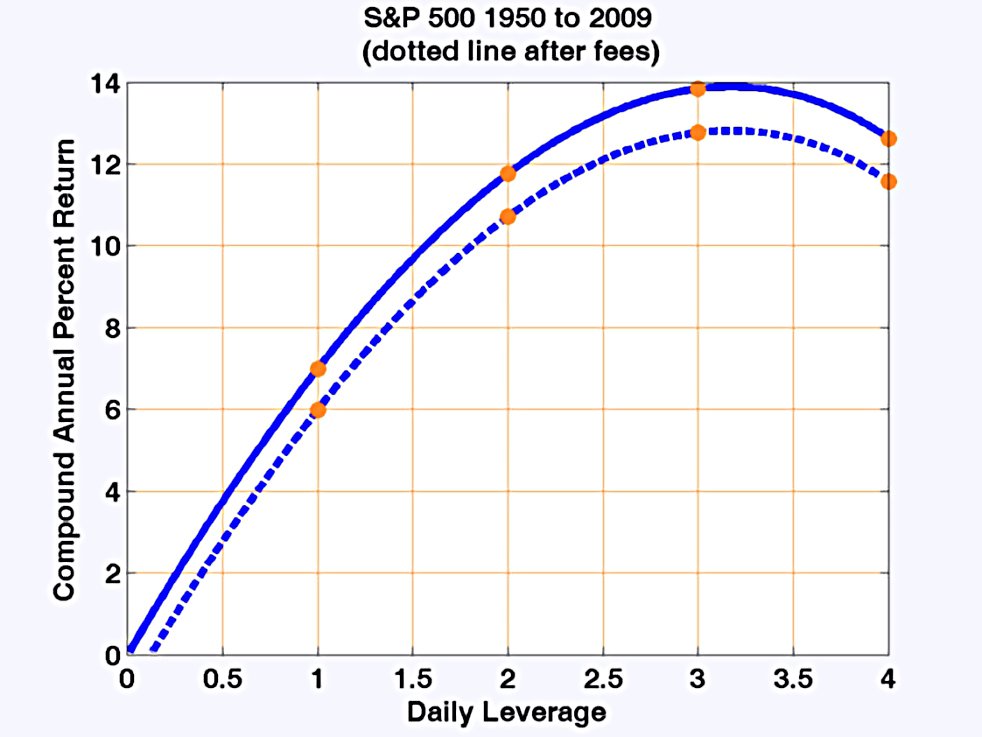
Luckily, over shorter time periods, adding leverage still works.
Conclusions
Tony concludes:
Leveraged ETFs can be held long term provided the market has enough return to overcome volatility drag. It usually does. For most markets in recent times the optimal leverage is about 2. But some markets and time frames will reward a leverage of up to 3. No markets will reward a leverage of 4.
Even if the optimum leverage for the future is “only” 1.5, applying a mix of 2x and 3x leverage to a subset of my portfolio will not raise my overall leverage to 50%.
- For example, allocating 10% to leverage of 2.5 would only result in 15% leverage for the overall portfolio.
So I feel confident that I can continue my investigation of HFEA strategies.
- Until next time.
Mike Rawson
Mike is the owner of 7 Circles, and a private investor living in London. He has been managing his own money for 40 years, with some success.


Hi Mike. Your equality should have a plus sign in one of the parentheses: (1 + x) * (1 – x) = 1 – x2. Would have pvt. msg.’d you, but don’t see a link on the page.
Thanks for the spot – fixed now.
My email address is in the left sidebar.