HFEA 4 – Long-Term Leveraged ETFs again

Today’s post is another in our series on Leveraged ETFs.
Contents
Long-Term Investing in 3X ETFs
Today’s paper is called “Long-Term Investing in Triple Leveraged Exchange Traded Funds” and it was written by Lewis Glenn in 2020.
- Lewis is a Founding Partner of Creative Solutions Associates, a private investment and wealth management group.
Before that, he was the Computational Physics Group Leader in the Earth Sciences Division at the Lawrence Livermore National Laboratory.
I don’t know anything else about Lewis, but he seems to have come up with a similar approach to HFEA without having read HedgeFundie’s post. (( At least, Lewis’s paper makes no reference to HFEA ))
- His starting point is that triple leveraged ETFs that track the Nasdaq, the S&P 500 and the Dow have outperformed their underlying over the medium term (10+ years), but this has been achieved along with high volatility and large drawdowns that retail investors are unlikely to tolerate.
Lewis proposes mixing the leveraged Nasdaq ETF (TQQQ) with the leveraged bond ETF (TMF) and using bi-monthly rebalancing to achieve a 50:50 mix.
- This portfolio shows a 45% CAGR over 10+ years and has a maximum drawdown of less than 25%.
The problem with leveraged ETFs
The paper begins by covering the flaw in holding leveraged ETFs for the long-term – he calls this beta slippage, but we’ve previously referred to it as volatility decay.
A fund’s effective long-term leverage increases with the index cumulative return and decreases with the index standard deviation during bull markets but decreases with the absolute value of the index cumulative return and increases with the index standard deviation during bear markets.
More simply, low-volatility bull markets benefit from leverage and volatile and bear markets punish leverage.
- But as we saw in a previous post in the series, markets trend up and you will usually profit from leverage if you keep your costs low.
Lewis has some maths to explain this, but we don’t need those equations.
One important note to his analysis concerns drawdowns – he uses end of month numbers:
Any intra-month spikes that might be observed in daily draw downs are not present unless they persist to month’s end. Accordingly, monthly draw downs are generally smaller than daily draw downs.
Returns
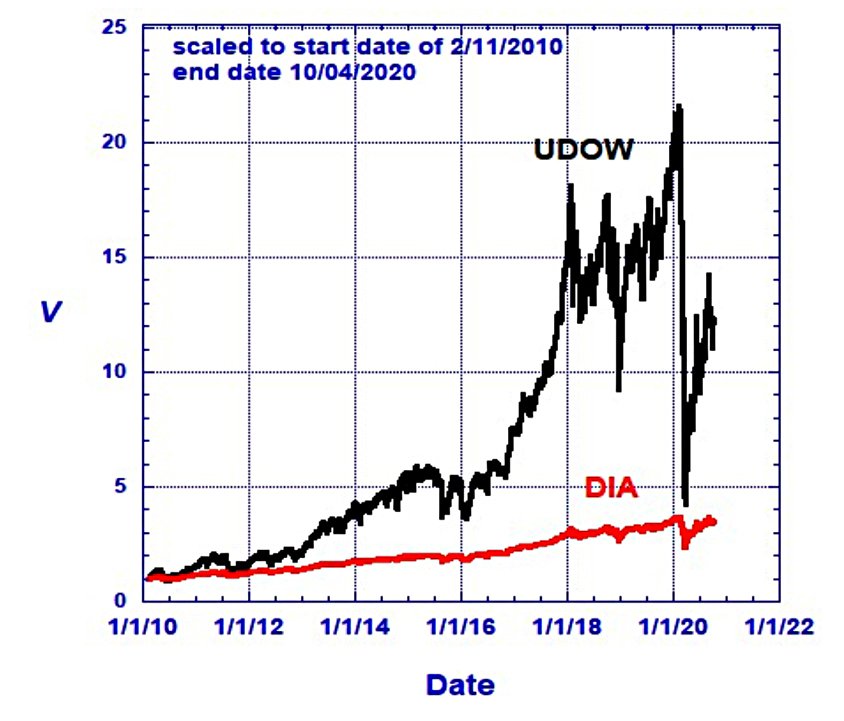
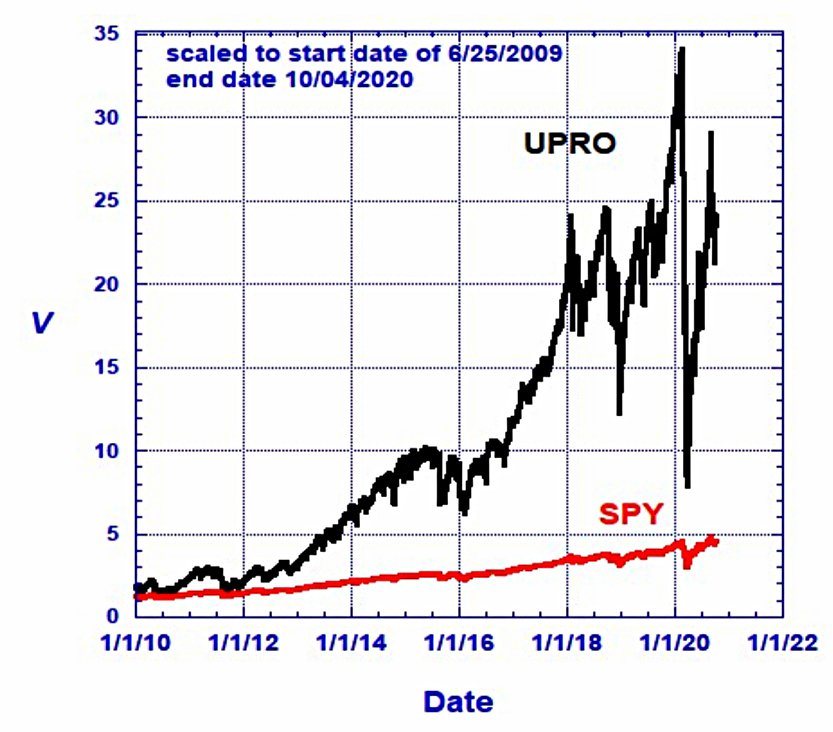
Let’s start with the US stock indices:
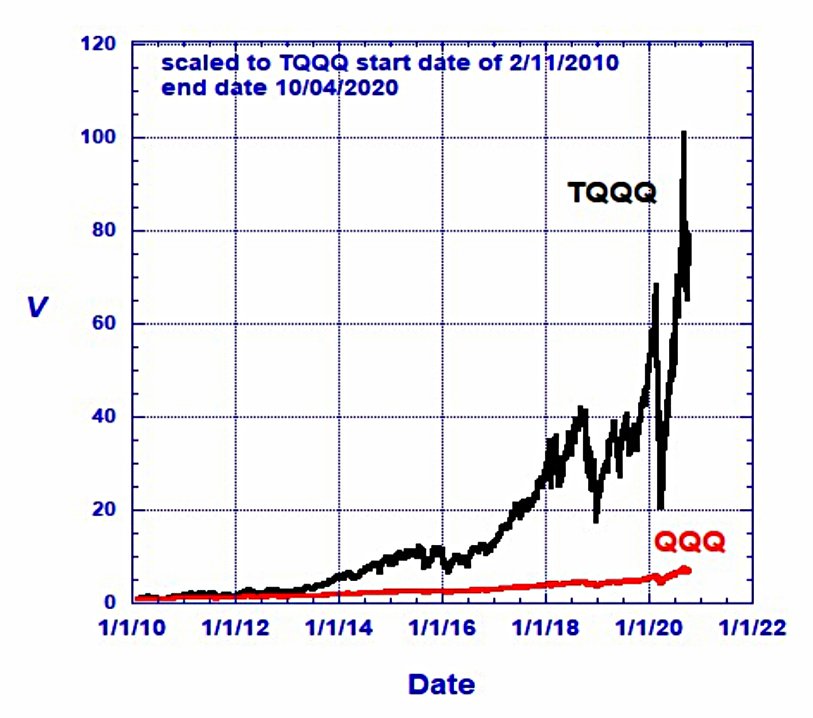
Lots of outperformance, but lots of volatility and very large drawdowns (particularly around the Covid crash).

The outperformance is not so impressive for the small-cap Russell 2000.
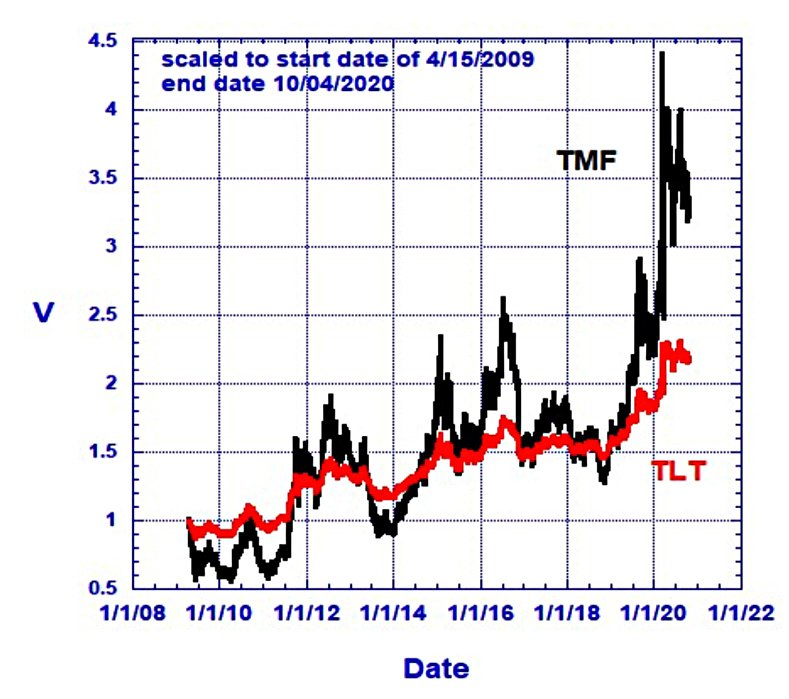
Bonds show even less outperformance, but as we’ll see later, the key point here is the lack of correlation with equities.

The relative performance of the leveraged non-US developed markets ETF is actually negative.
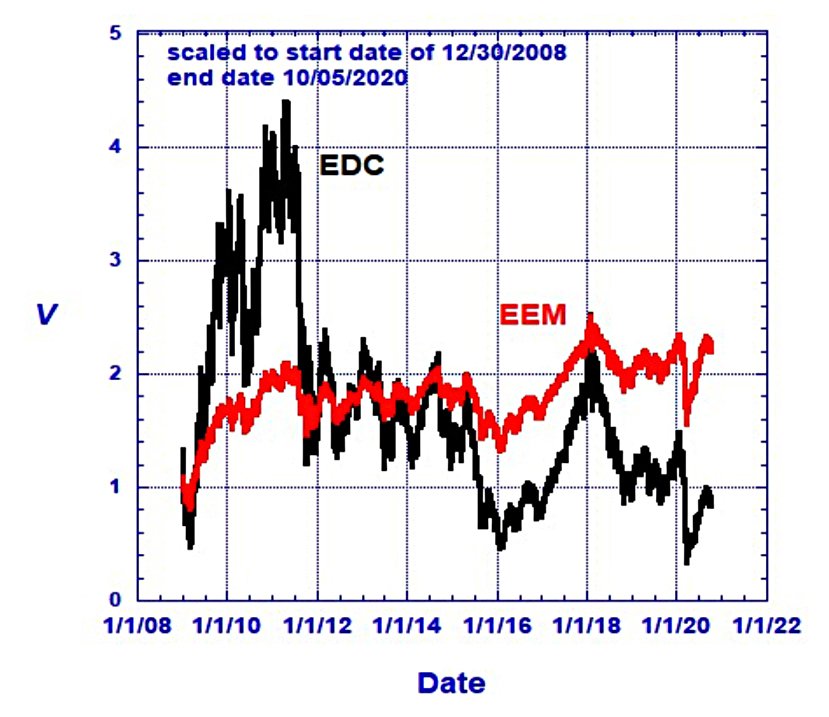
Leveraged emerging markets have also underperformed over the last decade.
Risk mitigation
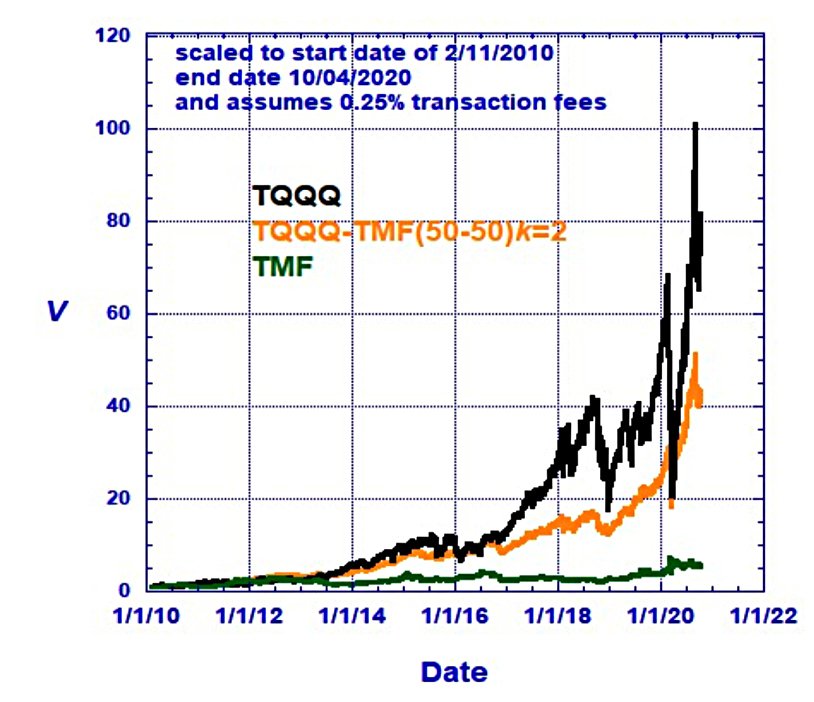
As described above, Lewis’ answer to all this volatility is to combine TQQQ and TMF in a 50:50 portfolio with rebalancing every two months.
- He uses a 0.25% transaction fee for each rebalancing, which also includes slippage.
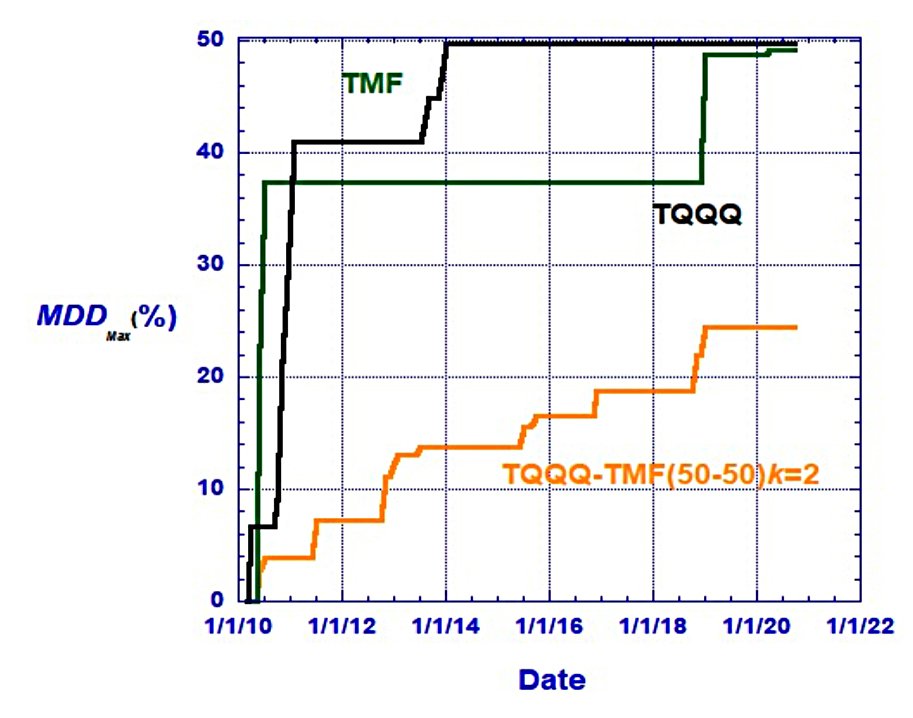
Drawdowns for this portfolio are around half of those for the individual ETFs.

This chart shows the performance of the strategy on 9th Feb 2020 (the peak for the portfolio) varies according to the rebalancing schedule (measured in months).
- Bi-monthly is best, but every month is fine too.
- Waiting three or more months to rebalance has a significant impact on the peak value.
Note also that transactions fees are not very impactful (because only a small proportion of the portfolio is rebalanced).
Black swans
Lewis notes that the max daily drawdown (DDD-max) is much larger than the max monthly drawdown (MDD-max – 42.2% versus 24.4%).
- Most of this difference comes from a 20% fall in TQQ on 9th March 2020 during the Covid panic.
To avoid investors selling out in such a situation, Lewis proposes an additional filter.
The basic idea is to switch the simple strategy to cash, or a near-cash substitute, whenever the daily return of TQQQ has dropped below a preset minimum. A return to the standard strategy is then only made when the daily adjusted close of TQQQ has returned to and exceeded the value it had when the switch was made.
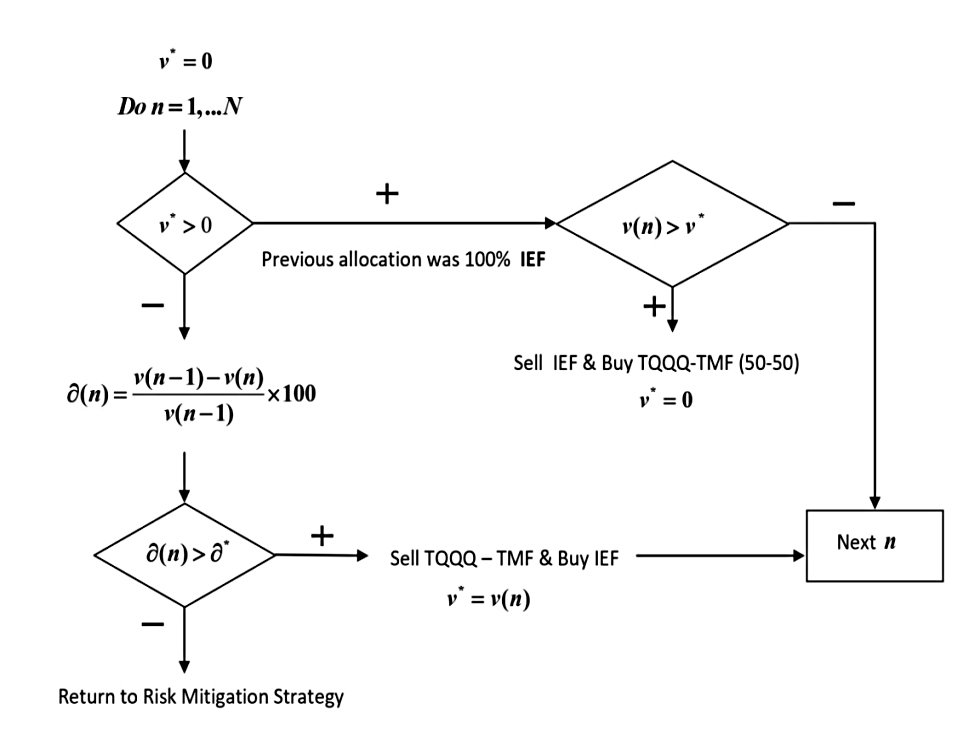
In practice, Lewis sets the filter to a max drawdown for TQQQ of 20%.
- IEF, the 7- to 10-year Treasury ETF is used as the cash substitute.
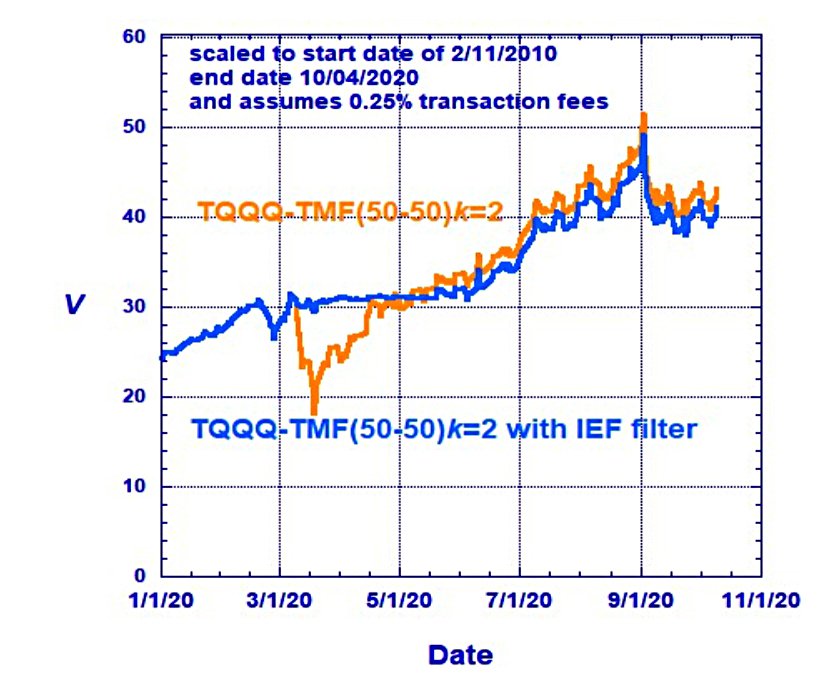
The filter avoids the big drawdown in March 2020 and doesn’t reengage TQQQ until May, resulting in a slight underperformance overall.
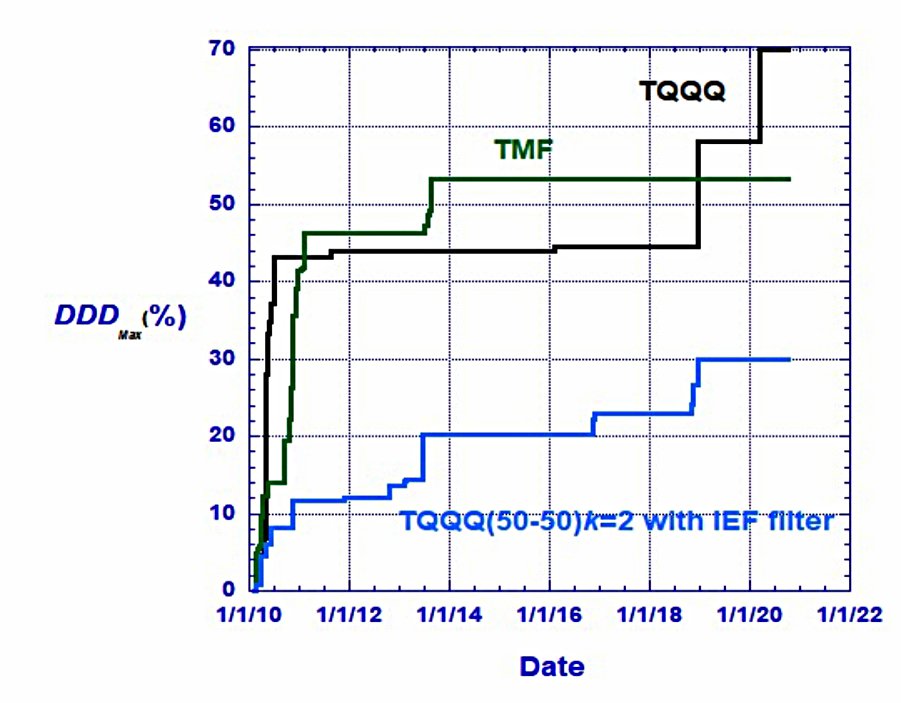
DDD-max for the filtered system is 30.0% compared to 42.3% for the unfiltered system.
- MDD-max remains at 24.5%.
Conclusions
It’s good to see another take on the HFEA approach, and more evidence that the outperformance from leveraged ETFs can be retained at the same time that the excessive volatility is reduced.
- Bi-monthly rebalancing works best for Lewis’ 50/50 strategy.
The alternative 55/45 HFEA with monthly rebalancing has also worked well.
- Lewis’s filter to cap drawdowns at 20% may be a step too far for me.
Lewis also notes that the same strategy can be applied to the S&P 500 and the Dow.
- I will likely use a mix of indices.
Until next time.
Mike Rawson
Mike is the owner of 7 Circles, and a private investor living in London. He has been managing his own money for 40 years, with some success.


Sorry, his strategy is terrible. It only avoided ONE drawdown in the entire lifetime of TQQQ. His crash filter moved you from TQQQ to TMF from 3/10/2020 to 5/18/2020. TMF went from 375.30 to 373.99, so essentially flat.
Being 50% in TMF reduced the maximum drawdown a little bit and the volatility a lot, but reduced the overall lifetime return by almost 90%. The $2,000,000 difference over 16 years buys a lot of Tums & sleeping pills.