Long Vol 2

Today’s post looks again at how Private Investors can best add a Long Vol (long volatility) component to their portfolios.
Contents
The story so far
Our interest in Long Vol comes from the long-term Dragon Portfolio described in “The Allegory of the Hawk and Serpent”, a paper we looked at back in March 2020.
- This portfolio allocates 18% to what is described as “active long volatility”.
The paper explains this as:
Buying out-of-the-money equity put options if the market is down -5% or more and purchasing out-of-the-money equity call options if the market is up +5% or more over any rolling three months.
Since few UK private investors trade options, I wanted to explore alternatives that might produce similar results.

Nicolas Rabener at Factor Research has produced seven notes in this area.
- Last time out we looked at three of them, on the topic of building a Log Vol strategy without using options (Nicolas uses FX pairs and bonds instead).
Nicolas’s approach involves an active approach to choosing instruments, but a passive version using say four types of government bonds and four types of currency pairs is likely to capture most of the effect.
- The portfolios lack the explosive response of hedge fund long vol strategies, but their improved Sharpes mean that they can be juiced with leverage.
Today we’ll look at the remaining four notes from Nicolas.
Anti-Fragile Portfolios
Note number four looks at anti-fragile portfolios.
Most investors are pretty much the same and their investment philosophy is relatively easy to grasp after a short conversation, whether they allocate capital to stocks, bonds, or real estate. They buy something because it is cheap, they follow trends, or invest in quality.
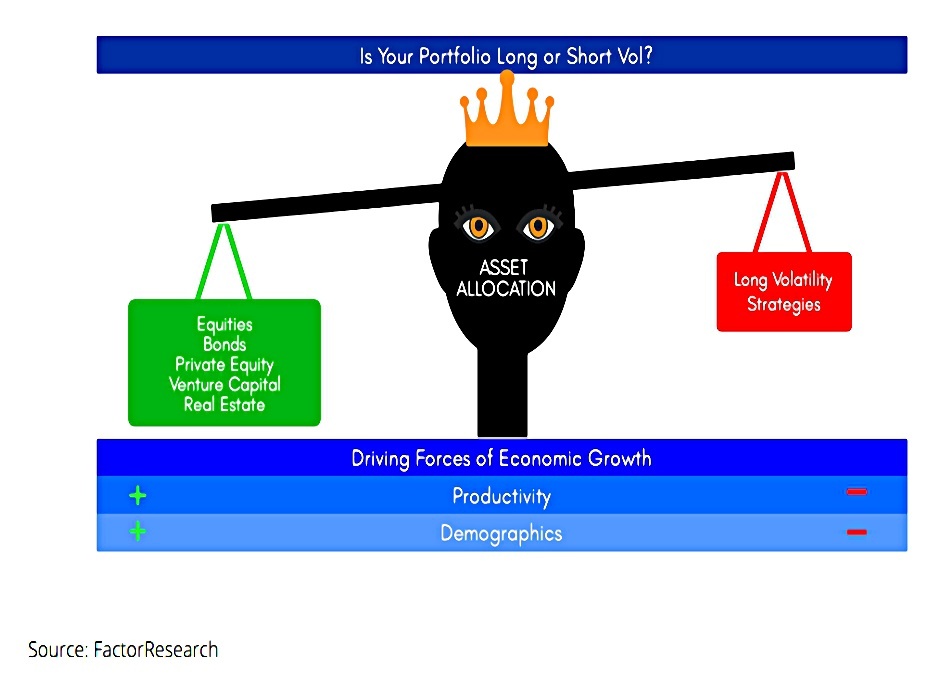
But not many investors know whether they are long or short volatility.
Most asset classes are bets on economic growth. Companies struggle to grow earnings when growth is declining and corporate and sovereign bond default rates rise.
Diversifiers like PE and real estate are similar, but with lagged and smoothed valuations.
- So standard portfolios are short vol.
As an aside, Nicolas looks at the prospects for
So, what drives economic growth? Broadly speaking, it’s the change in productivity and the working-age population.
Nicolas notes that the tech revolution of recent decades hasn’t led to large productivity gains.
- And population demographics (in the West and in China) are against us.
Japan is potentially the canary in the coal mine.
Long Vol
Nicolas rules out the majority of hedge funds as a long vol strategy:
Most hedge funds have either high correlations to equities (long-short equities), tend to fail in crises (merger arbitrage), provide little alpha over long time periods (equity market neutral), or are not hedged at all (distressed debt). And almost all are expensive.
Managed futures (trend followers) are better:
Managed futures have structurally low correlations to stocks and bonds, are supported by an abundance of academic research, and are available as low-cost mutual funds and exchange-traded funds (ETFs).
I think their availability as low-cost ETFs doesn’t stretch to the UK, unfortunately.
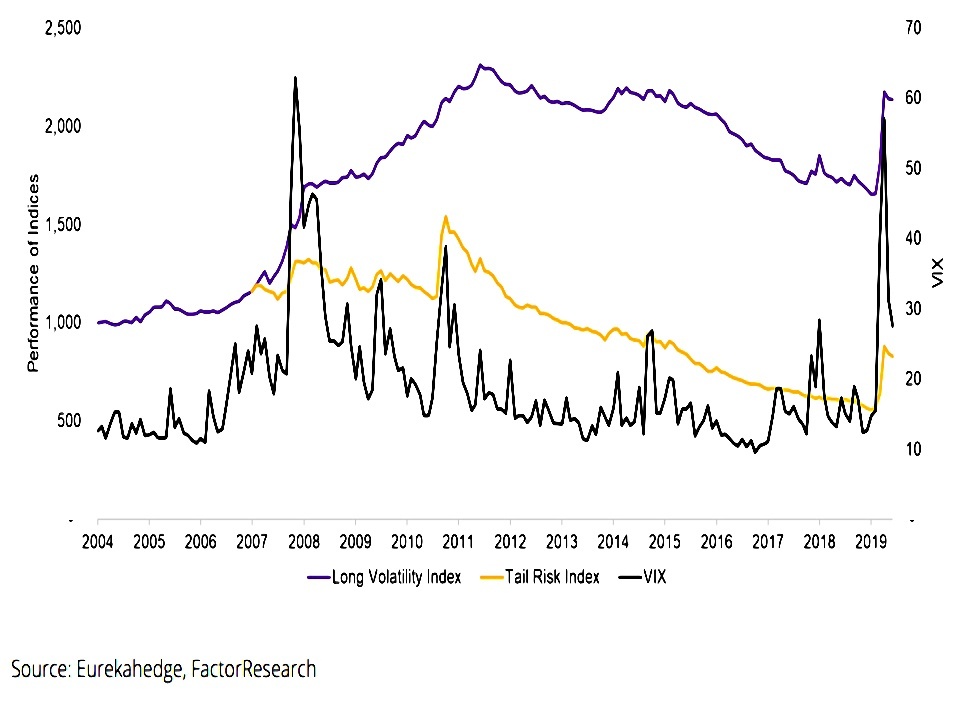
Nicolas compares Long Vol strategies with Tail Risk approaches, using the VIX for volatility.
Tail risk and long volatility funds generated high returns during the COVID-19 pandemic in 2020 and therefore delivered crisis alpha. But long volatility strategies did better amid the global financial crisis (GFC) in 2008 and the high-volatility years that followed.
So he focuses on Long Vol.
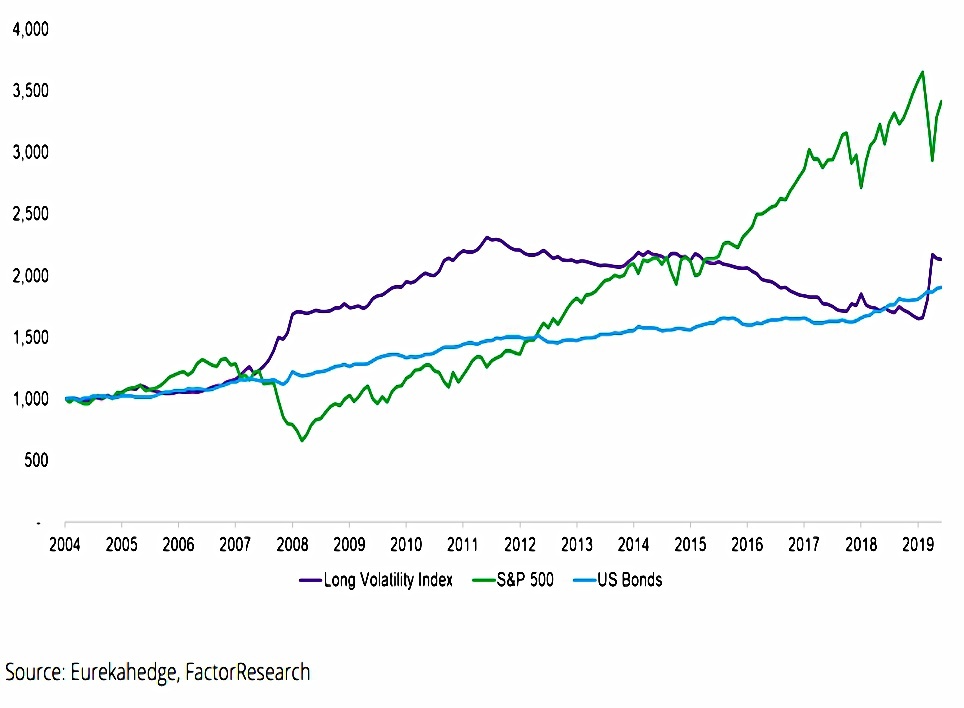
Their correlations to the S&P 500 and bonds were -0.32 and 0.26 between 2004 and 2020, respectively, and they delivered uncorrelated returns.
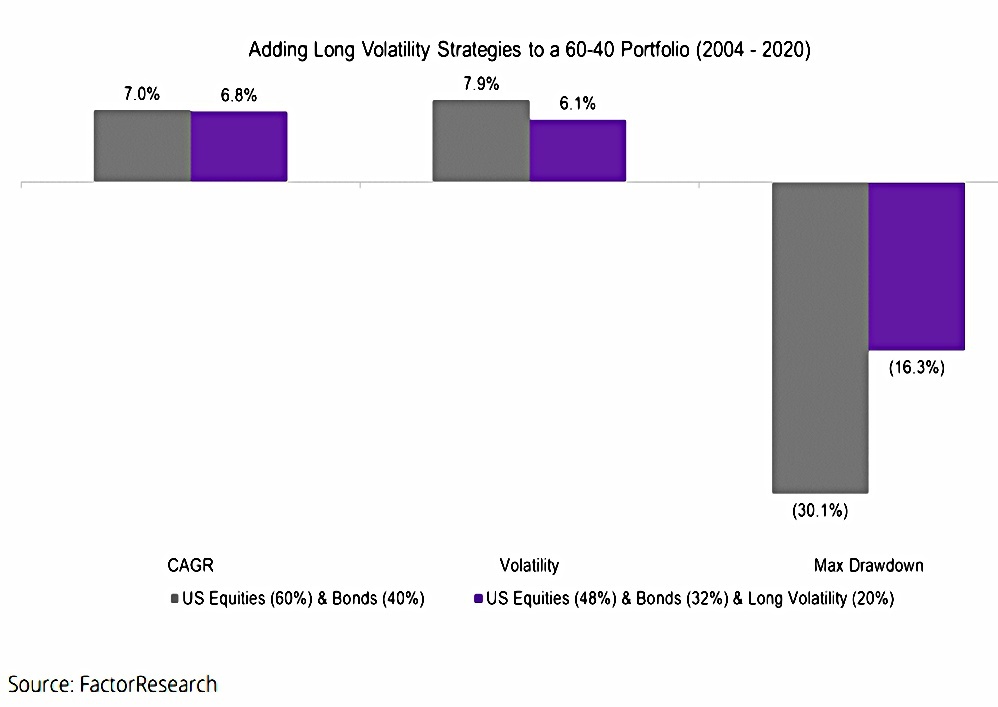
Although a 20% allocation to long volatility strategies slightly reduced the annual return of a 60-40 portfolio [from 2004 to 2020], volatility declined even further, therefore increasing the risk-adjusted returns. But the real benefit of a less-fragile portfolio is demonstrated by calculating the maximum drawdown, which decreased by almost 50%.
Next, Nicolas corrects for reporting bias.
Fund managers tend to start reporting their returns to databases when they’re doing well and stop when performance tails off. We can partially correct for this reporting bias by reducing the annual returns of long volatility strategies between 250 and 750 basis points (bps) per annum.
Although this reduces the performance of an antifragile portfolio, it does not change the significant reductions in maximum drawdowns.

Managed futures
Note number five looks at managed futures (also known as CTAs) and compares results from those which seek to exploit short-term trends with those from long-term trend followers.
- Short-term is defined as an average holding period of 10 days or less – my own trend following system averages 30 days.
For the avoidance of doubt, these do not represent tail hedge strategies that gain when equities lose and volatility spikes, but should generate returns unrelated to what happens on the stock market.
Short-term trend followers are often seen as offering better stock market crash
protection but Nicolas finds that the differences are marginal.

Managed futures are not popular.
- Their market share fell from 20% in 2012 to just 7% in 2020.
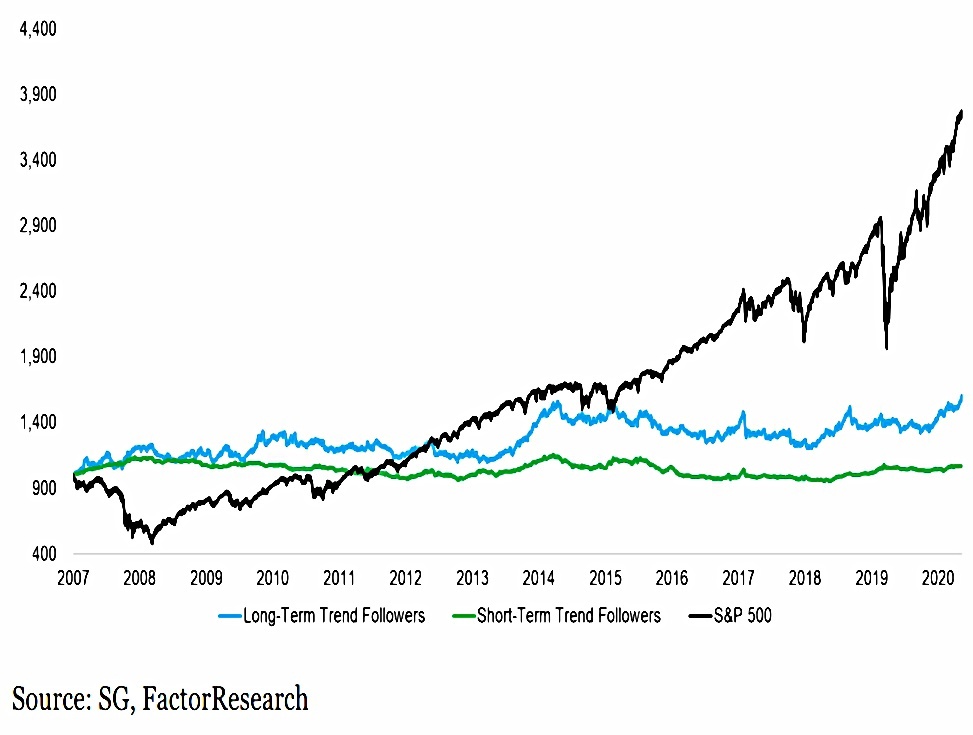
The short-term trend followers generated almost no returns over these 14 years [from 2007 to 2021], compared to a CAGR of 3.6% for the long-term ones. The volatility of the former was 50% lower than that of the latter.
The data
Nicolas looked at eight “crashes” (falls of more than 10%) in the S&P 500 between 2008 and 2020.
- On average, managed futures were not affected by stock crashes.
However, in the five stock market crashes between 2008 and 2016 trend followers gained when stocks lost. In the three crashes thereafter, managed futures strategies lost as well.
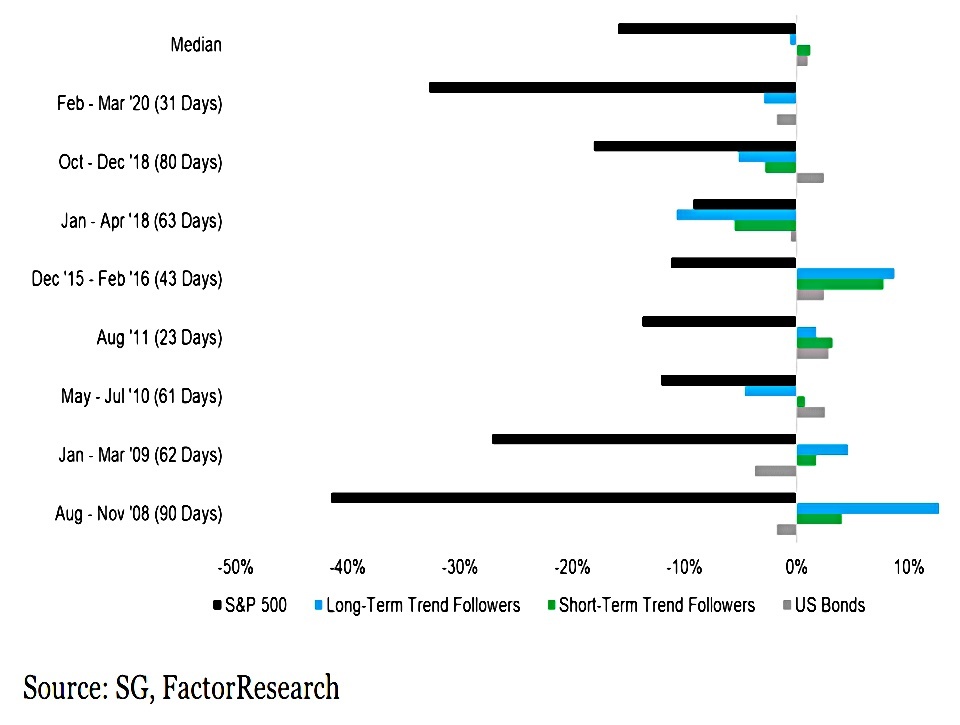
There wasn’t much difference between the short- and long-term trend followers.
Short-term traders have performed slightly better in recent years and it would be intuitive to attribute this to the aggressive behavior of the central banks that led to quick stock market recoveries. However, we need to recall that managed futures portfolios are comprised of many asset classes, not just equities.
Nicolas speculates that short term funds may have to overcome higher trading costs, and that there is a greater weight of money backing 12-month trends than 10-day trends.
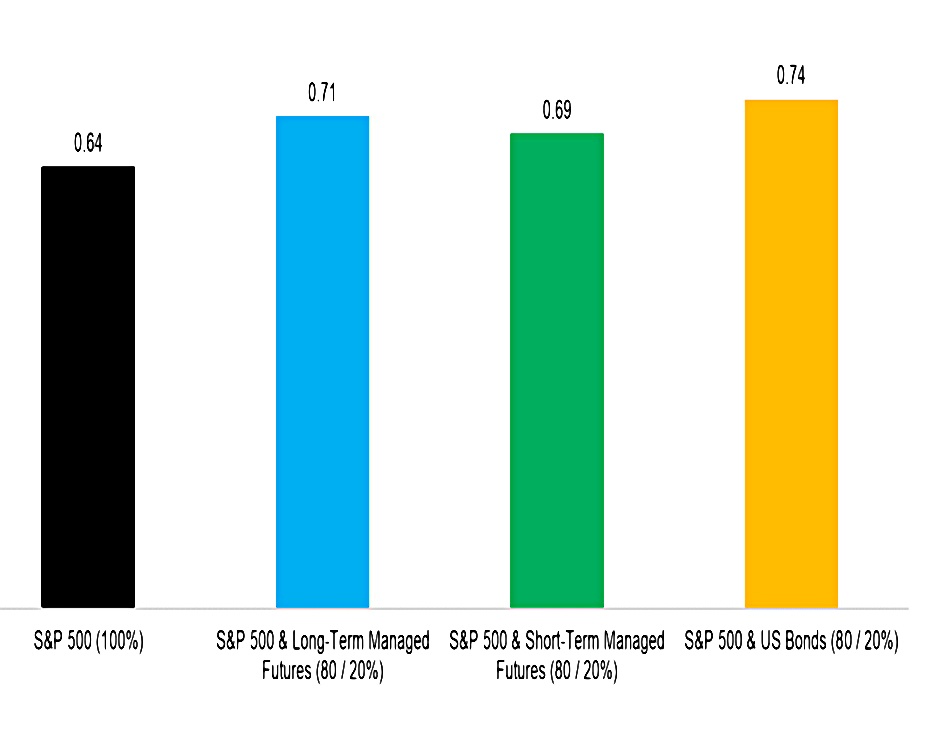
As usual, drawdowns were reduced and Sharpe ratios were increased.
- Bonds proved to be better diversifiers over the period in question, but whether this will be true in the future is another question.
Volatility Hedge Funds
Note number seven looks at volatility hedge funds.
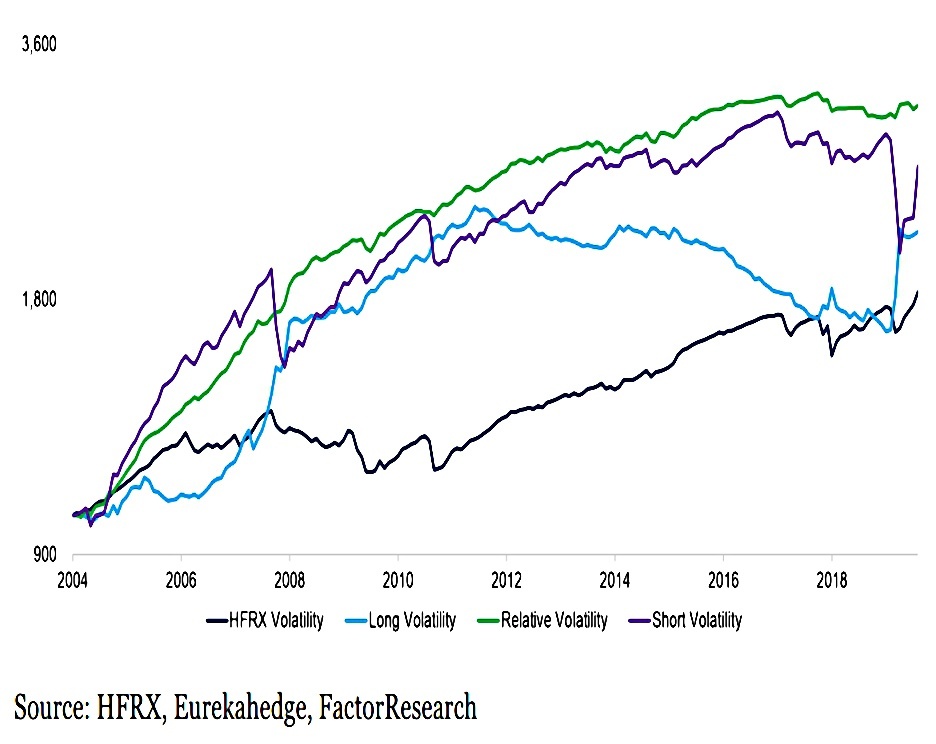
These generated positive returns in the period between 2004 and 2020, and even beat the S&P 500 on a risk-adjusted basis. Specifically, the Relative Volatility index had a risk-return ratio of above 2 and a maximum drawdown of 6.5%.

The short vol funds had the highest correlation to the S&P 500, as might be expected.
- Long vol funds were best for diversification, but their correlation is now strongly negative, which is not helpful (reducing exposure via cash or shorting the index would be simpler).
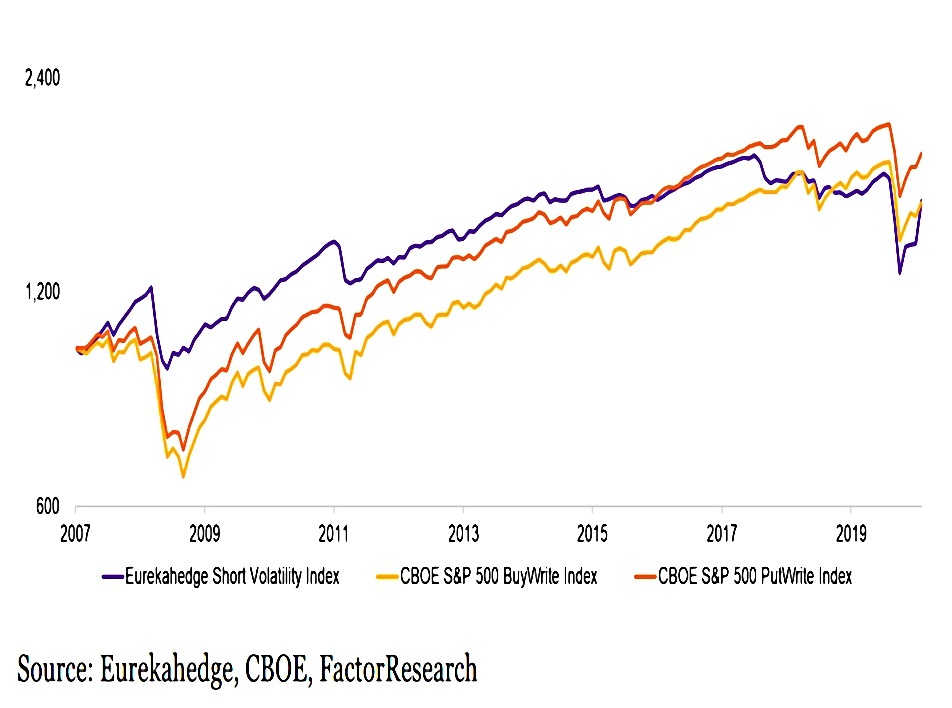
Nicolas notes that short vol funds can be replicated using buy-write and put-write index strategies, which are now available in the US via ETFs.
Adding hedge funds
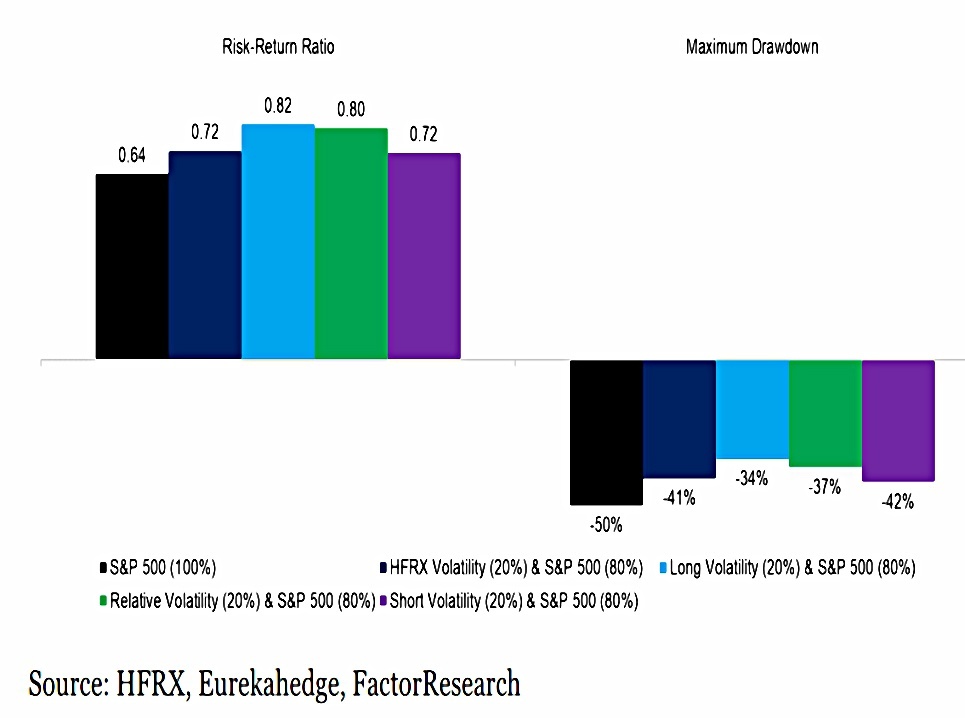
Adding a 20% allocation to any type of volatility strategy improved risk-return ratios and reduced max drawdowns.
Hedge vs DIY
Since hedge funds are expensive and usually have minimum investments beyond the reach of most private investors, note number seven looks again at DIY strategies designed to achieve the same benefits.
- This takes us back to the data from our previous article, where Nicolas looked at the correlations of 59 asset classes (indices) with the VIX.
The resulting portfolio was primarily comprised of risk-off currencies, eg USD/CAD, and government bonds.

Hedge fund long vol produced higher returns overall, but both approaches spiked when the stock market crashed.
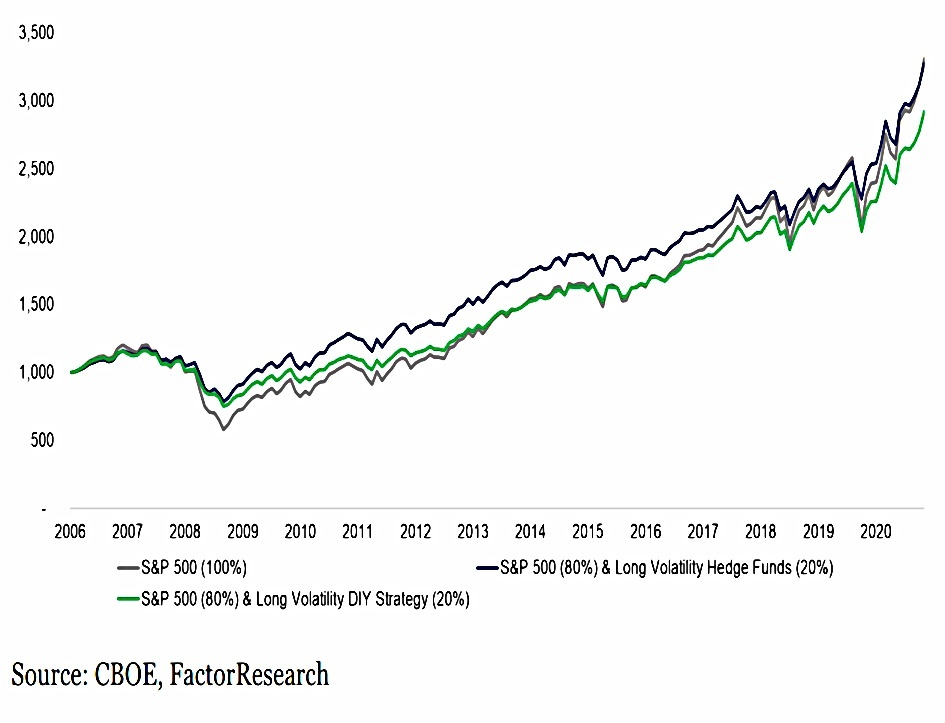
Allocating to long volatility hedge funds would have generated almost the same return as being 100% invested in the S&P 500 since 2006, while the DIY index would have resulted in a slightly lower return.
Both additions reduced max drawdowns from 52% for the S&P to 34% for the hedge funds and 36% for DIY long vol.
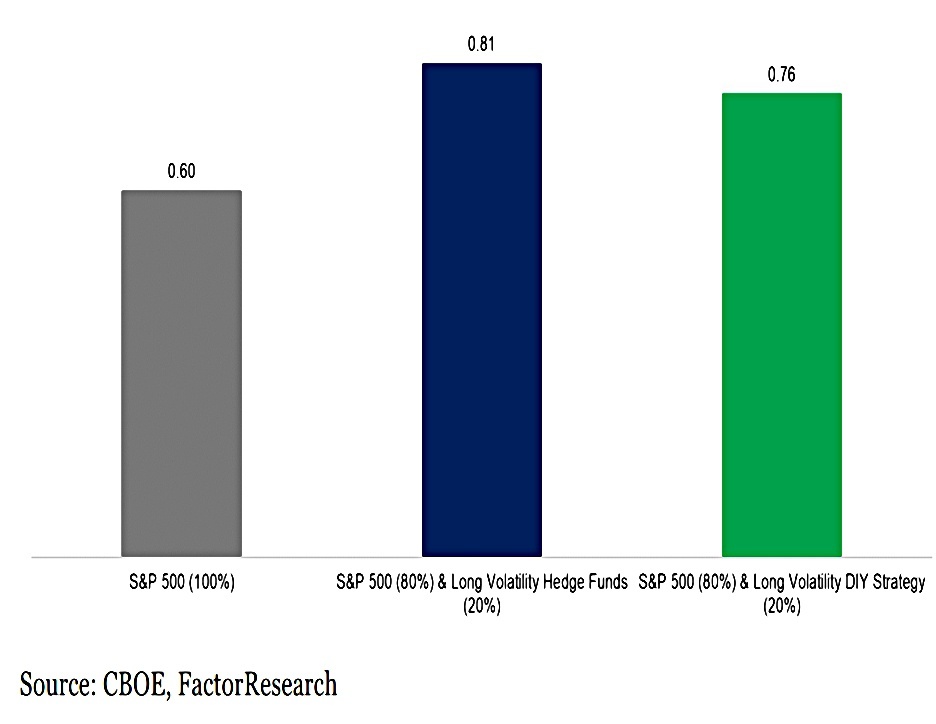
And both improved the Sharpe ratio.
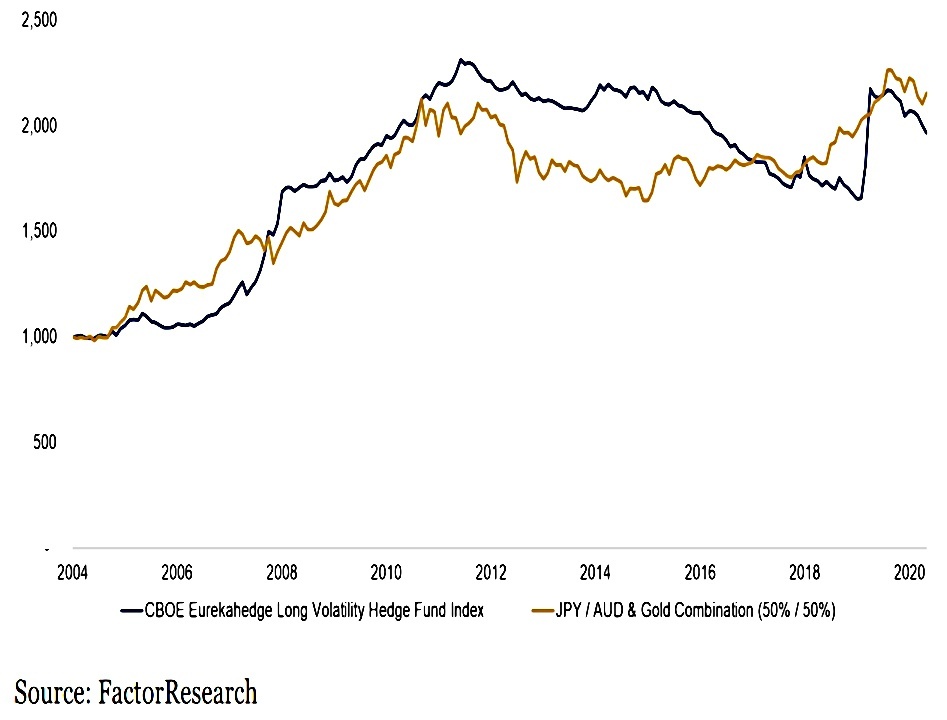
FX and Gold
Next, Nicolas replaces the VIX correlations with a simple 50:50 portfolio of JPY/AUD and gold.
[This] would have replicated the CBOE Eurekahedge Long Volatility Hedge Fund Index reasonably well since 2004. Both of these assets represent typical risk-off trades.
That’s it for today.
- The four notes have added some useful context to the DIY Long Vol strategies that we looked at last time, but the only practical addition was the replication using just FX and gold.
This supports my idea that “passive” private investors might simply hold a range of government bonds, a range of commodities (especially metals and gold) and a range of FX pairs.
- The nice thing about this approach is that everything apart from the FX is likely to be in a risk parity portfolio already.
More adventurous PIs might also add some crypto exposure.
- Until next time.
Mike Rawson
Mike is the owner of 7 Circles, and a private investor living in London. He has been managing his own money for 40 years, with some success.