Man Crypto Allocation

Today’s post looks at a paper from Man Group which asks whether crypto is a useful diversified and works out the optimal allocation.
Contents
Man Crypto Allocation

The report is called “The $64,000 $65,000 $57,000 Question: Bitcoin’s Place in Multi-Asset Portfolios”.
- As I write this, BTC is down to $49,000.

The report has three authors, none of whom I have come across before:
- Henry Neville
- Ben Funnell, and
- Teun Draaisma.

Volatility
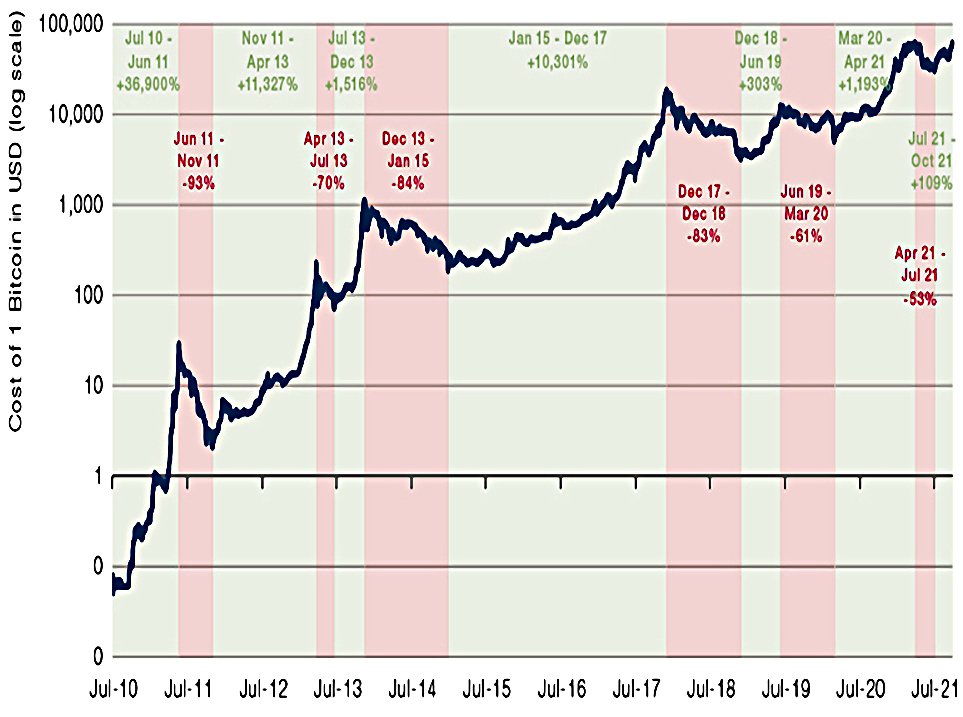
Bitcoin is very volatile:
There have been six instances of 50% or more drawdowns, and in each instance there were many who declared that at last the Ponzi scheme had been unmasked.
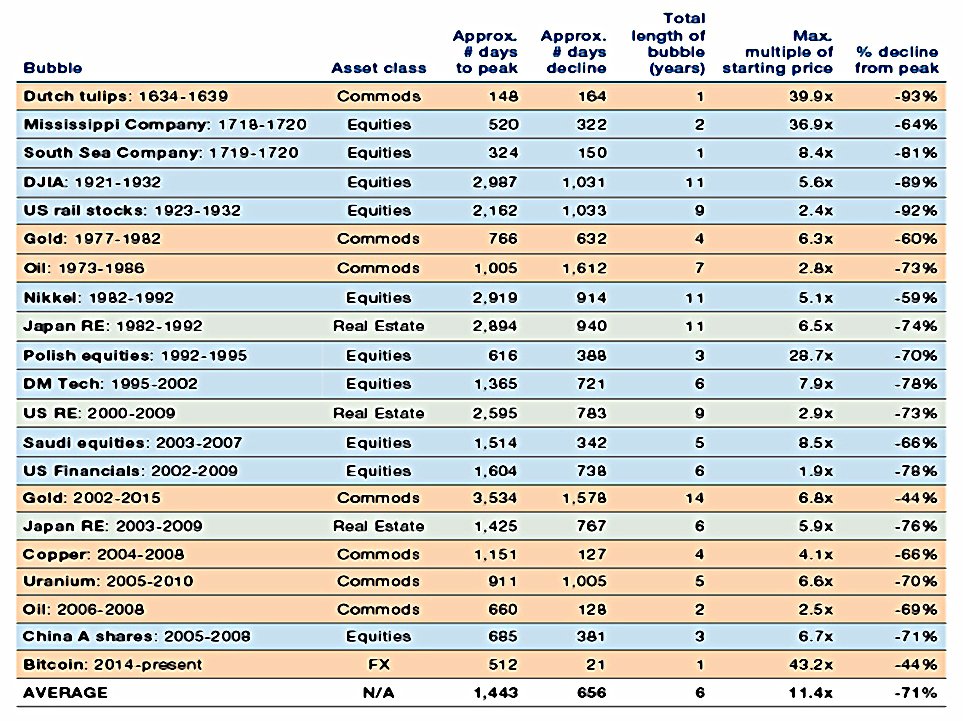
But there have been plenty of non-crypto bubbles, too – in tulips, trading companies and stock markets.
We are struck that most of these events have in common that the asset’s glory years either never returned, or not for a very long time. Bitcoin has followed a very different pattern – it takes some enormous hits, but repeatedly seems to fight back with a resurgence that stuns its detractors.
This has implications:
The fact that it has done this so often in a short space of time is at least initial evidence that Bitcoin’s volatility is less bubble behaviour, and more the price discovery mechanism of a genuinely new asset class.
Hence the reason for the paper:
Valuing bitcoin
Like gold or art, Bitcoin has no yield and is not a currency in so far as you cannot pay your taxes in it. It therefore has no intrinsic value that would be recognised under a discounted cash flow (‘DCF’) framework.
BTC could still be viewed by some (enough?) as an inflation hedge, like gold.
- The risk of regulatory action remains, though BTC may have already reached a size ($1 trn in market cap) where this would be problematic.
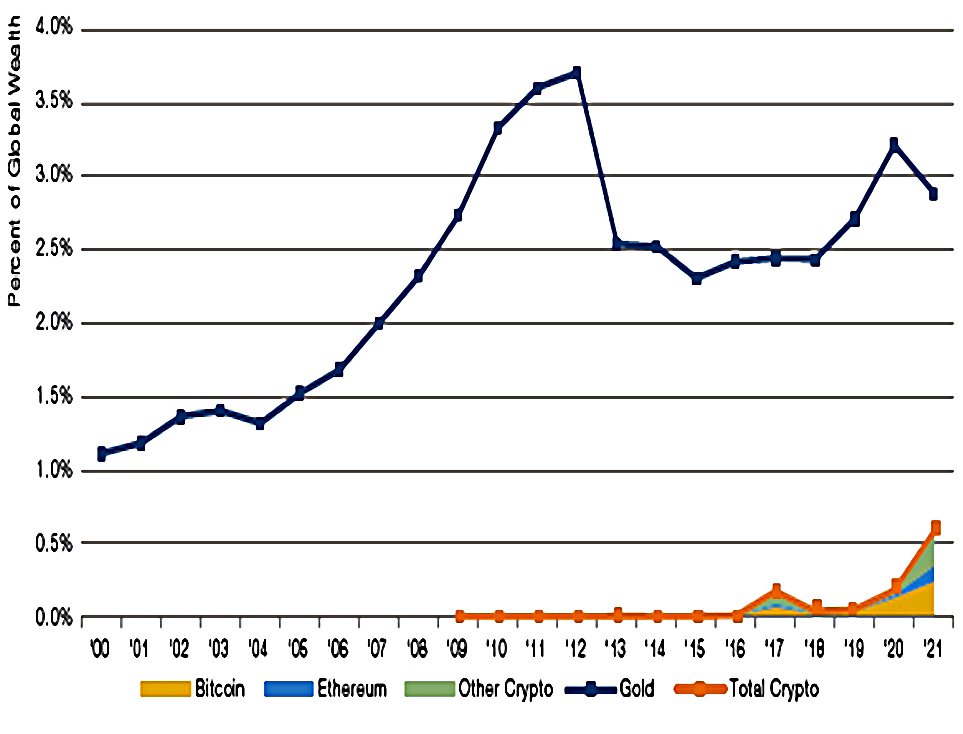
Man uses the comparison to gold as the first valuation method:
- Global wealth is $446 trn
- The 204 metric tonnes of gold is worth $13 trn (3% of global wealth)
- 19M BTC are worth $1.2 trn (0.3% of global wealth)
- Other cryptos (mainly ETH) takes this to 0.6% of global wealth
This gives a ceiling price for BTC of $417K, assuming crypto takes 70% of the gold pie and BTC takes 70% of the crypto pie.
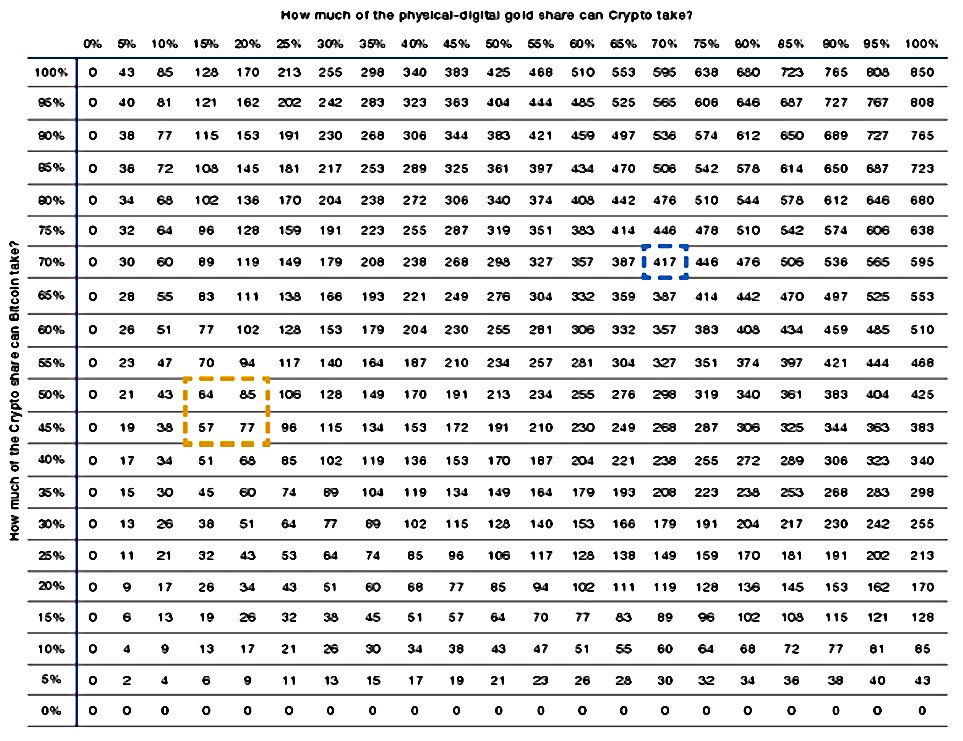
To counter the risk that Crypto goes to 70% of the physical-digital gold share, but Bitcoin goes to 0% of Crypto, it may make sense to have some diversification within any Crypto sleeve. In general the major tokens tend to move in similar fashion; for instance, the daily correlation between Bitcoin and Ethereum since the start of 2018 is around 0.8.
Ignoring the percentages, I have some issues with this:
- There are industrial uses for gold, and a significant amount is used for jewellery.
- Central banks store gold.
So the private investor share of gold is somewhat less and might support a price closer to $250K per BTC (at some unknown point in the future).
- This would also involve the gold price falling somewhat in real terms.
Where does crypto sit?
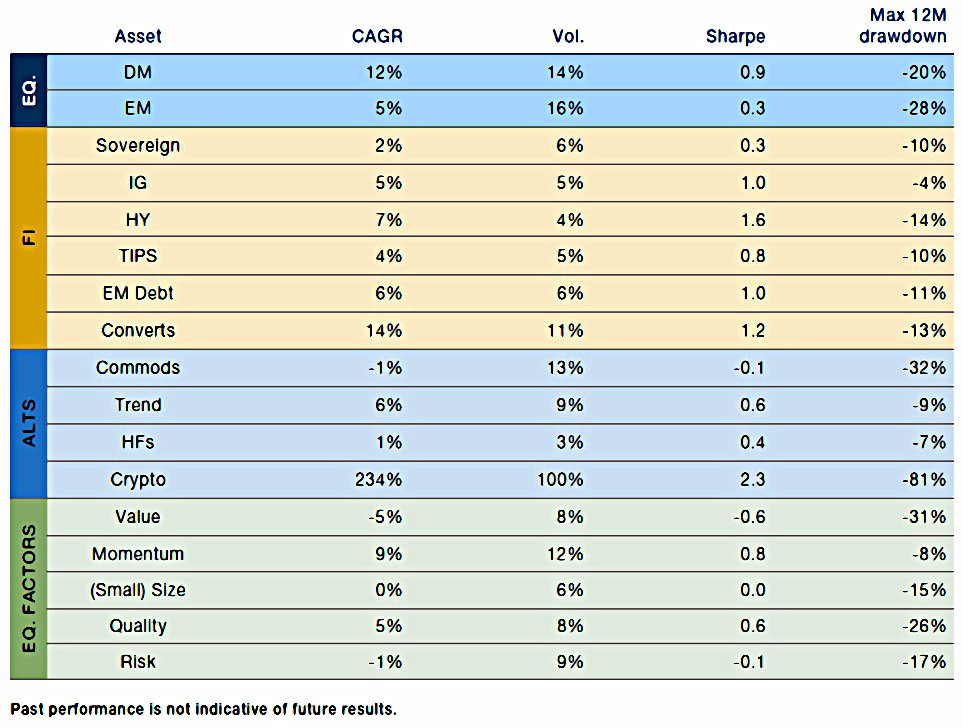
Crypto has been a shoot-the-lights-out asset, not only on a simple return basis but also on a risk-adjusted reading. Its Sharpe ratio of 2.3 is well over a point higher than its closest competitor.
There is a snag, however:
The drawdown on Crypto has been far worse than other segments. At -81% it is over 2.5x the nearest rival, Commodities on -32%.
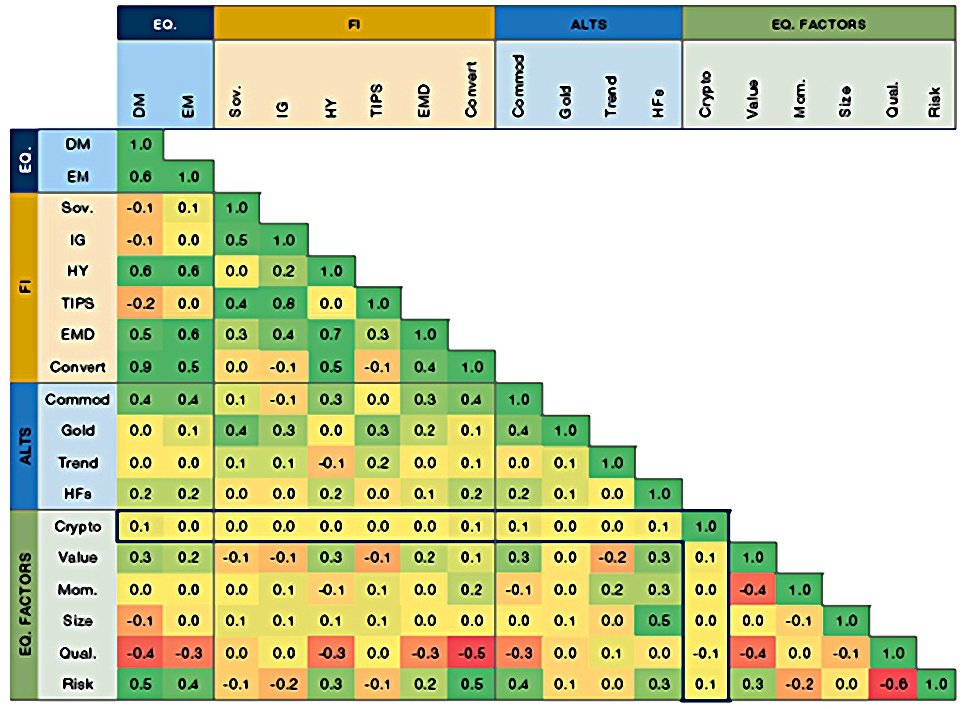
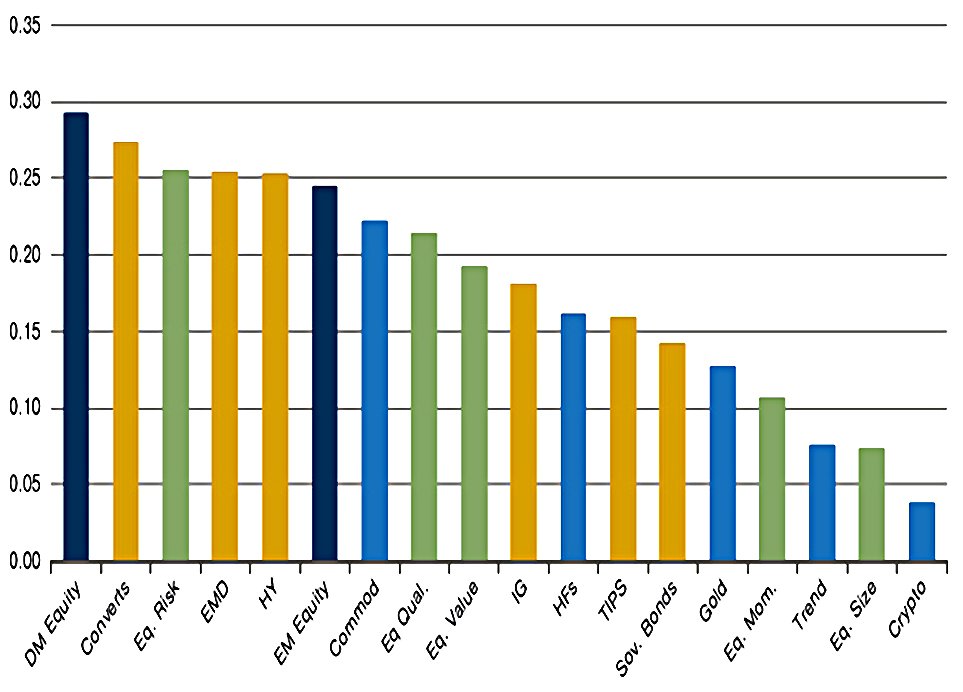
But correlations look good:
The average pairwise correlation for Crypto is easily the lowest of our portfolio building blocks and, between friends, we’d call it zero.
Left tails
The problem with diversification is that all correlations tend to go to 1 in a crisis.
The Black Monday / DotCom / GFC / Covid type sell-offs are the times when you most want promised diversification to kick in.
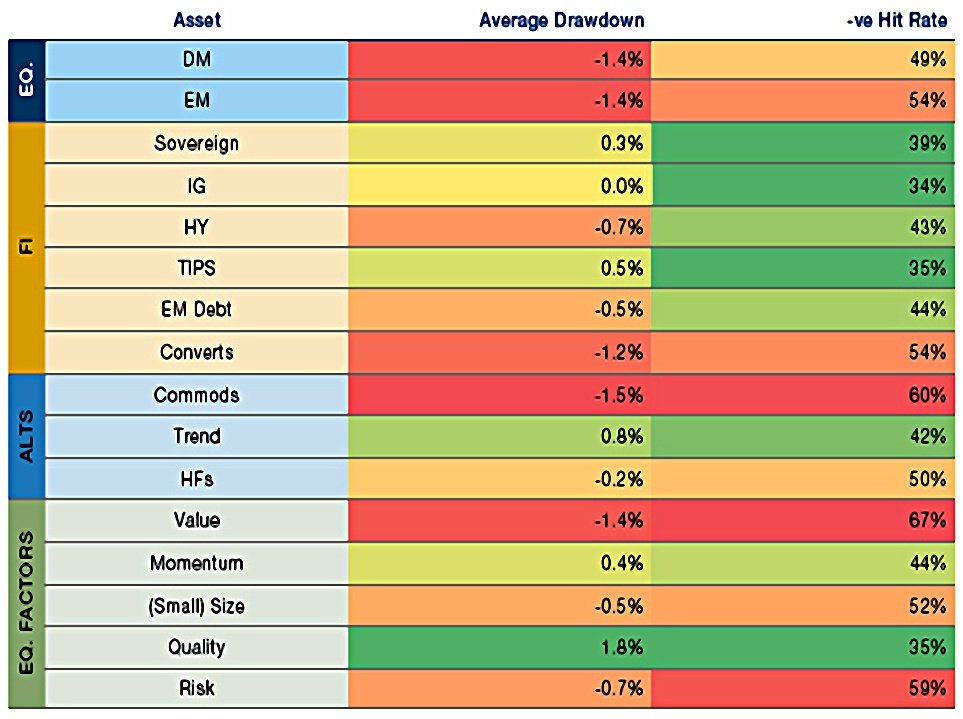
Man looked at this through the other end of the telescope – what happened to other asset classes when crypto was down 20% month-on-month ( this happened 344 times since July 2020, for a total of 12% of all months):
Assets more closely associated with risk-on attitude tend to sell off more and with more consistency than those less so.
So Equity is negative on average, as is High Yield, EM Debt and Converts, all segments of the Fixed Income universe with higher equity betas. Similarly, Commodities, a clear global cyclical bellwether, as well as Value, Small Cap and Risk in Equity L/S space, tend to suffer coincident with Crypto.
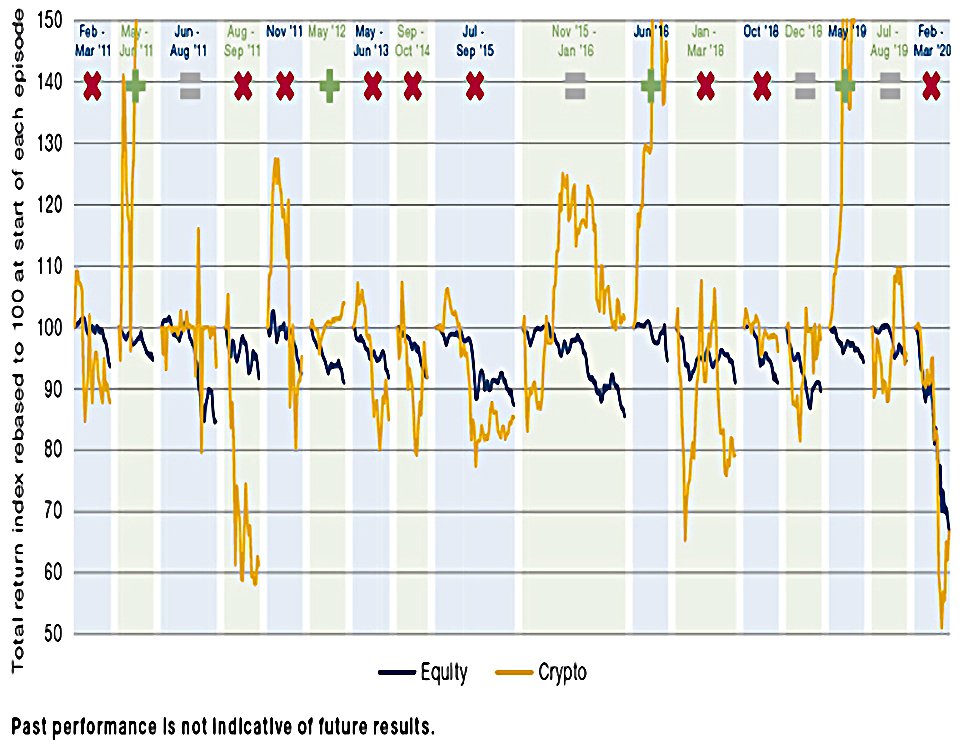
When DM equities drop by 5% or more in a month, crypto is not a good hedge:
- The average performance of Bitcoin was -13%;
- Bitcoin registered a negative return 86% of the time;
- The left tail correlation was 0.3. Similarly, in the 7% of instances where 60/40 registered a 2.5% monthly drawdown:
- The average performance of Bitcoin was -10%;
- Bitcoin registered a negative return 79% of the time.
The correlation (between crypto and DM equity) also increased from 0.1 to 0.3.
What’s the allocation?
To work out the best allocation to crypto, Man used a “generalised reduced gradient optimisation approach, to construct two example portfolios, one with Crypto and one without”.
They used the 12 asset classes within the equity, bond and alternative sections of the fifth chart in this article.
- They didn’t use the equity factors.
They solved for maximum Sharpe using five rules:
- Each book [asset class] must have an allocation of at least 2%;
- The total Equity allocation must be between 15% and 45%;
- The total Fixed Income allocation must be between 30% and 90%;
- The total Alternatives allocation must be between 30% and 50%;
- The maximum drawdown over any one month must not exceed 15%.
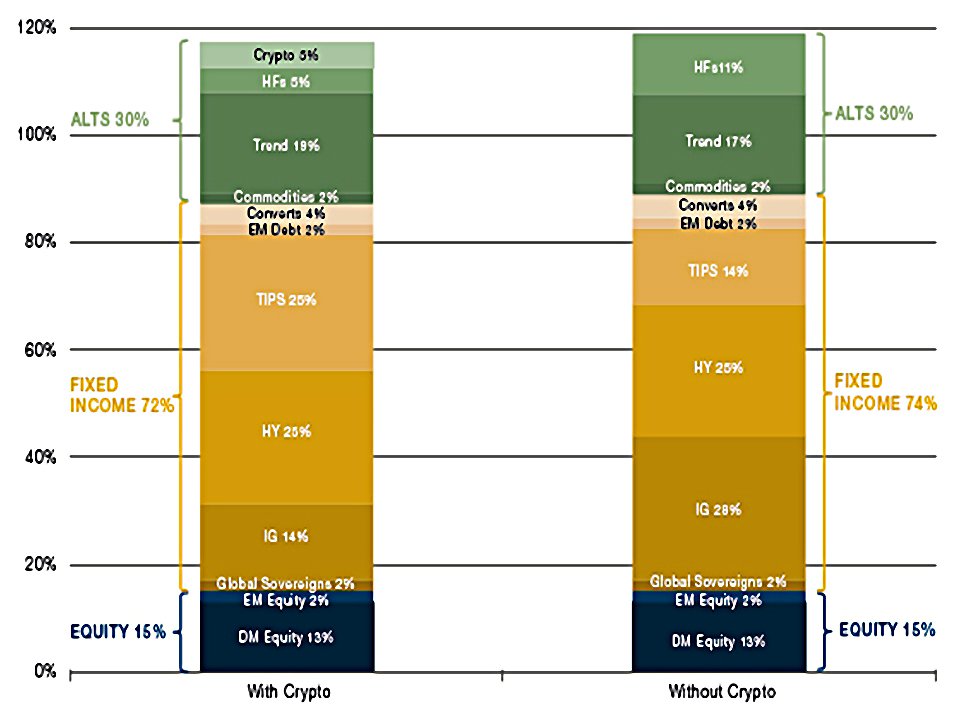
The with crypto portfolio has a 5% crypto allocation. Comparing this portfolio to the “without crypto” portfolio, Man make six observations:
- Marginally more capital efficient (total exposure of 117% vs 119%);
- Significantly underexposed to Hedge Funds (equity long / short strategies);
- Marginally overexposed to Trend;
- Marginally underexposed to Fixed Income;
- Significantly overexposed to TIPS;
- Significantly underexposed to IG.
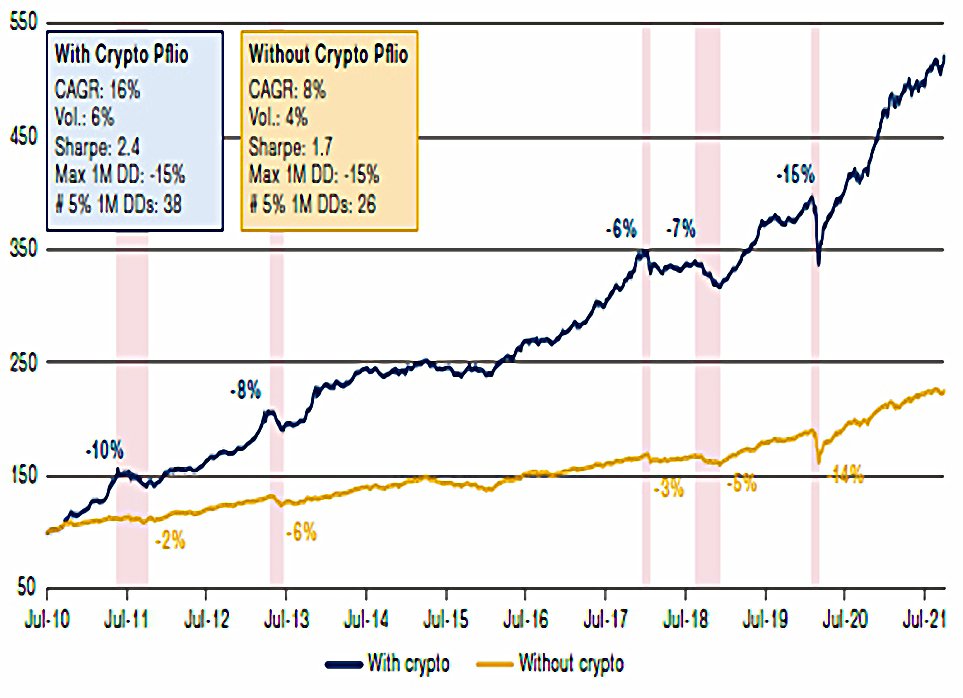
The chart above shows the performance and stats for the two portfolios.
Crypto-inclusion is a significant positive for Sharpe, adding 0.7 points. But that is paid for with a worse drawdown profile, both in terms of their happening with greater regularity (38 5% drawdowns vs 26), and greater severity (as illustrated in the pink shaded areas).
Whether that trade-off is worth it is a subjective decision.
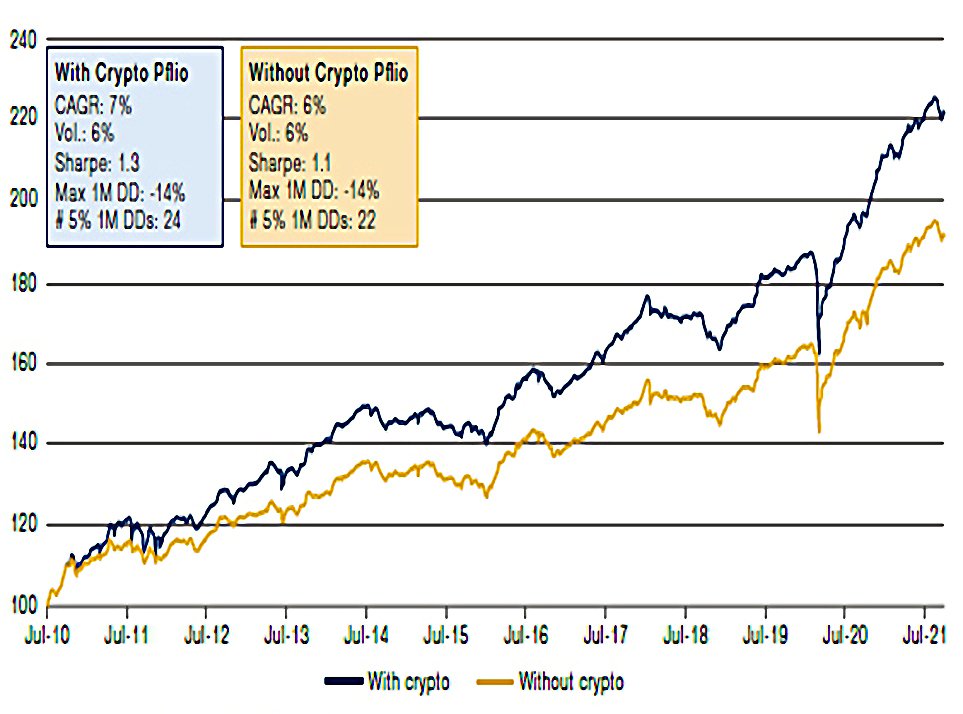
A second approach solves for an equal risk contribution within the alternatives section, rather than at the portfolio level:
- Keep weights of Equity, Fixed Income and Alternatives static at 30 / 60 / 40% (a common multi-asset SAA in our experience);
- Within Equity and Fixed Income keep the weights of all sub-books constant at SAA weights (30% DM Equity, 53% DM Sovereigns and 7% EM Debt);
- Within Alternatives make the risk contribution of each of the sub-books equal.
This gives a crypto allocation of 0.8%
The difference between the two portfolios is now much narrower in risk-adjusted return space, but also in terms of frequency of drawdown, with the inclusive portfolio experiencing just two additional corrections (24 vs 22).
The third approach is a “clustered inverse expected tail loss (ETL) approach”:
This keeps allocations within the 30% Equity and 60% Bond portions static, but within the 40% Alternatives book, weights the individual sleeves optimising for ETL, but with the different allocations clustered according to common risk budgets.
This gives crypto a 1.9% weight within Alternatives, equal to 0.8% of a 30/60/40 example portfolio.
A fourth approach makes crypto share its risk budget with commodities.
- This gives a crypto weight of 0.6% at the portfolio level.
Conclusions
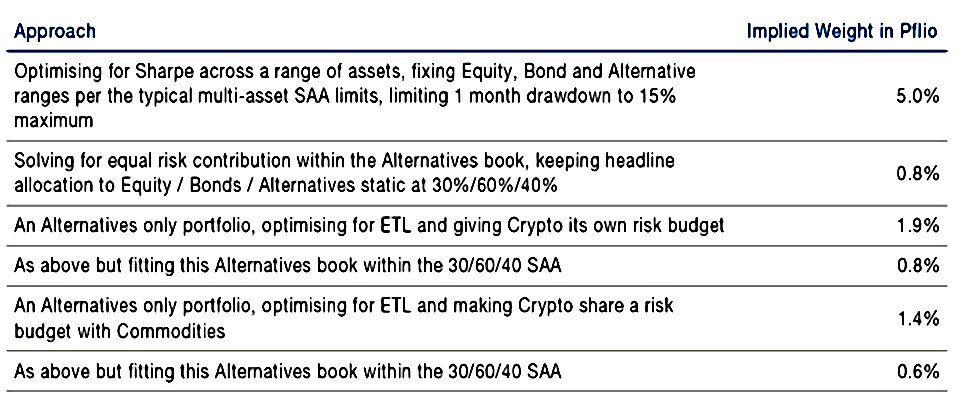
The table summarises the results of the four approaches.
- Man don’t make a recommendation amongst the various allocation levels, so we will need to choose for ourselves.
My personal target for 2021 was 0.5%, and I ended up pretty close to that.
- For 2022 I’m shooting for 1.0%, but I will build up gradually.
Until next time.
Mike Rawson
Mike is the owner of 7 Circles, and a private investor living in London. He has been managing his own money for 40 years, with some success.