Household Wealth 2020
Today’s post looks at a post from the ONS on household wealth in the UK.
Contents
Household Wealth 2020
Total Household Wealth in Great Britain is a report that the ONS publishes every two years.
- I planned to write about the last survey but Covid got in the way.
Since the data is already close to two years old when it is published, (( I have no idea why )) I thought I should be more prompt in dealing with this version.
- The latest report covers the period from April 2018 to March 2020.
Headlines
- Median household wealth was £302K, up 20% since 2008
- The top 1% of households have £3.6M or more
- The bottom 10% have £15.4K or less
- The Gini coefficient has remained stable over 14 years
- Households headed by those over 55 (but below state pension age, SPA) have a median wealth of £553K
- Those aged between 16 and 24 have 25 times less
- Retired households have the greatest wealth (£489K median)
- They also have lower expenditure
Total wealth
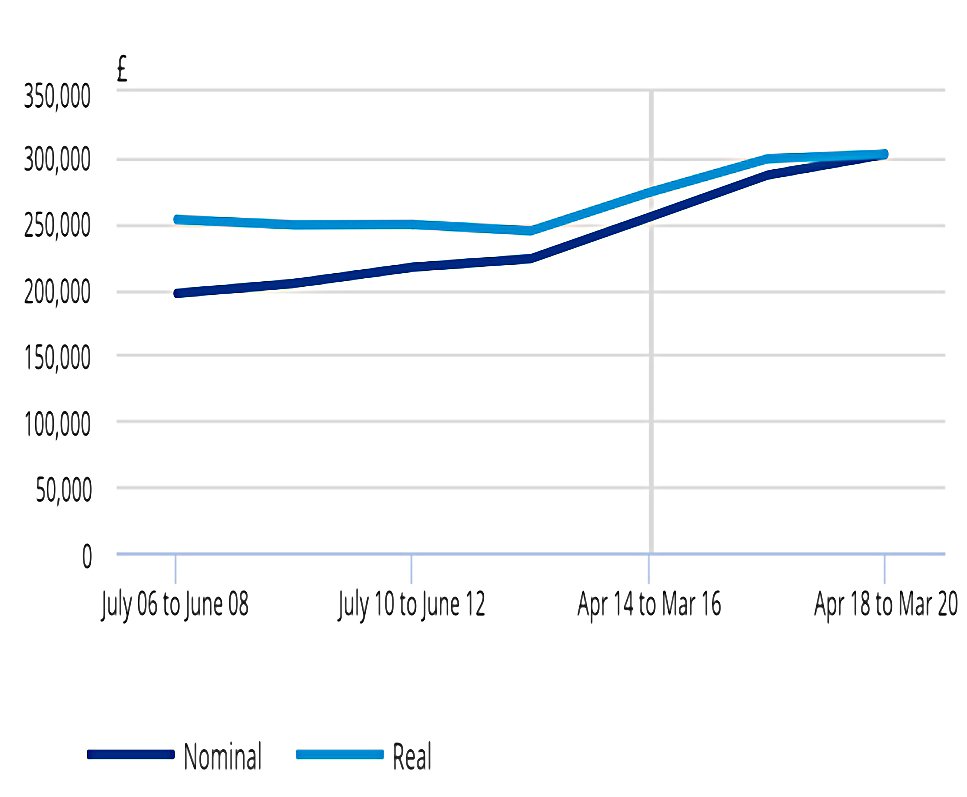
After inflation, wealth has been pretty stable apart from the 2014 to 2018 period.
There are four main components to wealth:
- net property (value of residences minus mortgage debt)
- physical (household contents, vehicles)
- private pension
- net financial (savings or investments minus financial liabilities)
I assume that the separation of private pensions from other financial assets is a historical quirk dating back to when private pensions were largely DB rather than DC.
- Pensions have increased slightly over the past 14 years, and are now the largest component at 42%.
- Property has fallen slightly and now stands at 36%.
Factors driving this switch include:
- Lower homeownership in younger cohorts
- Rising pension pot valuations (from lower annuity rates and bond yields/discount rates)
- Automatic enrolment into workplace pensions
Financial wealth is just 13% of the total and physical wealth is just 9%.
Percentiles
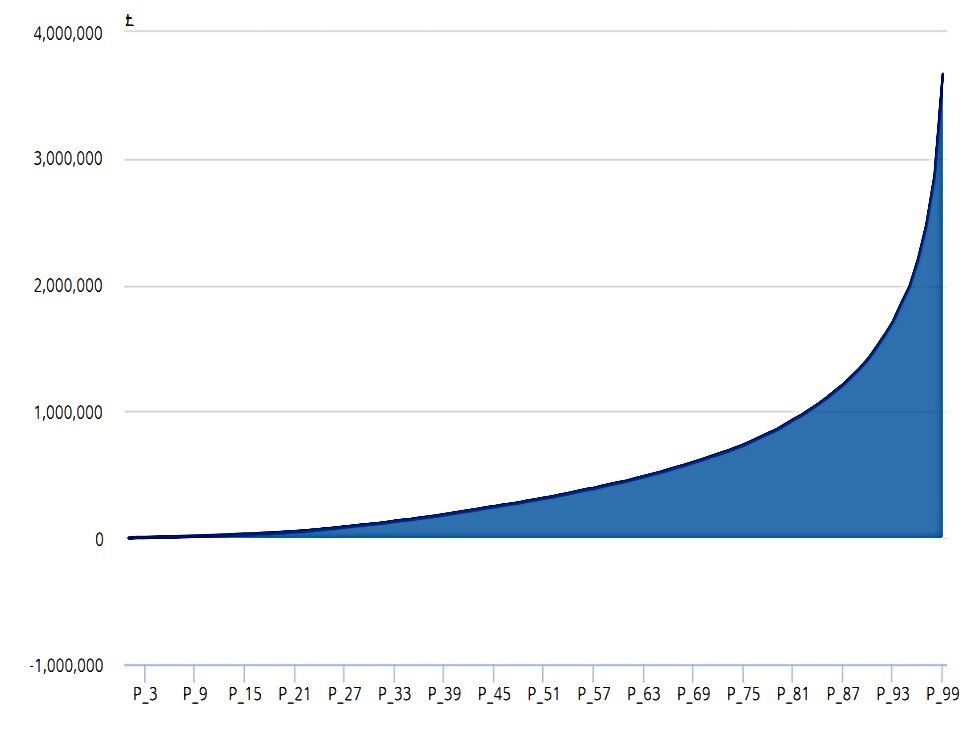
The ONS splits wealth by percentiles so that it can look at inequality.
The wealthiest 10% of households held 43% of all the wealth in Great Britain in the latest period; in comparison the bottom 50% held only 9%.
Half of the bottom decile had only physical assets (mean value £8K) and close to half had more financial debt than financial assets.
Wealth is distributed more unequally than income; the Gini coefficient for income was 0.36 in 2020, whereas the equivalent for wealth was higher at around 0.6. However, wealth inequality by the same measure has remained stable for 14 years.
Financial wealth and private pension wealth have the highest Ginis (0.89 and 0.73).
- Physical wealth has the lowest (0.47).
Components
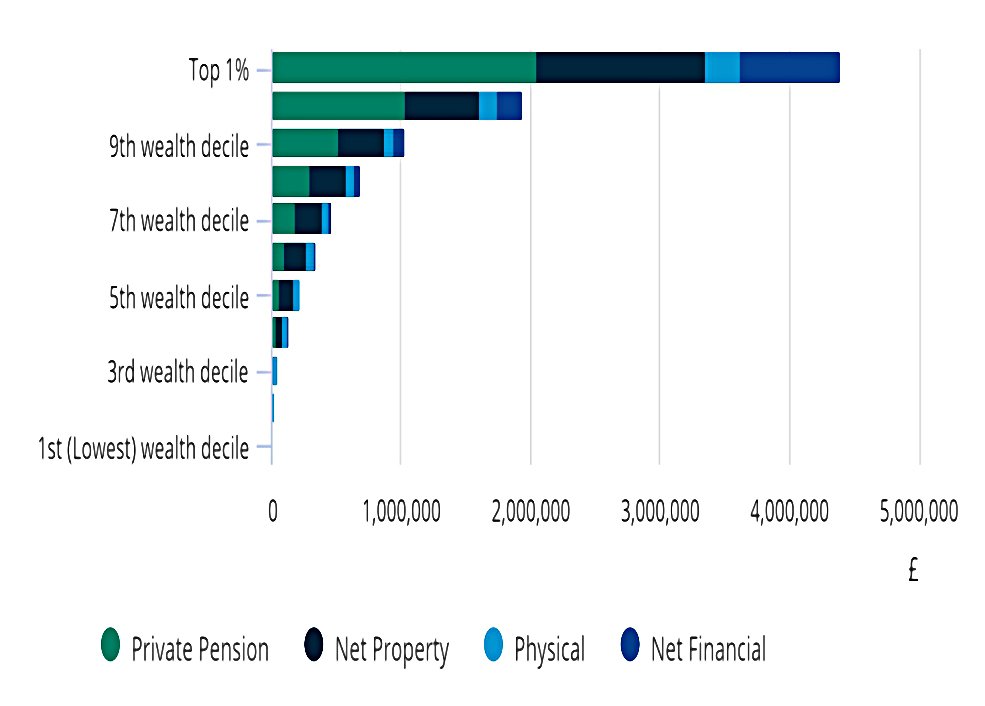
- Physical wealth was the main wealth component for the least wealthy households, (deciles 1 to 3)
- Whereas for those households in the middle of the distribution, (deciles 4 to 7), property wealth was the largest component
- At the top of the distribution, pension wealth was the largest component; the top 1% held average (median) household pension assets of around £2 million.
- The median value of pension assets for households where the head is approaching SPA was just over £200,000
Financial wealth only shows up at the top end of the distribution:
[Financial] wealth held by the richest 1% of households was greater than for the entire bottom 80% of the population.
Age
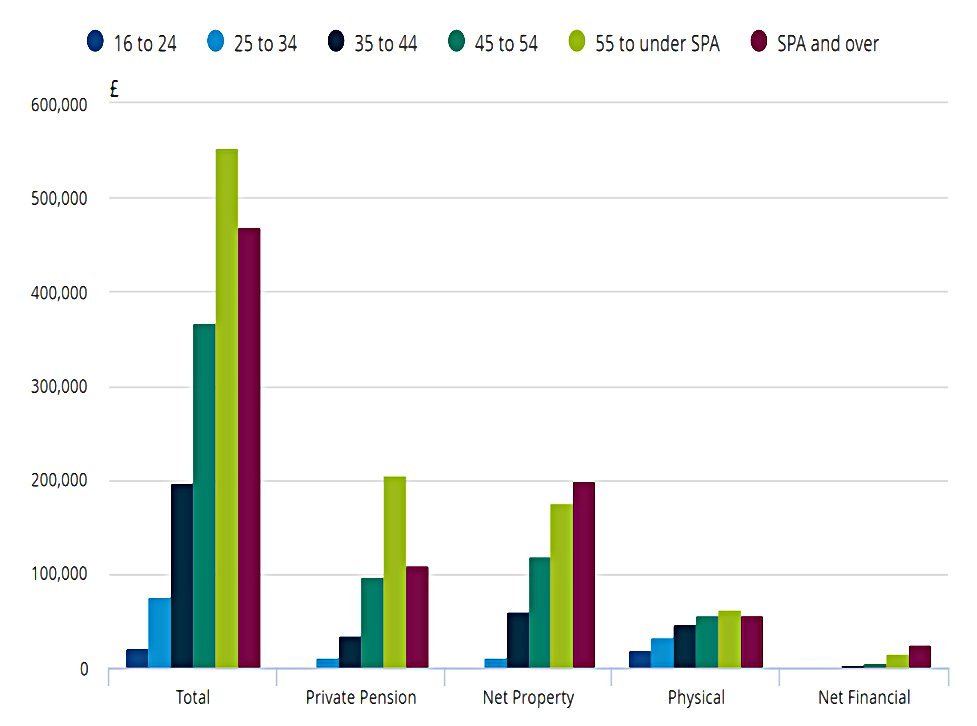
Not surprisingly, wealth increases with age.
- On average people buy their first home at age 32, and spend the next 25 years paying down the mortgage.
Pension wealth also increases through a worker’s career, as contributions increase in line with salary and investments grow in value.
- In retirement (after the SPA) pension wealth is consumed and overall wealth shrinks again.
Economic status

Again not surprisingly, retired households were the richest (median £489K) and inactive/unemployed households were the poorest (£25K).
Almost three-quarters of households with a retired head owned their home outright, compared with less than 30% of self-employed and less than 20% of employee-led households.
The split between employed and self-employed is of some interest, but I would be more interested in a split between private and public sector employees.
- Self-employed households (£333K) were richer than the employed (£287K), but the employed had larger pensions.
Regions
The wealthiest region was the South East, which also saw one of the fastest increases in average (median) wealth since 2006. The regions with the lowest median wealth were the North East and Scotland. Average wealth in the North East (£168,500) was about one-third of the average level of wealth in the South East.
Although London had the lowest property ownership rate, low participation in private pensions and decreasing median wealth, the region held 15% of all wealth in Great Britain, because of substantially higher property values. Median household net property wealth was £450,000. London had the most uneven distribution for total wealth.
Conclusions
The report holds few surprises, I’m afraid.
We know what the median net worth is, and what amount puts you in the top 1% or bottom 10%.
- I would also like to know how many people have less than zero, and their distribution across ages, employment status and location.
We know that older people (including retirees) have more money and that the self-employed have more than the employed.
- But are public sector employees richer than private-sector ones? (( They shouldn’t be, but I suspect that their generous pensions mean that they are ))
We know that pensions are worth more than property, though this is a recent development, probably due to auto-enrolment.
- But will this trend continue as the DB pensions of older cohorts drop out of the picture?
Until next time.
Mike Rawson
Mike is the owner of 7 Circles, and a private investor living in London. He has been managing his own money for 40 years, with some success.


Re: “But are public sector employees richer than private-sector ones?”
As I read the report, only private pensions are included in the ONS definition of total wealth – ie state pensions and public sector pensions are excluded. Arguably this is correct as these are HMG liabilities and not individual assets. However, ….
FYI, a two year delta is not unusual in such figures. For example, usually the inflation calculation for year X is based on the consumption data from year X-2 albeit corrected by inflation for year X-1.
Re: “I would also like to know how many people have less than zero, and their distribution across ages, employment status and location.”
If you go to the original ONS report and download the XLS file under Figure 2 – this will give you some idea. Apparently, at least 1% of population have negative total wealth