Man Overboard – Credit Suisse on Price Drops

Today’s post looks at a report from a few years ago on how to handle large price drops in your stocks – it’s called Managing the Man Overboard Moment.
Contents
Man Overboard
The report – from Credit Suisse (CS) – came out in 2015, but I’ve only just come across it.
- It was mentioned in a comment on Stockopedia in reference to what to do when a stock issues a profit warning.
Stockopedia have their own research on this, which we covered here.
- The basic advice is to sell on the first warning.
The CS report has four authors, of which the most famous is Michael Mauboussin.
The report stresses the importance of keeping your emotions in check when things go against you.
- One one of the trickiest situations is when a stock you own drops sharply in price – they call this the “man overboard moment”.
The best approach is to have a plan in place in advance so that you don’t react emotionally.
- The CS report aims to provide a framework for this, by comparing price drops that are driven by earnings announcements (not including profit warnings) and those that are not.
They also look at the momentum, valuation and quality factors that apply to the affected stocks.
- And they provide a checklist to help you decide whether to buy, hold or sell.
Types of Checklists
CS like to use checklists, as in the airline and medical sectors.
- They namecheck Dr Atul Gawande’s book The Checklist Manifesto.
He describes two kinds of checklists:
- Do-Confirm: this is for when you are doing something that you’ve done before.
- The checklist is for completion.
- Read-Do: here the checklist is telling you what to do, like a recipe.
- This is the kind of list that’s useful when you are under pressure.
The data
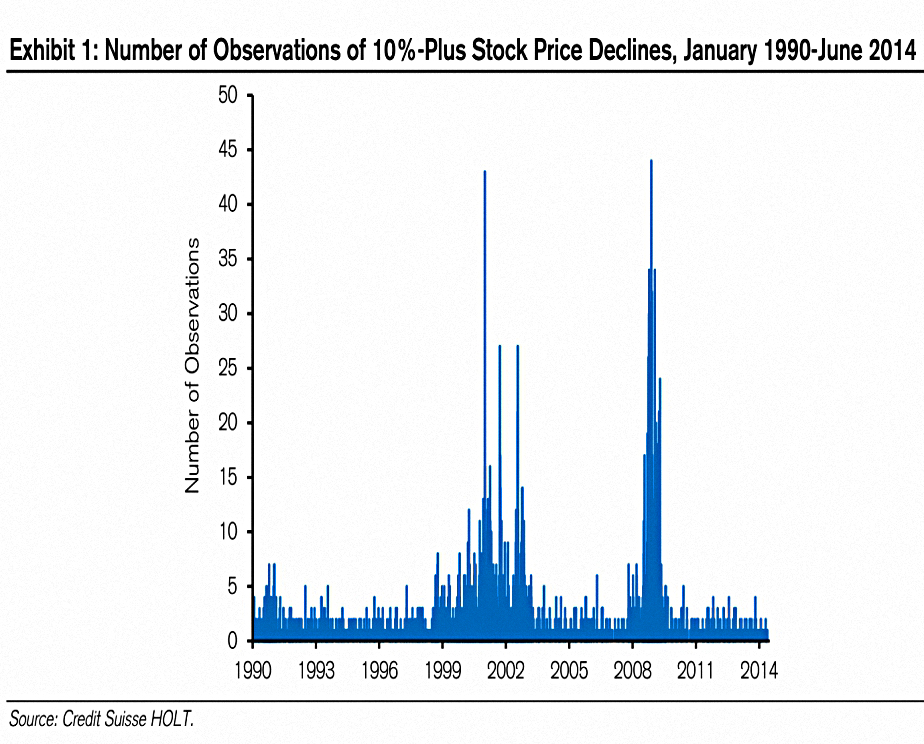
The CS report looks at 5,400 declines from 1990 to 2014.
- 40% of these are clustered around the dot-com collapse from 2000 and the 2008 financial crisis.
The inside view
CS contrast the inside view (specific to the circumstances of the situation) with the outside views (using a wider data set).
- In general, investors (and people in general) use the inside view too much.
There’s a parallel here with Kahneman’s System One and System Two.
Methodology
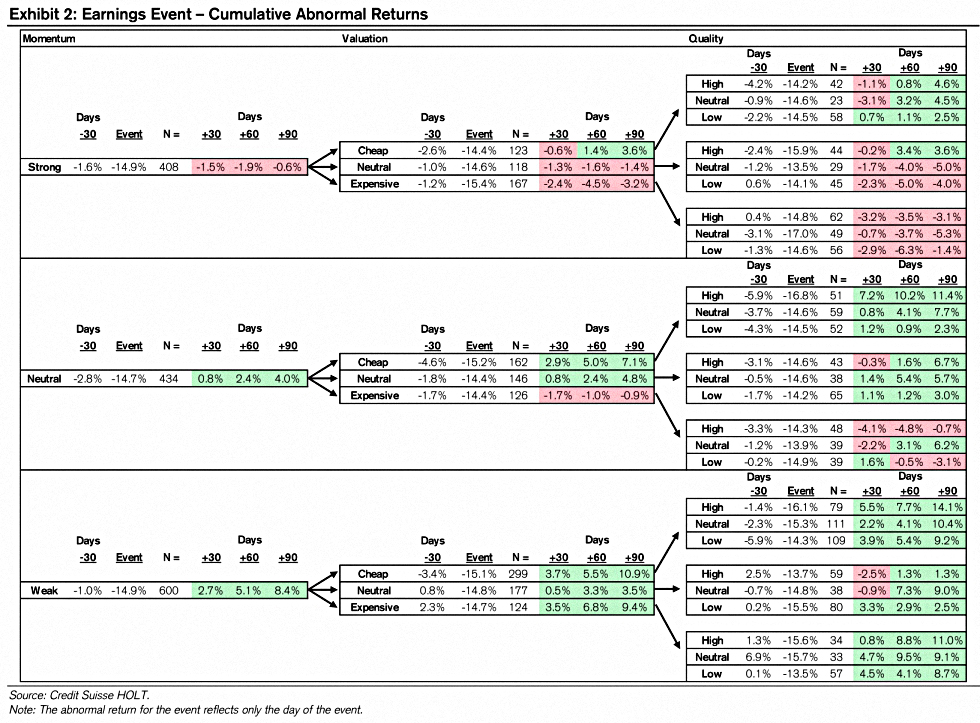
CS calculate the cumulative abnormal return for fallen stocks in the following 30, 60 and 90 trading days.
- The risk-adjusted return from the index (the S&P 500 in this case) is subtracted from the stock’s raw return to calculate this.
Declines are split into those following scheduled earnings announcements (there are more of these in the US) and everything else (including profit warnings).
- Surprisingly (to me), poor earnings announcements lead to larger declines on average.
They also look at three factor characteristics of the affected firms:
- Momentum – price momentum plus the change in cash flow return on investment (CFROI, which seems to be a CS term)
- Valuation against a model called HOLT (which I presume is again CS-specific), plus adjusted measures of PB and PE.
- Quality, measured by CFROI and value creation from investments
We might look to substitute the standard Stockopedia QVM factors here.
The third step is to split bubble periods from non-bubble periods.
- Bubble periods are more volatile, but the direction of subsequent price movements is the same in more than 80% of cases (close to 90% for non-earnings announcements price drops).
CS notes that the median results are in general lower than the averages presented in their tables.
- The data is right-skewed.
Note also that standard deviations are large, with an average of around 40%.
The Price Drop Checklist
It’s a little misleading for CS to call the output a checklist.
- What we actually get are two decision trees, one for earnings announcements and one for everything else.

The report illustrates how to use the charts via a couple of case studies.
Symantec
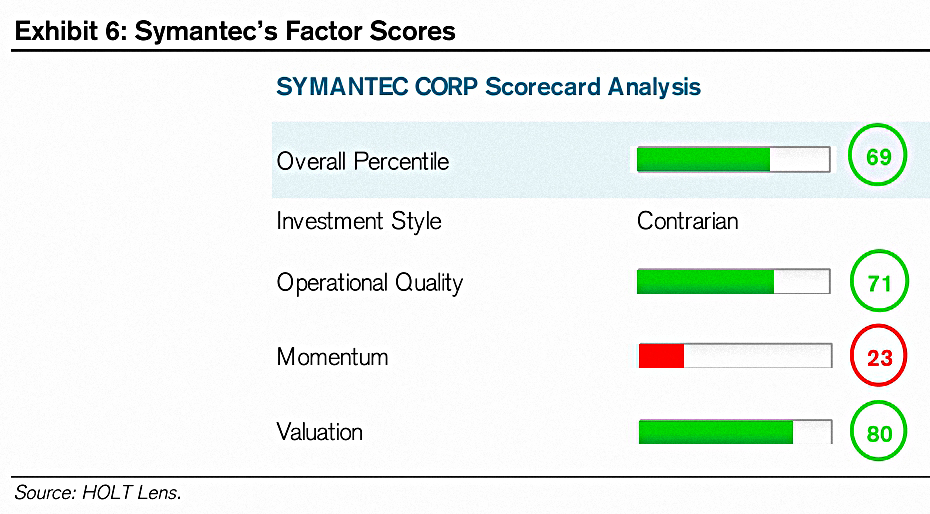
Symantec is High Q, High V (cheap), Low M.
- The price drop (in 2014) was triggered by the firing of the CEO.
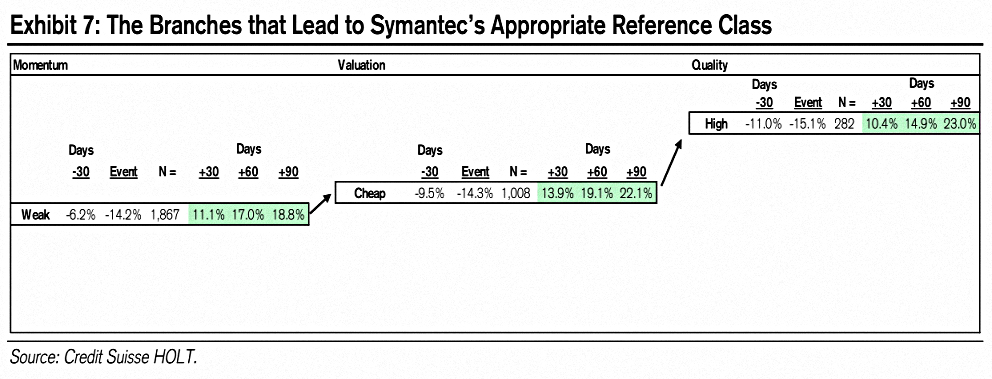
This means that we expect Symantec to outperform.
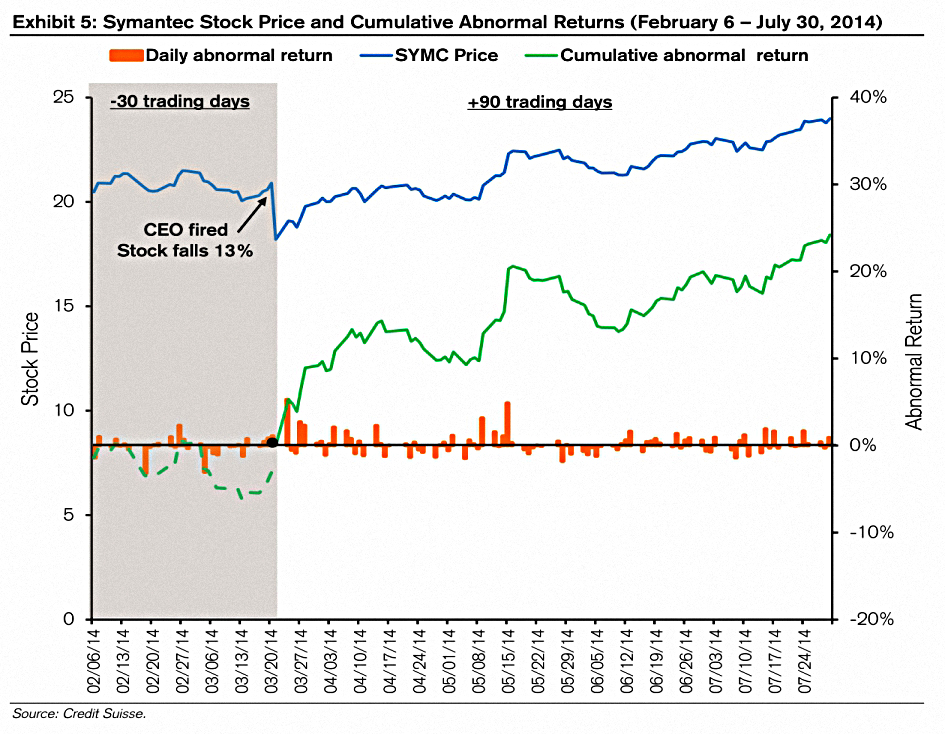
And indeed it does.
Tenet
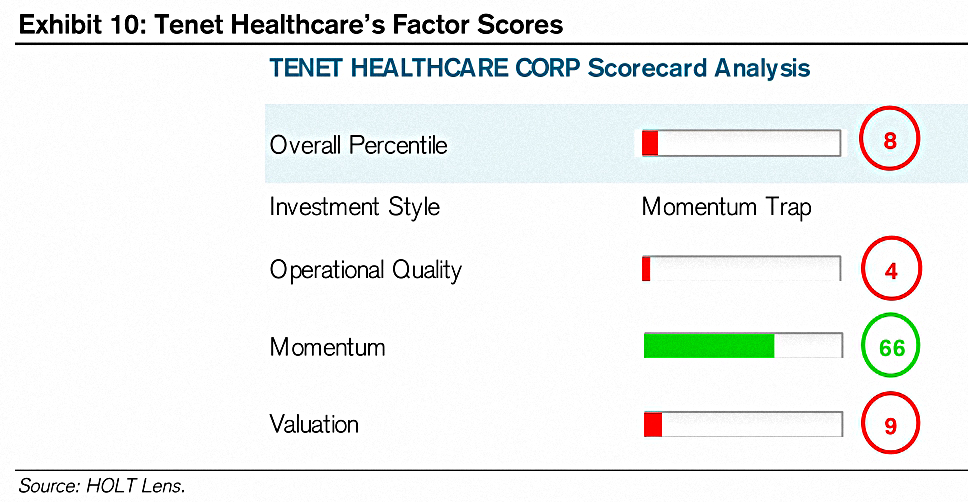
Tenet dropped after disappointing earnings in 2008.
- It was a High M, Low V (expensive), Low Q stock.

So we expect Tenet to underperform.
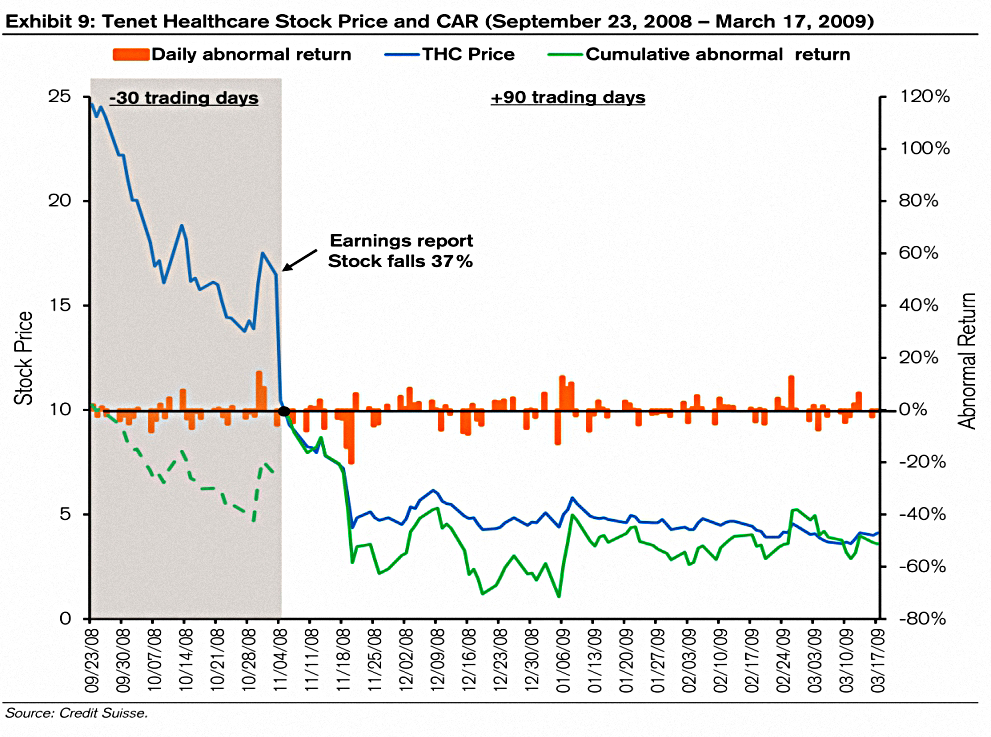
And indeed it does.
Conclusions
This looks like a potentially very useful framework for analysing price drops.
- In a follow-up article, I’ll try to summarise the two main tables into an easier-to-follow grid.
And I’ll try to build a couple of stocks screens (BUY and SELL) from the results.
- Until next time.
Mike Rawson
Mike is the owner of 7 Circles, and a private investor living in London. He has been managing his own money for 40 years, with some success.