Portfolio Performance App
Today’s post looks at the Portfolio Performance App.
Portfolio Performance App
Portfolio tracking has been a bit of a pain since Google disabled the portfolio feature within Google Finance back in 2017.
- I’ve looked at a few free online versions but never found anything that I could stick with.
As it happened, I was setting up an IHT portfolio (of AIM stocks) for my mother-in-law that year, and we agreed that I would use Stockopedia to manage it.
- Stockopedia does a decent job of this, but it costs £245 per year, so I am always on the lookout for a free alternative. (( The main alternative to Stockopedia is ShareScope/SharePad, which is even more expensive ))
Stockopedia also works fairly well as a stock screener, so I would also need an alternative to that function.
- But the site hasn’t lived up to its potential as a systematic investing hub, and since Covid, a lot of inexperienced semi-gambler-style investors have joined and the quality of discussion has declined.
So I am open to a replacement.
Enter the Portfolio Performance app, which I discovered via this article on Medium by Dimitrios Gourtzilidis.
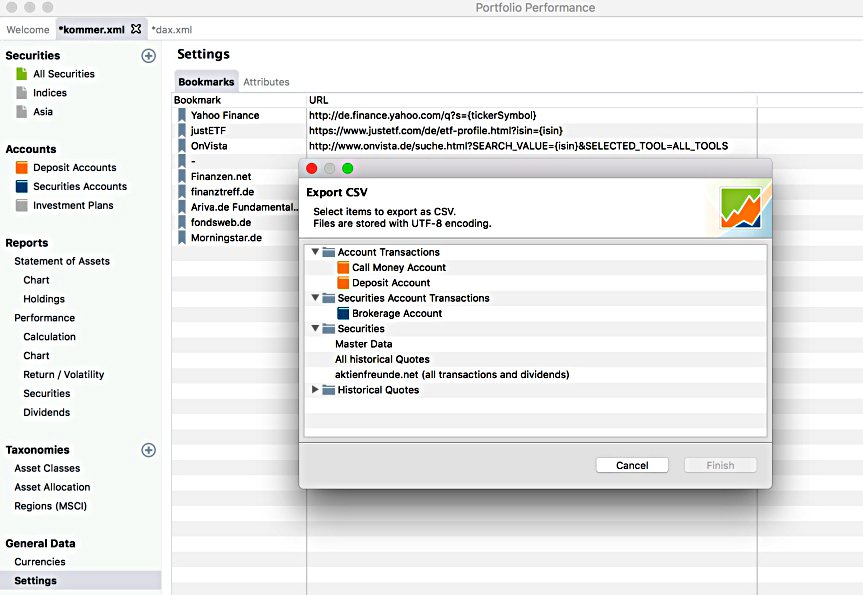
- PP is free and open-source and accepts and exports data in standard formats (CSV, XML, JSON).
You can download the software here.
- There’s also a comprehensive tutorial (from a third party – IndexFund Investor) to get you started here.
Before we dig into the package, I should mention the major drawback (for UK investors, at least).
- The app is written in German and has limited UK support (the website has an English option, for example).
This probably explains why I’ve never come across an app that dates back to 2012.
- I don’t think that is a showstopper, but let’s find out.
Features
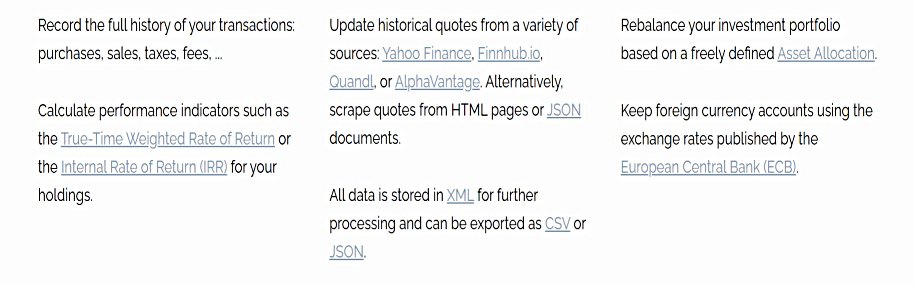
Here are some of the features I might be interested in:
- Use (historical) price data from Yahoo and others (I hope this means yesterday’s closing price), including for European stocks (not just US securities).
- This will be the crucial point – if I can’t automate pricing for the stocks I want to hold, I’m not sure how much use the app will be
- Use transactions in more than one currency (£ and $ for me).
- FX data comes from the European Central Bank
- You can also use Google Sheets to create an importable CSV file
- Support for multiple brokerage accounts
- Calculate performance stats (CAGR and IRR, drawdown, volatility etc).
- Work out rebalancing needs from a specified asset allocation.
- Support for dividend payments (and savings plans).
- Charting
Installation
The download is straightforward, once you have set your language to English.
- For the installation, I didn’t need to choose English – I believe the software reads the settings on your machine’s OS.
- The app doesn’t have the right security certificate for Windows, so you’ll need to override the warning.
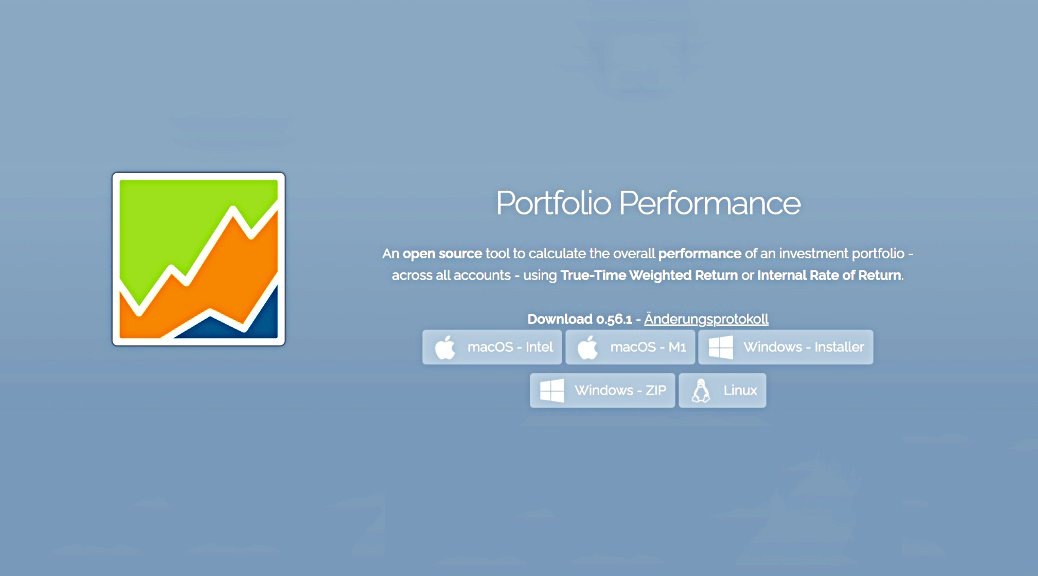
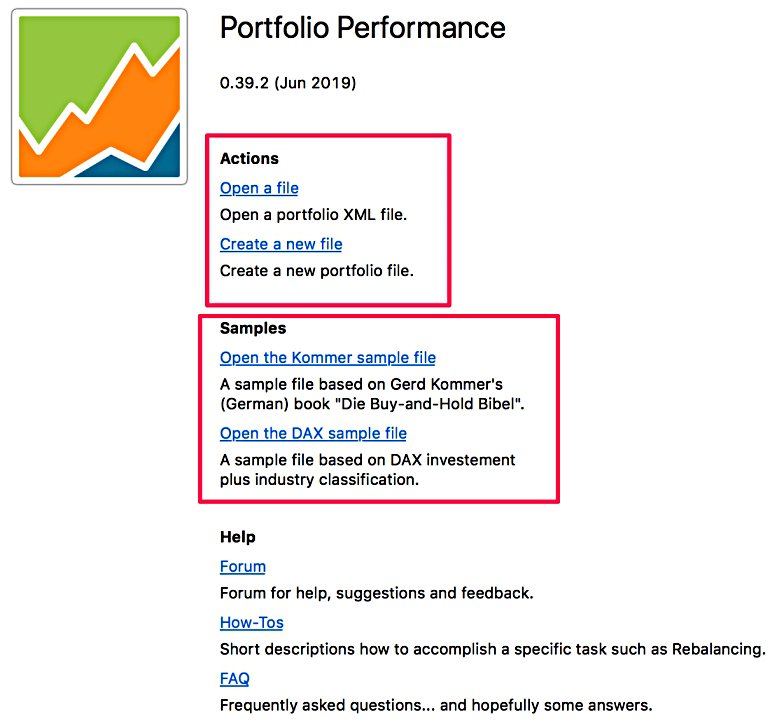
The landing page looks something like the above, though at the time of writing the current version of the software is 0.56.2
Your data is stored in an XML file, and the front page lets you start a new file or load an existing one.
- There are also a couple of sample files (with a German flavour) – the screenshots from the two articles I referenced above use these sample files.
Opening a file creates a new tab in the app, leaving the welcome page open.
The menu has five options:
- File – this includes data import and export
- View – this is the same as the left sidebar, which I’ll cover below
- Transaction
- Online – this is where prices are updated
- Help
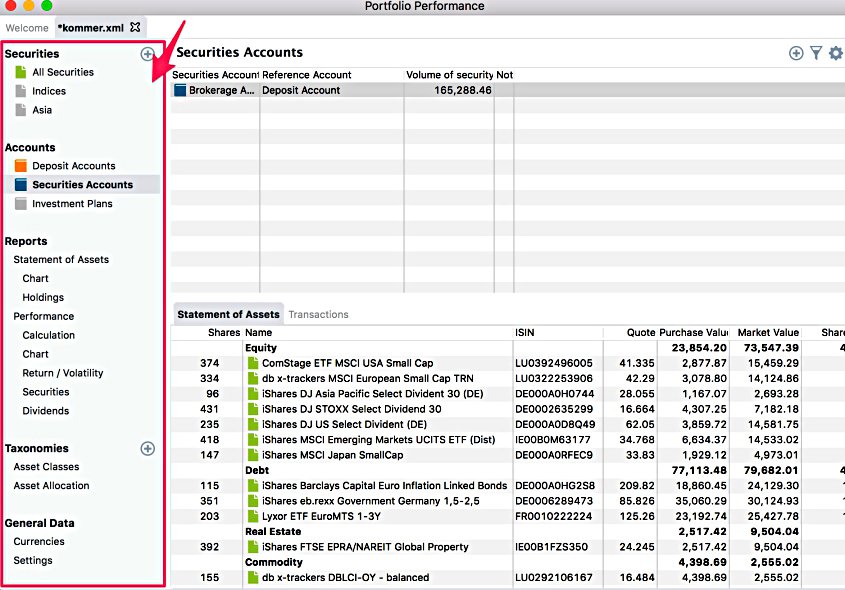
The sidebar has five sections:
- Securities
- This is where you add the instruments you are investing in.
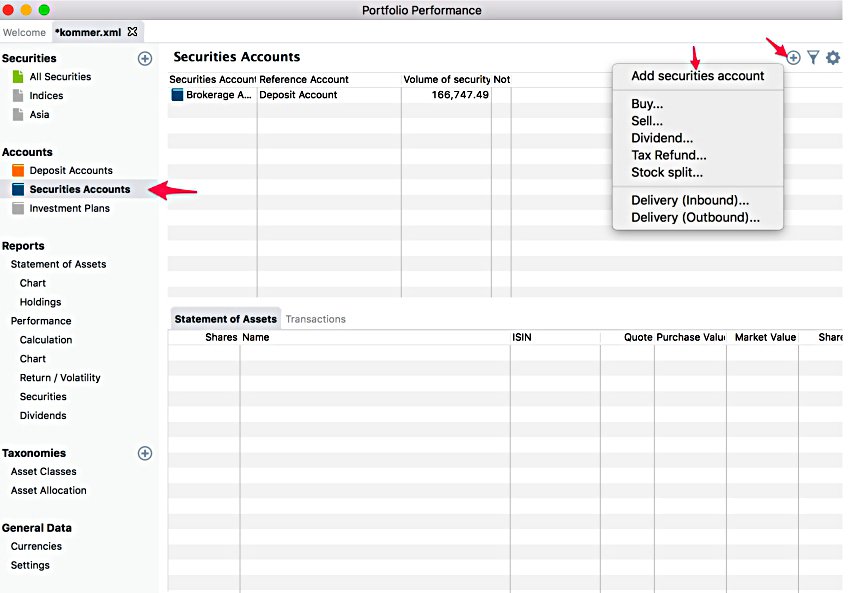
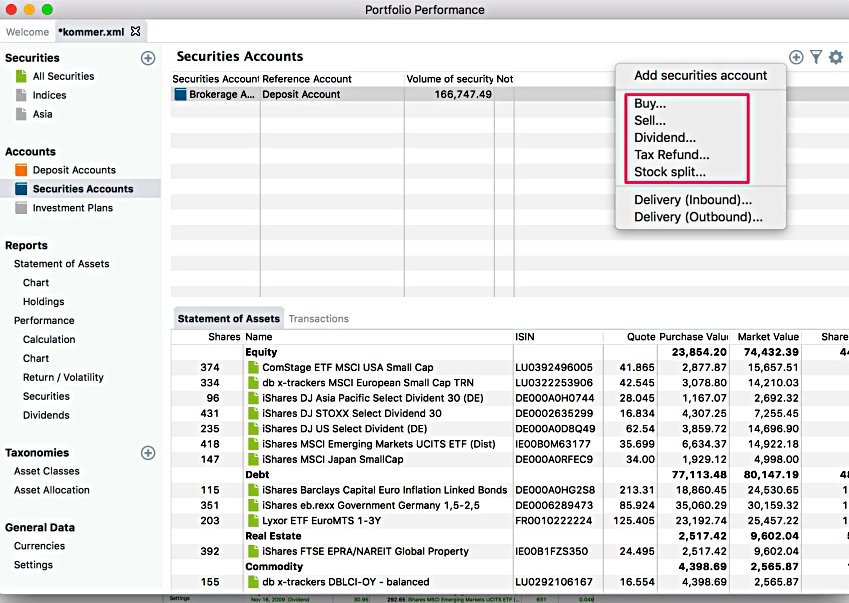
- Accounts – cash and securities (each securities account is matched with a reference cash account)
- This is where you add your transactions.
- Reports
- Taxonomies – this where your asset allocation, asset class and geographical information goes
- General data – exchange rates and data sources
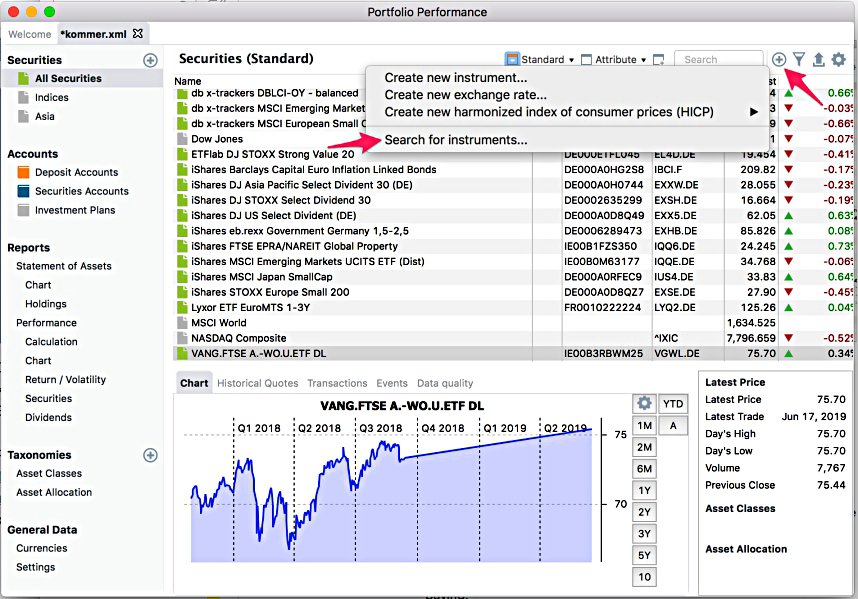
Securities
The securities tab lets you search for new instruments.
- The default search seems to use Yahoo Finance.
When you add a new security, you get the option to categorise it within various taxonomies (asset class, the asset allocation plan or by geography).
You can also add the source for historical quote data (which again will likely be Yahoo Finance).
- There’s also a “Latest Quote” tab, where again you can specify a provider (Yahoo by default).
Analysis
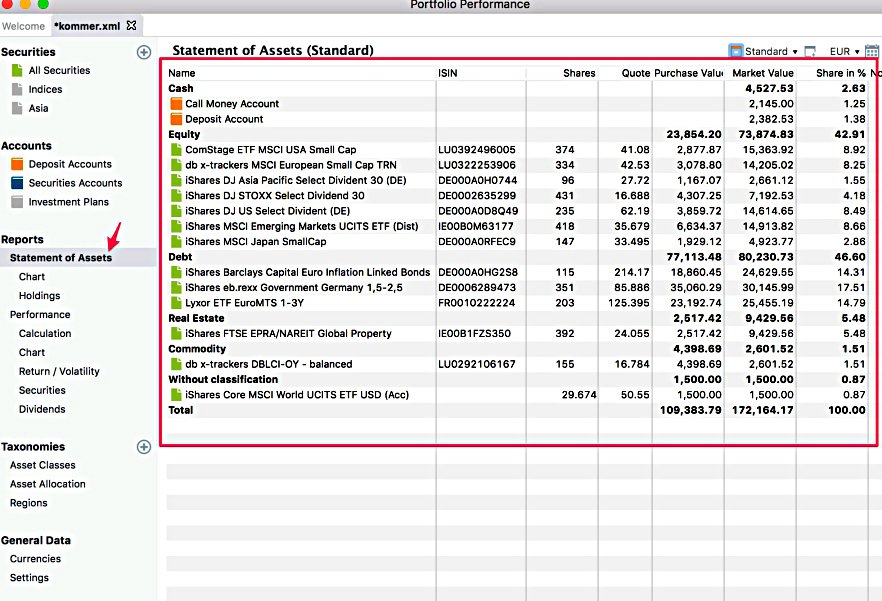
The statement of assets shows the global overview of all your open positions.
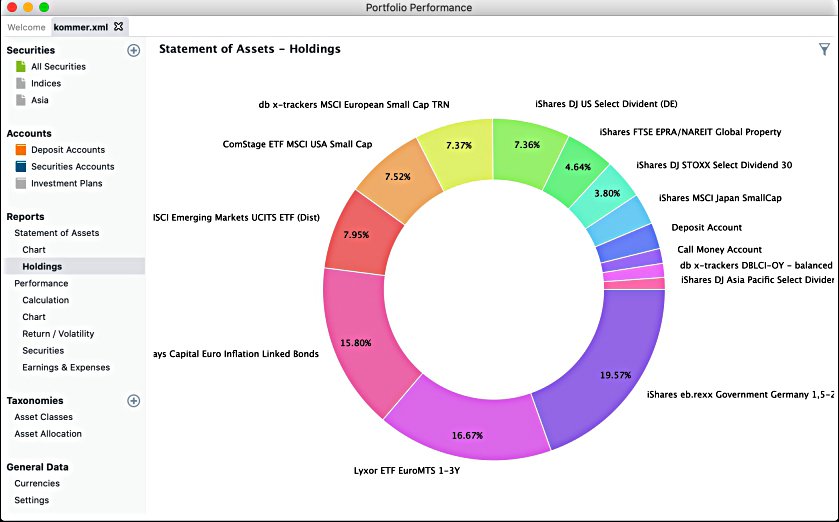
Lots of charts are available – here’s a pie chart from the holdings section.

Here are some performance numbers.
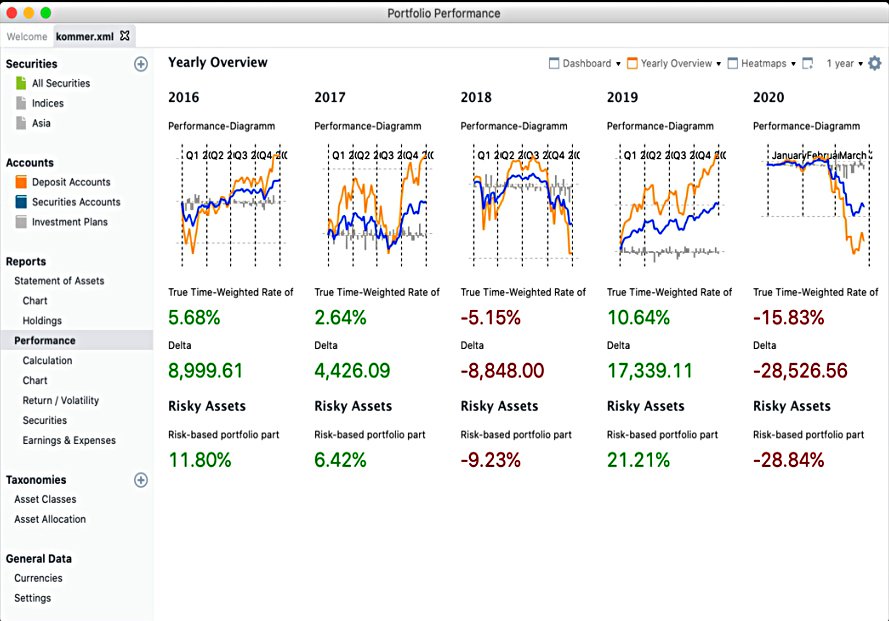
And here are some annual performance charts.
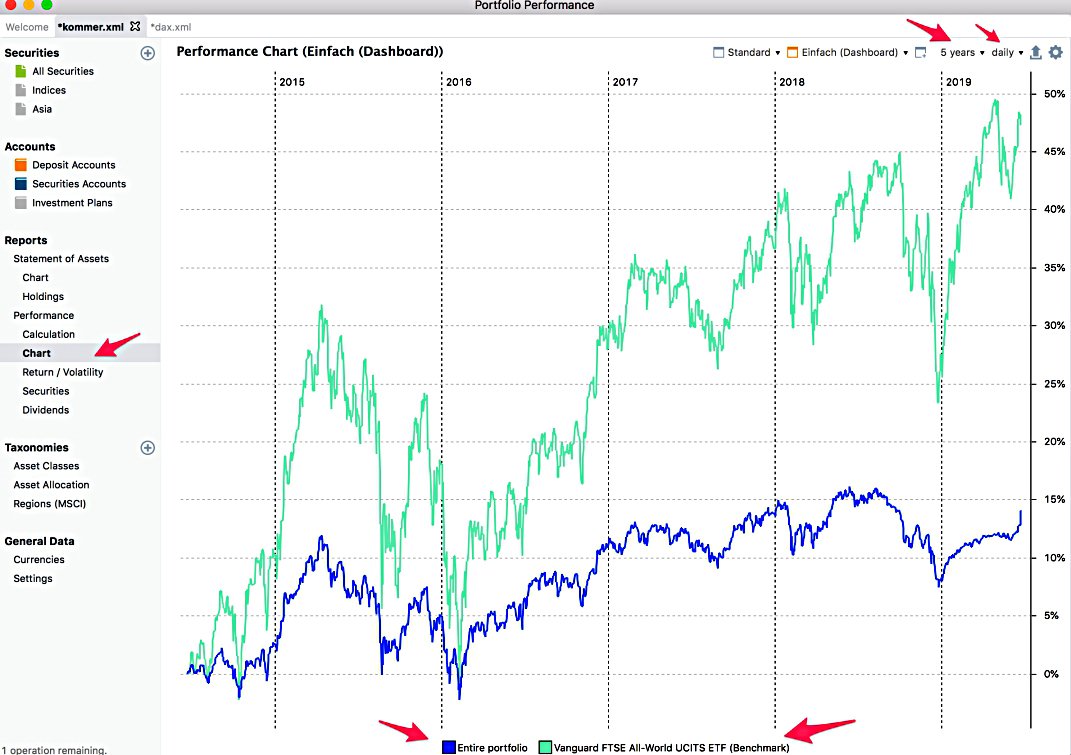
Here’s a line graph of performance against a benchmark.
Taxonomies
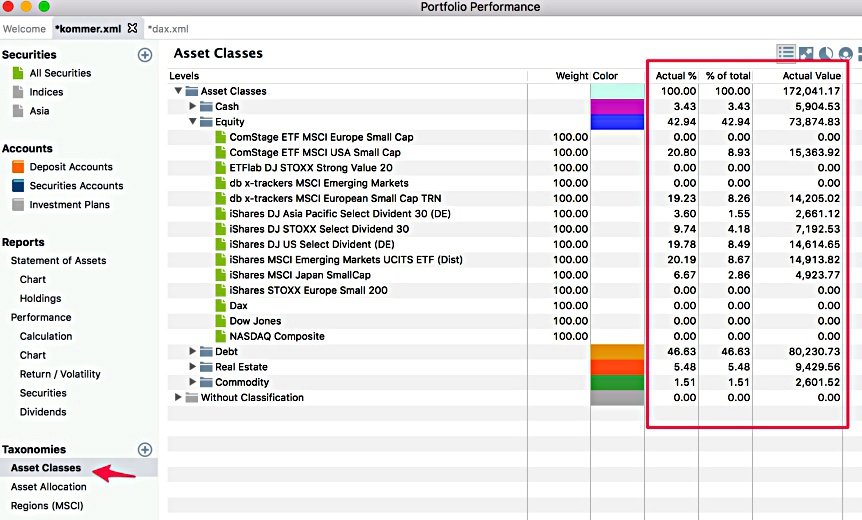
Asset Classes is the most obvious taxonomy.
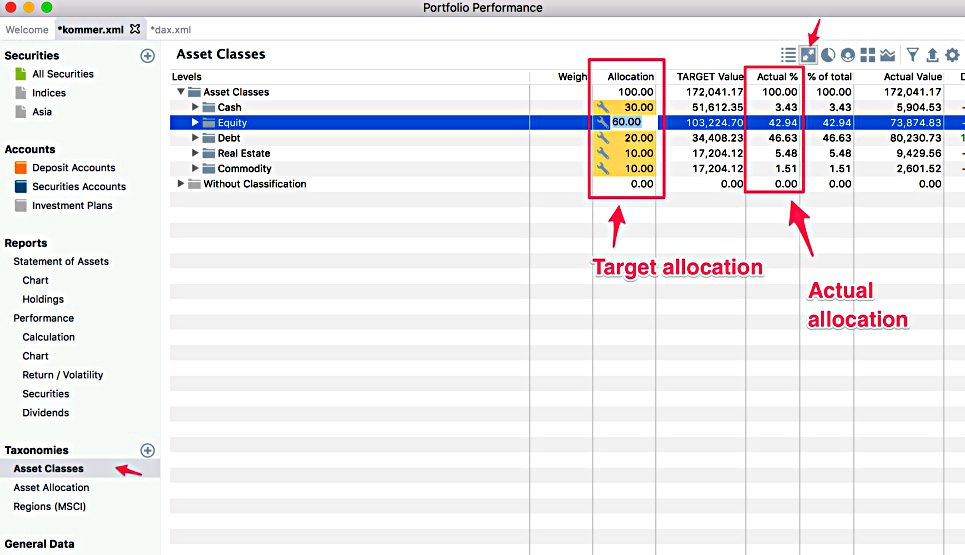
You can check your actual allocation against your target (for rebalancing).
- The app includes some other taxonomy templates, or you can create your own.
That’s it for today – Portfolio Performance looks like a useful tool.
- I’ll play around with the app for a few weeks using one of my real portfolios and if I still like it, then I’ll be back with an update.
Until next time.
Mike Rawson
Mike is the owner of 7 Circles, and a private investor living in London. He has been managing his own money for 40 years, with some success.