The Equity Edge 4 – Long-Term Valuation and Charts

Today’s post is our fourth visit to a new book – The Equity Edge by Mark Jeavons.
Long-term Valuation

![]()
Chapter 12 of Mark’s book looks at long-term valuation (10 years rather than two).
Mark targets an 8% return, made up of:
- 5% real return
- 2% inflation
- 1% margin of safety.
I think this is an ambitious target, but not wholly unrealistic.
Mark then adjusts this target upwards to compensate for inconsistencies in the historical record of profits, dividends and revenues.
- In effect, he increases his margin of safety for dodgier stocks.
In practice, he divides the base target of 8% by the percentage score for the stock.
- So a stock scoring 80% for historical consistency would need to deliver a return of 10% pa.
For high beta stocks (beta > 1), Mark also multiplies the return target by the stock’s beta.
- So a stock with a beta of 1.2 would have a 9.6% return target.
Growth assumptions
Mark’s process for calculating long-term value has much in common with the old-school value investing method.
- It relies on estimates for future growth in sales, earnings and dividends.
Mark first calculates historic CAGR rates for the three items over 5, 7 and 9 years.
Next, he calculates a “smoothed” CAGR using the average values for the most recent three years (1 to 3, average 2) compared to the averages for the oldest three years (8 to 10, average 9).
- This involves finding the seventh root (9 – 2) of the ratio of the new to the old average (2/9).
The CAGR Mark uses is the lowest of these four values (for each of the three items – sales, earnings and dividends).
For earnings growth, Mark adds a fifth number into the mix.
- “Long-run book value growth”, calculated by multiplying the average retained earnings ratio by the 5-yr average ROE
The retained earnings ratio is 1 – the five-year average dividend payout ratio.
- The earnings CAGR is the lowest of the five numbers.
For dividends, Mark sometimes adjusts the CAGR down to reflect the next two years of broker forecasts.
- If the lowest number is negative, Marl sometimes uses zero and sometimes uses the lowest positive number.
Earnings yield
Mark calculates future earnings yield (EBIT/EV) using broker forecasts for EBIT, EBITDA and the EV/EBITDA ratio.
- This earnings yield needs to exceed the earnings target derived from the 8% base, the historic consistency score and the stock’s beta.
Asset-based valuation
This approach is suitable for financial firms like banks and insurance companies, which can easily manipulate earnings.
- The method normally produces a more conservative valuation than Mark’s other methods.
Firms with lots of assets (utilities and property companies) can also be valued this way.
- Firms with few physical assets (such as tech firms) should not be valued using these measures.
Step 1 is to estimate the net tangible asset value per share (NAV ps) in ten years’ time.
- This involves compounding the current NAV at the long-term asset value CAGR.
Step 2 is calculating the EPS in ten years.
- This is the NAV ps in 10 years times the average ROE.
Step 3 calculates the “central price” in 10 years.
- This is the average PE ratio (over the past 5 years) times the earnings in 10 years time.
Step 4 calculates a low and high price in 10 years, using the low and high versions of PE over the past five years.
Step 5 looks at dividends over the next 10 years.
- The net asset value projected forward using its CAGR.
- The average ROE is used to calculate the annual earnings and hence EPS.
- The average payout ratio over the last five years is used to turn this into a dividend number for each year, and a total for the 10 years.
Step 6 calculates the 10-year return at the current share price.
- This is the central share price in 10 years plus the total dividends over the next years – together they make what Mark calls the “overall share price”.
- A more conservative valuation would use the lower PE valuation, rather than the average.
Step 7 calculates a maximum purchase price for the stock today – what Mark calls a “sticker” price.
- This is the “overall share price” discounted back to today by your required return percentage pa.
Earnings-based valuation
PE-based calculations only work when the earnings are positive, and high enough that the PE is meaningful.
- Nor should it be used for financial firms.
- Estimate EPS in 10 years
- Assume earnings compound at the long-term rate
- Estimate the central price in 10 years
- This is the average PE times the EPS in 10 years.
- Estimate a price range for 10 years in the future
- This is the earnings estimate times the low and the high PEs
- Estimate the dividends over the next 10 years
- You calculate the earnings for each of the next 10 years, using the earnings CAGR.
- Then multiply each year’s earnings by the average payout ratio to find the estimated dividends
- Estimate the return at the current share price
- The overall share price is the central share price in 10 years plus the total dividends over the next 10 years.
- Discount this back to the current share price to find the implied return.
- Work out a sticker (target) price using the required return percentage to discount the overall share price.
Sales-based fair valuation
Sales can be a more reliable indicator of growth as figures are harder to manipulate than earnings.
This sales-based method is useful for evaluating recovery situations [when] a company has no earnings (and no meaningful PE ratio). The ratio is less appropriate for service companies like banks or insurers that don’t really have sales.
- Estimate sales per share in 10 years
- Assume sales compound at the long-term rate
- Estimate the central price in 10 years
- This is the average price to sales over the last five years times the sales in 10 years’ time.
- Estimate a price range for 10 years in the future
- This is the sales estimate times the low and the high price-to-sales
- Estimate the dividends over the next 10 years
- You calculate the sales for each of the next 10 years, using the sales CAGR.
- Then multiply each year’s sales by the average profit margin to derive earnings and EPS.
- Then use the average payout ratio to find the estimated dividends.
- Estimate the return at the current share price
- The overall share price is the central share price in 10 years plus the total dividends over the next 10 years.
- Discount this back to the current share price to find the implied return.
- Work out a sticker (target) price using the required return percentage to discount the overall share price.
Dividend-based fair valuation
Mark has two versions of the dividend-based valuation.
- First up is the easy version, which gives a fair value price but no estimate of return over the next 10 years.
- Calculate the excess required return over the long-term dividend growth rate.
- Estimate the central price
- This is the current dividend divided by the excess return.
So if the dividend growth is 8% and the target return is 10%, the excess required return is 2%.
- If the price is 500p and the dividend is 20p (4%), then the central price is 20p / 2% = 1000p, and we would buy the share.
Mark also produces a range of fair value prices by adding and removing 25% to and from the long-term dividend growth rate.
Here’s the longer version.
- Work out the historic dividend yield range (dividends/share price)
- This is the highest and lowest number in each accounting year
- Average these two numbers across the previous five years.
- Then take the average of these two averages to derive the average dividend yield.
- Estimate dividends per share in 10 years
- Assume dividends compound at the long-term rate
- Estimate the central price in 10 years
- This is the average dividend yield over the last five years times the dividends in 10 years’ time.
- Estimate a price range for 10 years in the future
- This is the dividend estimate times the low and the high dividend yield numbers
- Estimate the dividends over the next 10 years
- You calculate the dividends for each of the next 10 years, using the dividend CAGR.
- Estimate the return at the current share price
- The overall share price is the central share price in 10 years plus the total dividends over the next 10 years.
- Discount this back to the current share price to find the implied return.
- Work out a sticker (target) price using the required return percentage to discount the overall share price.
Combining valuations
Valuation methods based on assets, earnings, sales and dividends produce different estimates for the expected investment return and sticker price. You will generally want to see at least two of the methods indicating that the current share price offers value.
Some methods may be less relevant to certain types of company and may be ignored.
It seems sensible to average the other valuations.
- Mark confesses to often using the method which gives a sticker price closest to the current share price in order to work out whether the likely return is over his hurdle rate.
Charting
Chapter 13 looks at charting, which Mark uses to analyse sentiment and help choose between growth and value strategies.
- He also wants to avoid investing during periods of bearish sentiment, when all stocks are likely to fall together.
Bullish sentiment (positive price momentum) indicates a good time to invest.

Mark uses weekly as well as daily charts and prefers the candlestick format to the regular OCHLV chart.
- He uses Trading View to generate charts.
As you can see, Mark likes a lot of moving averages on his charts.
Each weekly chart has two groups of moving averages: a short-term group representing the traders in the market and a long-term group representing the more conservative, longer-term investors.
Group 1 is 3, 5, 7, 9, 11 and 13-week MAs.
- Group 2 is 21, 24, 27, 30, 33 and 36 weeks.
Mark picked this system up from Australian trader Daryl Guppy, though the use of multiple moving averages seems to have been invented by Alan Hull (also Australian).
- As per regular MA systems, an uptrend exists when the short MAs are above the longer ones, and so is the price.
A downtrend has the long MAs heading down, with the short MAs and the price below them.
Under Guppy’s system, the long MAs are green when the long-term averages are in an uptrend.
- If the short MAs are also in an uptrend, they are coloured light blue.
If the long averages are heading down, they are red.
- If the short averages are heading down, they are orange.
I’ve never used the Hull/Guppy system, nor read one of their books, but I have met fans before.
- Something to add to my to-do list.
I’ve never used more than 3 MAs on a chart – usually 20, 50 or 60 and 200 days (4, 10/12 and 40 weeks).
- So from Mark’s list, I would probably choose 5, 11 and 36 weeks.
I also use the price relative to a single MA (particularly the 20 and 200 days MAs), which you might want to see as the 1-day MA.
Mark has some extra rules for a “strong” weekly uptrend:
- the investor moving averages are rising at an upward angle and are not close to horizontal, and
- the price width of the investor group of moving averages is widening or remains wide, signalling trend strength.
In contrast, for a strong downtrend:
- the investor moving averages are falling at a downward angle and are not close to being horizontal, and
- the price width of the investor group of moving averages is widening or remains wide, signalling trend strength.
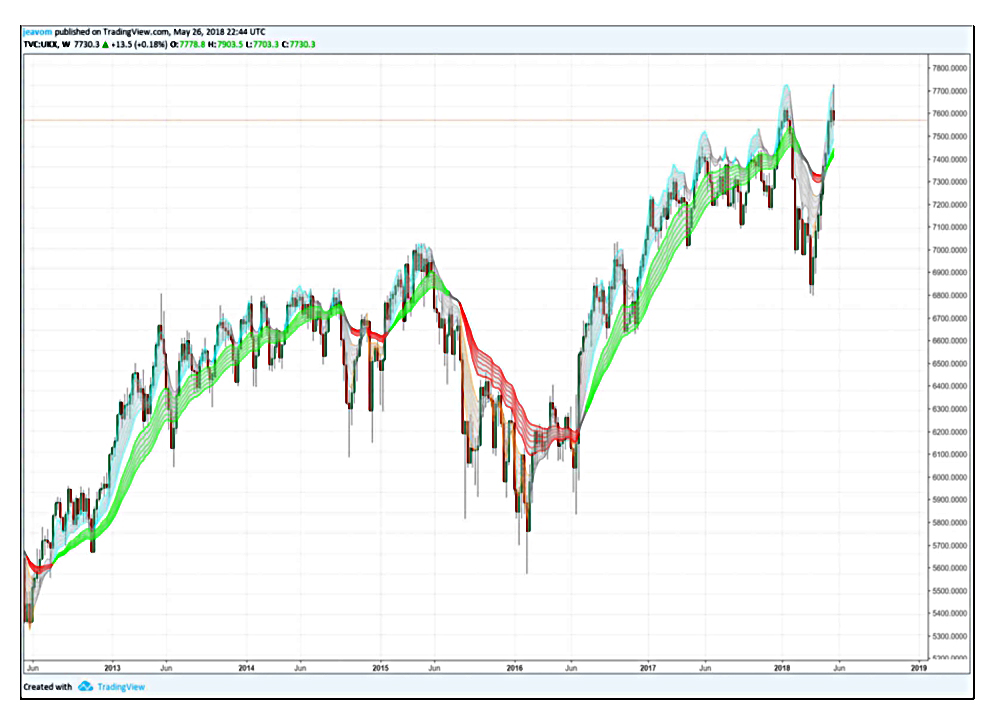
The chart shows the FTSE 100 during May 2018.
The primary trend is upward (as the long-term group has turned green) and the trader group of moving averages is above the investor group. The last weekly candlestick closed above the long-term group of moving averages.
The investor group of moving averages are rising on an upward trajectory and have started to widen, suggesting a strong upward trend. That said, prices have reached an area of price resistance, so some caution is needed.
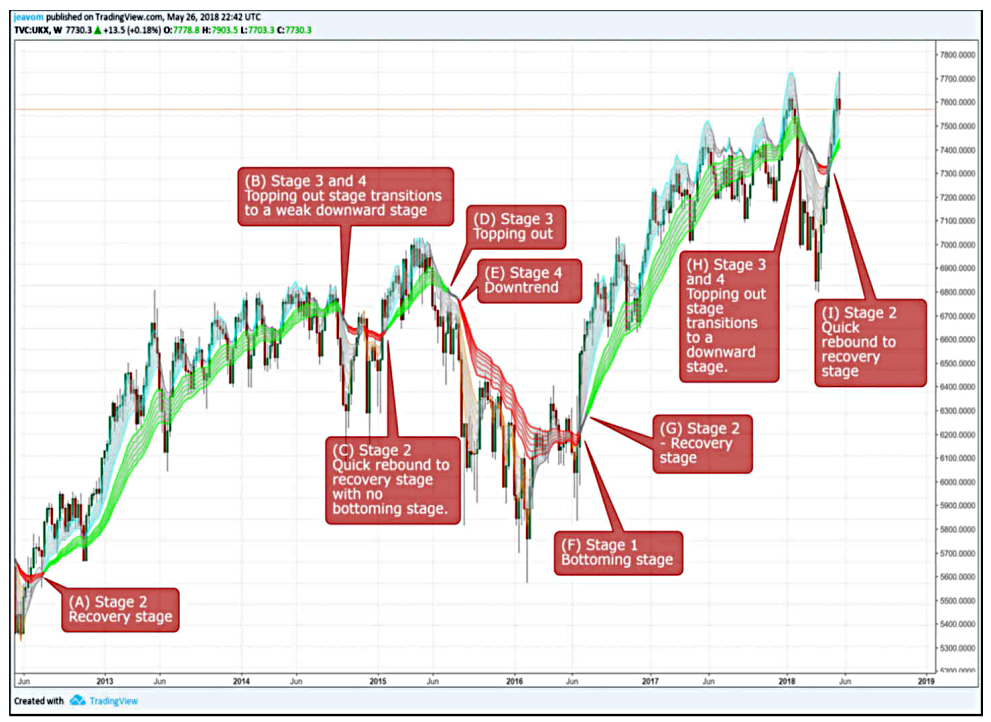
Stages
Mark also follows the stage or box philosophy (as per Darvas, Weinstein and more recently Minervini), which describes the market action in four stages:
- bottoming (sideways price action)
- the longer the bottom, the bigger the recovery should be
- income and value shares are favoured here
- recovery (upwards price action)
- switch to growth shares
- topping out (sideways)
- the trend may resume or come to an end
- bottoming (downwards price action)
- sell into cash
- no buys allowed, focus on research for the next recovery
Daily charts
Once the weekly chart is giving a buy signal, Mark switches to daily charts to time the entry.
- Mark also uses horizontal support and resistance here.
The long-term MA ribbons can be also be seen as indicators of trend support (on an upward chart) and resistance (on a downward chart).
On a daily chart, the short-term group of moving averages consists of three-, ve-, eight-, ten-, 12- and 15-day moving averages, while the long-term group consists of 30-, 35-, 40-, 45-, 50- and 60-day moving averages.
I’ve no idea why the MA periods don’t match to the weekly chart.
S1 – Buying dips in an uptrend
Mark offers three buying strategies, the first of which is buying dips in an uptrend.
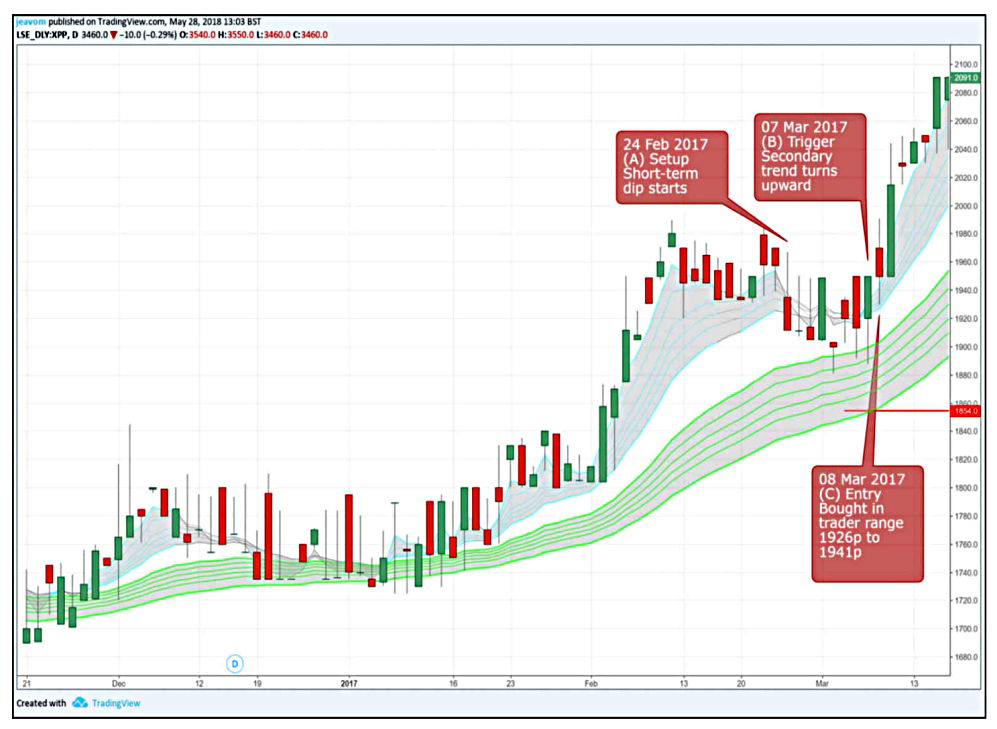
A short-term dip starts when the daily primary trend remains upward but the daily secondary trend transitions from upwards to sideways. When this happens, the trader group of moving averages changes colour, from blue to grey.
When the dip ends, the short term MAs turn blue again.
- Buy the next day.
Sell on a 20% price fall (ie. use a trailing stop).
- For growth companies, the stop can be just below the long-term MAs.
S2 – Buy a strong uptrend
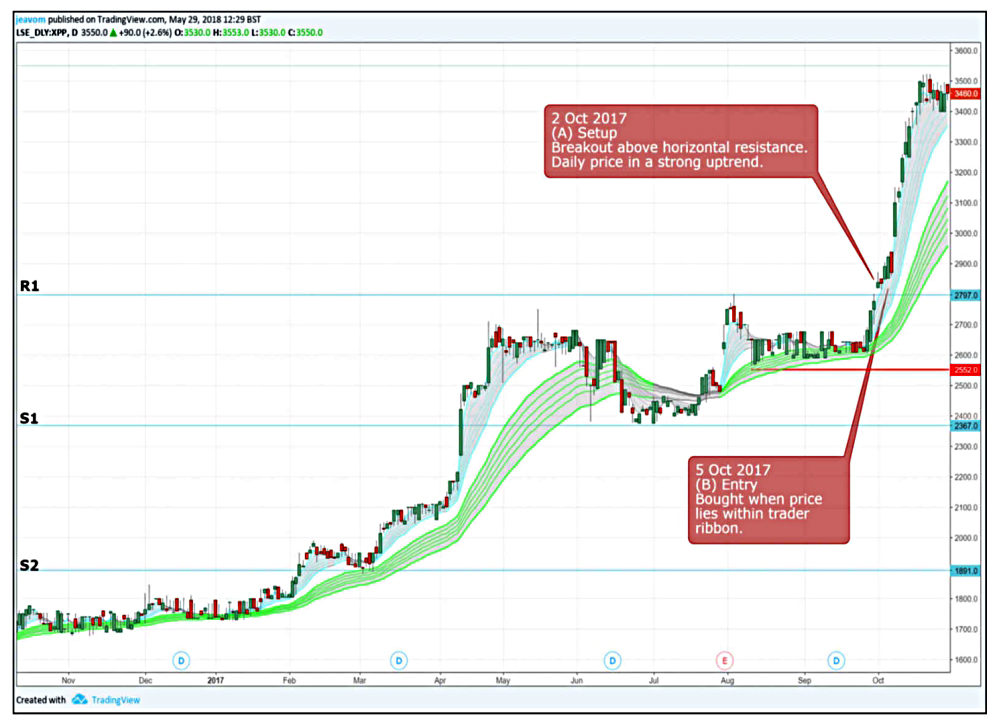
Mark likes to see strong relative strength against a benchmark (index) here.
- The stock price can be anywhere within the trader MA ribbon.
- The stop should be just below the investor ribbon.
S3 – Buying support during sideways trading
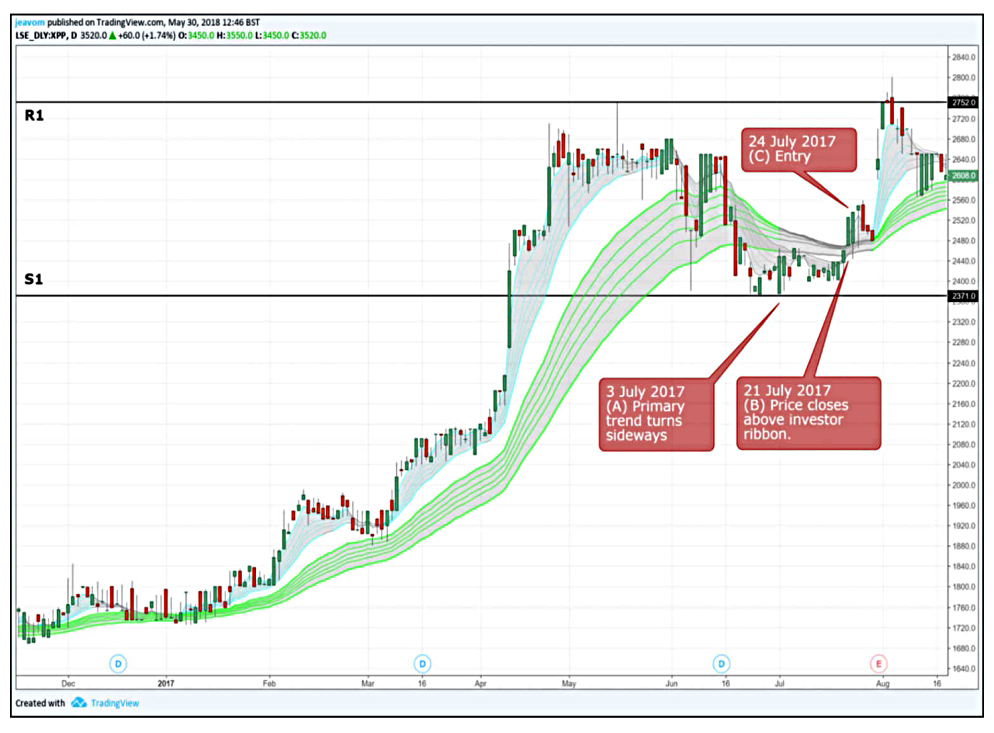
This strategy is normally applied to income and value companies.
For growth companies, you want to see a positive price trend already in place.
First, you define a trading range, using horizontal support and resistance.
- Then you wait for the price to close above the long MA ribbon, signalling a bounce from support.
This is swing trading.
- You can sell when the price reaches the top of the trading range or falls back to the bottom.
Conclusions
That’s it for today – we’ve covered two dense chapters today, but I’m afraid they haven’t been my favourites.
- I think that the days of building ten-year projections based on assumptions about sales, earnings and profitability may be over.
I don’t feel I have much visibility about earnings over the next six months at the moment.
The charting section was interesting, but the MA ribbons just look like easy to see versions of the traditional MAs, perhaps crossed with Bollinger bands.
- All TA chart indicators are based on the same underlying OCHLV data, and so there is a lot of overlap between them.
I must get around to looking at the Hull/Guppy system at some point in the future, but it’s not at the top of my list right now.
There are three chapters to go, and I hope to cover them in one final article (before the summary).
- After that, I’ll try to distil Mark’s advice into a few Stockopedia screens.
Until next time.
Mike Rawson
Mike is the owner of 7 Circles, and a private investor living in London. He has been managing his own money for 40 years, with some success.