The Trinity Portfolio

Today’s post is about the Trinity Portfolio, from Meb Faber over at Cambria Investment management.
Contents
Meb Faber

We’ve met Meb a couple of times before:
- We looked at his VAMO Hedge strategy,
- And we looked at his book that reviewed various asset allocation strategies.
Today we’re going to look at his firm’s Trinity Portfolio.
The Trinity Portfolio
The first post I read about the Trinity Portfolio came off the back of that book, which Meb described as “too short”:
I would like to have included a lot more tactical ideas in the book but there is a constant struggle between keeping an idea/book simple, but satisfying the supernerds like me.
He had been quoted as saying that:
An allocation of 1/3 global stocks, 1/3 global bonds, and 1/3 trend strategies is a pretty hard allocation to beat.
The Trinity Portfolio idea grew out of Meb being asked to expand on that statement. (( He sourced the name of the strategy on Twitter ))
Global market portfolio
Meb’s starting point is the global market portfolio, which I take to mean the listed investable financial world.
- Cullen Roche has written several times that the true global portfolio is not accessible, and therefore there is no such thing as a truly passive investor.
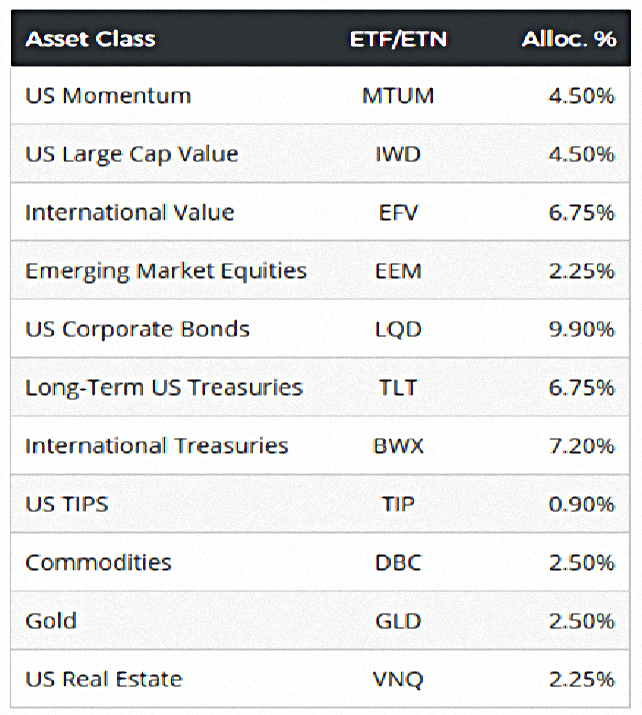
Meb’s book is called Global Asset Allocation, and he describes the GAA portfolio as:
The global market cap portfolio with commodities added.
Here it is:
- US Large Cap 18%
- Foreign Developed 13.5%
- Foreign Emerging 4.5%
- Corporate Bonds 19.8%
- 30 Year Bonds 13.5%
- 10 Year Foreign Bonds 14.4%
- TIPs 1.8%
- REITs 4.5%
- Commodities 5%
- Gold 5%
This is obviously created from a US perspective, and it has way too much allocated to bonds for my purposes.
- The future real rate of return on this portfolio is likely to be below my target SWR of 3.25% pa.
But that’s easily fixed with a 20% cap on bonds, and the GAA is a useful starting point.
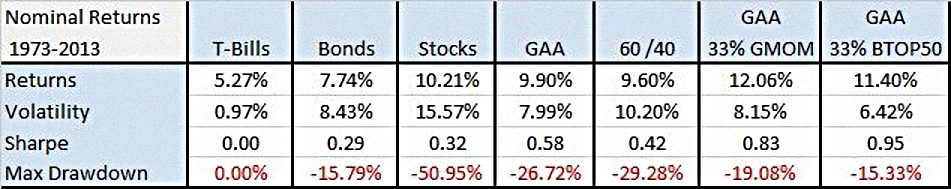
Here’s a table of returns:
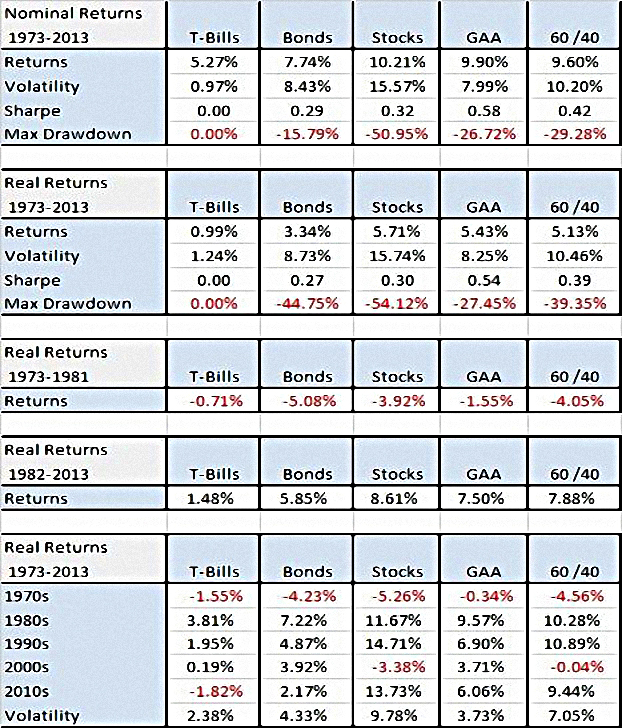
GAA beats a 60/40 stock bond portfolio on all the measures:
- Higher returns
- Lower volatility
- Higher Sharpe (SR)
- Lower maximum drawdowns
The Trinity Portfolio
“Trinity” is a reference to the three core elements of the portfolio: 1) assets diversified across a global investment set, 2) tilts toward investments exhibiting value and momentum traits, and 3) exposure to trend following.
The Trinity Portfolio isn’t a 33/33/33 portfolio.
Instead, Meb uses the GAA as an improved version of the 50/50 stock/bond portfolio, then adds in trend following.
- The amount of trend following ranges from 20% to 74% (see below).
Many investors expect basic trend strategies to magically “time the market.”
However, a trend strategy is not meant to be an outperformance strategy – rather, it is designed to produce similar returns as buy-and-hold, yet with lower volatility and smaller drawdowns.
Trend data doesn’t go back as far as Meb would like, so he uses two indices / rules I haven’t heard of:
- BTOP50 and GMOM (global momentum)
GMOM invests in the top half of GAA assets ranked on momentum if they are above their long term trend (200-day MA) – otherwise it stays in cash.
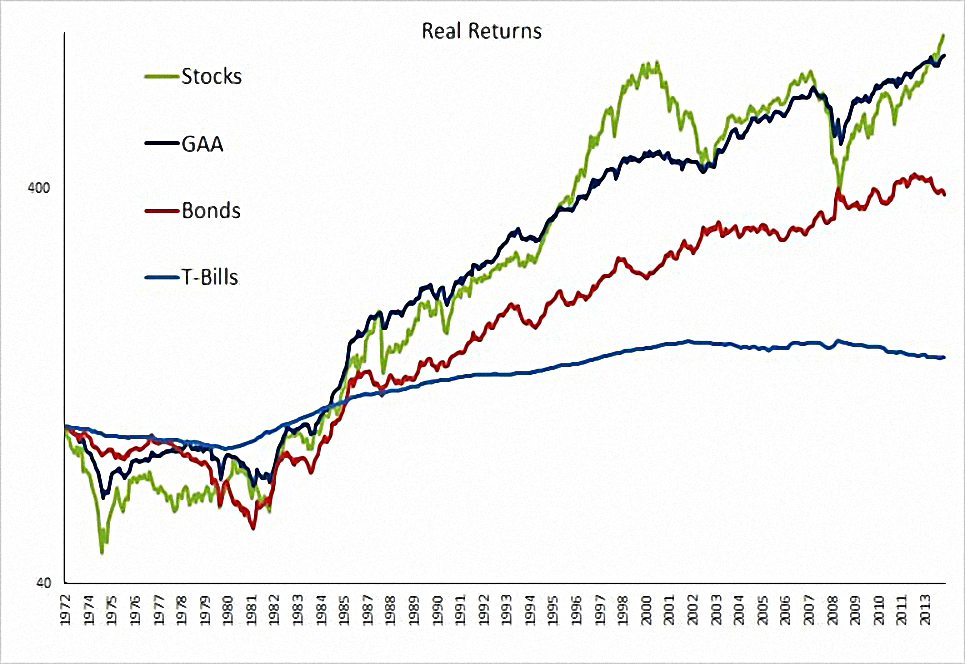
The results are spectacular – better than GAA, 60/40 and even than 100% stocks.
The trend component helps keep volatility low, but more importantly reduces drawdowns.

Meb also points out that addition of trend helps psychologically, by having a portion of the portfolio that is “doing” something during bear markets.
Even if you think that trend will not add any return or risk benefits, there can still be behavioral benefits to adding the system.
The best investment strategy is the one that you’ll be able to stick with, year-in-year out. That makes it dangerous to tilt too heavily in either direction – there will be years when one style underperforms the other.
Our natural tendency as emotionally-based investors would be to jump ship, abandoning our approach, often at the wrong time.
Improvements
Meb says that moving away from market cap weights in stocks and bonds will add another 1% to 2% pa to the Trinity system.
Market cap weightings often allocate to more heavily to over-priced assets. Simple value and momentum tilts can add a lot of value within asset classes.
This is essentially the VAMO (value and momentum) base of the VAMO Hedge strategy that we looked at in an earlier post.
Products
Cambria now offer six variations (levels) on the Trinity portfolio to their direct clients, plus a “Trinity digital portfolio” (again, with six variations) through Betterment.
On the conservative end of our continuum (Trinity 1), you’ll find the asset mix dominated by bonds. Trinity 1 contains the least exposure to trend following, and instead, is more of a buy-and-hold portfolio.
On the aggressive end of our continuum (Trinity 6), you’ll find the asset mix dominated by stocks. Trinity 6 also contains the greatest exposure to trend following.
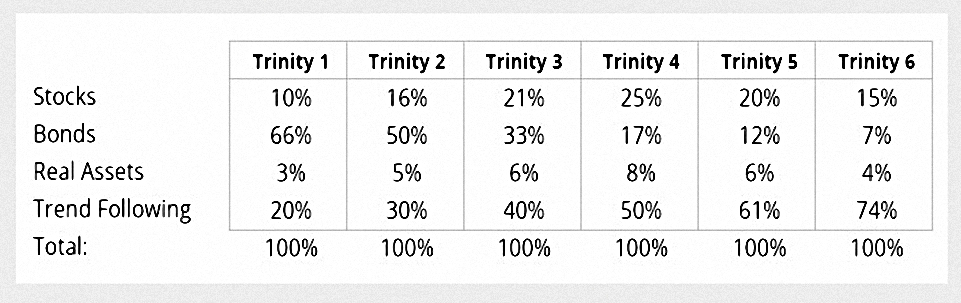
The trend following percentage ranges from 20% to 74%, with an average around 45%.

Fees range from 0.38% pa (in a tax-exempt account) for Trinity 1, up to 0.81% pa for Trinity 6.
There’s also a Trinity ETF (TRTY) that’s set between levels 3 and 4 of the internal portfolios (“moderate risk”).
- This is a 0% “fund of funds” with a TER of 0.66%
None of this is directly available in the UK, I’m afraid – though it should be possible to buy the US-listed ETF.
Performance
Here’s a recent chart (from the December 2018 report) showing the performance of the six funds over the last two years or so:
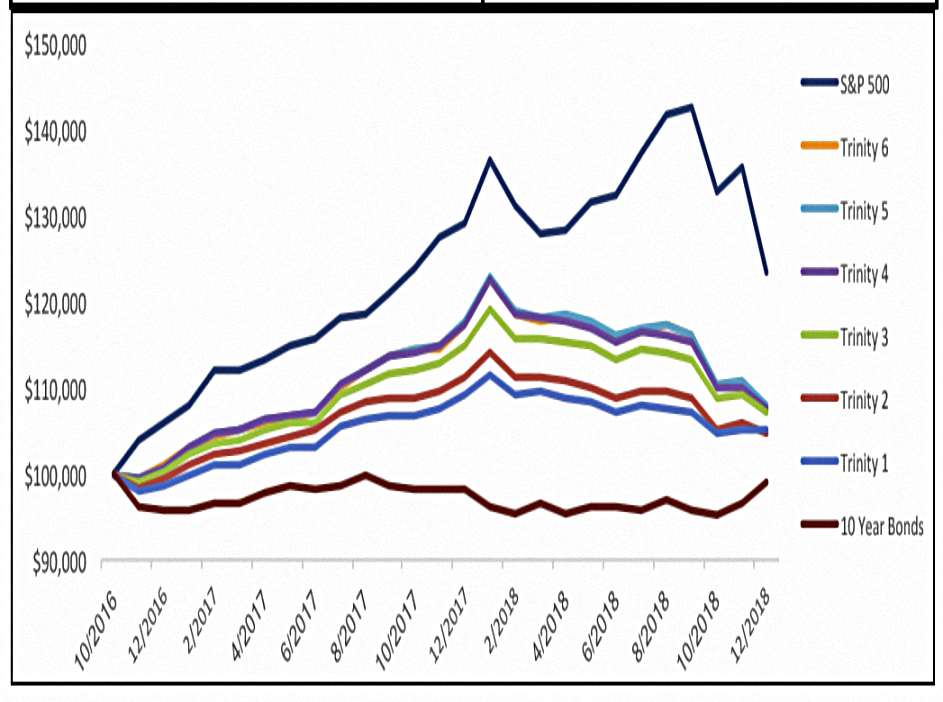
Allocate Smartly, a site that looks at ETF strategies, also did a test of the Trinity approach:

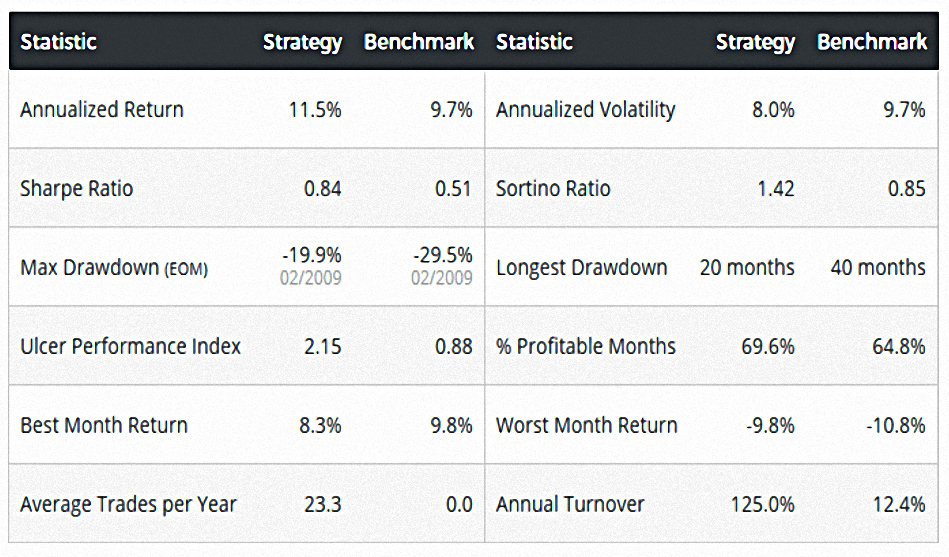
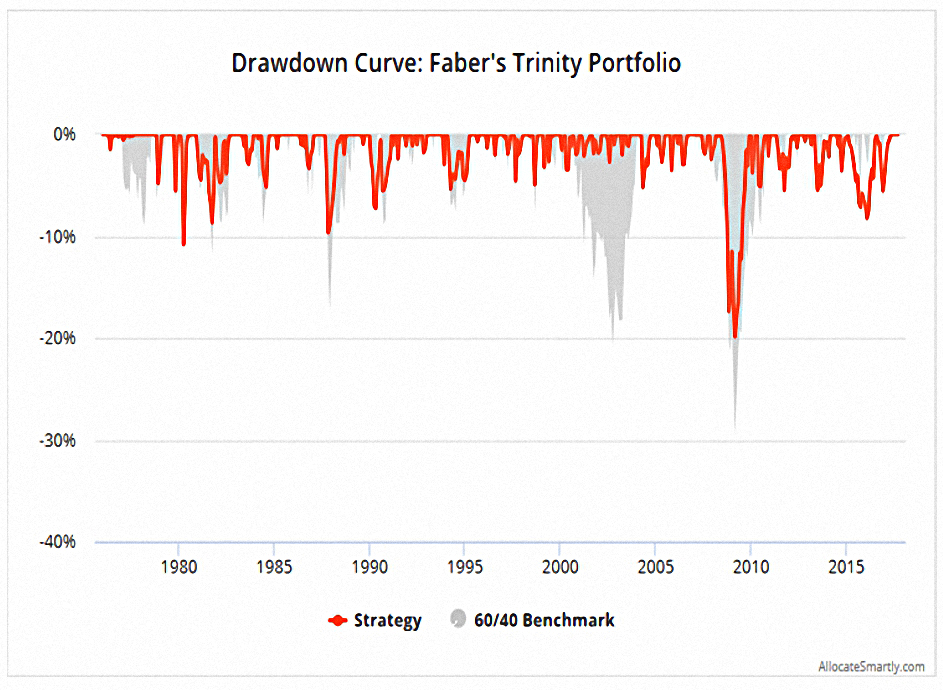
I’m going to call that a pass.
Meb’s Portfolio
Meb publishes his own listed portfolio each year, but he has wealth elsewhere:
My net worth is dominated by my ownership in Cambria Investment Management. Next in line would be farmland and real estate owned with my two brothers. I also hold equity stakes in a few other private companies.
On the liquid side, I have 100% invested in our funds.
His listed portfolio was historically broadly split into two:
- 50% buy and hold (with tilts)
- 50% trend and tactical strategies
I use a similar core and satellite approach, but I haven’t yet developed enough confidence in my active strategies to allocate 50% of my portfolio to them.
Meb updates his allocations every year, and at various points I’ve seen:
- tactical / trend / momentum between 44% and 60% (via a private hedge fund which partially invests in Cambria’s ETFs)
- value at 20% to 25%
- yield at 13% to 20%
- GAA at 18%
After the Trinity ETF was launched, Meb moved most of his money into that.
Conclusions
The Trinity Portfolio is yet more evidence that adding a trend-following element to a diversified base (passive) portfolio enhances returns and SR whilst reducing volatility and max drawdowns.
I like the GAA fine as a base portfolio, but I prefer my version of Rob Carver’s handcrafting approach.
- I’ve dubbed this The Perfect Portfolio.
I’m in the process of working my way up from zero allocation to active strategies (around four years ago, when I started this blog) to Meb’s 20% to 74% allocation.
- I have at least one more year to go to reach that lower bound, and I don’t ever expect to reach the upper one.
Until next time.
Mike Rawson
Mike is the owner of 7 Circles, and a private investor living in London. He has been managing his own money for 40 years, with some success.