Trading For A Living #2 – More Psychology and Charts
Today’s post is our second visit to Trading for a Living by Alexander Elder. Today we look at mass psychology and classic charting.
Contents
Mass Psychology

Price
A trade occurs when there is a momentary meeting of two minds: an eager bull agrees to a seller’s terms and pays up, or an eager bear agrees to a buyer’s terms and sells a little cheaper.
The crowd of undecided traders makes buyers and sellers more willing to deal with their opponents.
Each price is a momentary consensus of value of all market participants, expressed in action. The patterns of prices and volume reflect the mass psychology of the markets.
Buyers are buying because they expect prices to rise. Sellers are selling because they expect prices to fall.
Technical analysis is similar to poll taking. They are partly scientific because we use statistical methods and computers; they are partly artistic because we use personal judgment and experience to interpret our findings.
The goal of a serious technical analyst is to discover the balance of power between bulls and bears and bet on the winning group.
A wise trader enters a trade only when he is reasonably sure which side is likely to win.
Crowds
When you analyze the market, you are looking at crowd behavior. Crowds behave alike in different cultures on different continents. Social psychologists have uncovered several laws that govern crowd behavior, and a trader needs to understand them.
Most people feel a strong urge to join the crowd and “act like everybody else. This primitive urge clouds your judgment when you put on a trade.
People change when they join crowds.They become more credulous and impulsive, anxiously search for a leader, and react to emotions instead of using their intellect.
A successful trader must think independently and carry out his trading decisions. Successful traders are independent thinkers.
At the same time, never buck a trend.
The battle
The money you want to make belongs to other people who have no intention of giving it to you. Trading means trying to take money from other people, while they are trying to take yours.
Trading means battling crowds of hostile people, while paying for the privilege of entering the battle and leaving it.
Insiders
People who trade on inside information are stealing our money.
Charts reflect all trades by all market participants – including insiders. Technical analysis can help you detect insider buying and selling.
Traders
The average private futures trader in the United States is a 50-year-old, married, college-educated man.
Rational reasons for trading include the desire to earn a large return on capital. Irrational reasons include gambling and a search for excitement.
Professional traders are extremely serious about what they do. They satisfy their irrational goals outside the markets.
Institutional traders pay low commissions and can afford the best research and the largest intelligence network. They also a psychological advantage – their own money isn’t at risk.
The Achilles heel of most institutions is that they have to trade, while an individual trader is free to wait for the best opportunities.
Most traders who leave institutions get caught up in the emotions of fear, greed, elation, and panic when they start risking their own money. They seldom do well trading their own accounts – another sign that psychology is at the root of trading success.
Few institutional traders realize to what a large extent they owe their success to their trading managers, who control their risk levels.
Software
There are three types of trading software.
A toolbox allows you to display data, draw charts, plot indicators, change their parameters, and test your trading systems.
What goes on inside a black box is secret.You feed it data, and it tells you what and when to buy and sell.
Black boxes are usually sold with excellent track records, since they were created to fit old data. Markets keep changing, and black boxes keep blowing up.
Gray boxes are usually put out by prominent market personalities.They disclose the general logic of the system and allow you to adjust some of the parameters.
The implication is that all you might need is a toolbox.
Elder is equally dismissive of newsletters.
- He used to write one, and was to told to spend less time on research, and more on marketing.
Divergence
Several technical indicators identify tops by tracing a pattern called bearish divergence. It occurs when prices reach a new high but the indicator reaches a lower high than it did on the previous rally.
Bearish divergences mark the ends of uptrends and some of the best shorting opportunities.
Bullish divergence occurs when prices fall to a new low but an indicator traces a shallower bottom than during the previous decline. Bullish divergences identify some of the best buying opportunities.
Technical analysis
A technical analyst is an applied social psychologist, armed with a computer.
Technical analysts believe that prices reflect everything known about the market, including fundamental factors. Each price represents the consensus of value of all market participants.
Technical analysis is a study of mass psychology. It is partly a science and partly an art.
Forecasts
Amateurs in most fields ask for forecasts, while professionals simply manage information and make decisions based on probabilities.
Take medicine. A patient is brought to an emergency room with a knife wound. Anxious family members have only two questions: “will he survive?” and “when can he go home?”
But the doctor isn’t forecasting – he is managing problems as they emerge.
Classical Chart Analysis
Elder remembers using a ruler and pencil to draw lines on charts.
- I started that way, too – back in the 1980s.
Elder moved on to a Texas Instruments programmable calculator, and then to real computers.
He prefers computerised charts for their objectivity:
A moving average or any other indicator is either rising or falling, and there can be no argument about its direction. You may puzzle over how to interpret its signals, but the signals themselves are clear as day.
In contrast “classical” charting is subjective, and:
It invites wishful thinking and self-deception. Because of their subjectivity, I’ve grown increasingly skeptical of claims regarding classical formations, such as pennants, head-and-shoulders, etc.
Most traders use charts as a giant Rorschach test.They project their hopes, fears, and fantasies onto the charts.
What works
Early chartists wrote that stock market tops were sharp and fast, while bottoms took a long time to develop. That was true in their deflationary era, but the opposite has been true since the 1950s. Now bottoms tend to form quickly, while tops tend to take longer.
The market doesn’t know diagonals. It remembers price levels, which is why horizontal support and resistance lines make sense, but diagonal trend lines are subjective.
The relationship between the opening and closing prices and between the high and the low points of a price bar or a candle are also objective.
The bar
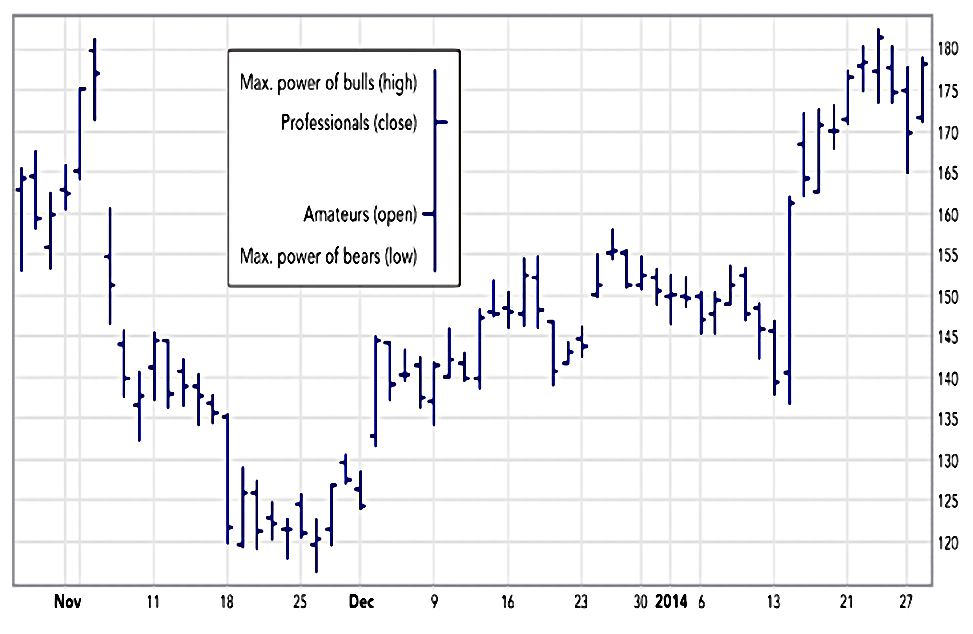
The opening price of a daily bar tends to reflect the amateurs’ opinion of value. Amateurs are especially active early in the day and early in the week.
Opening prices most often occur near the high or the low of the daily bar. Buying or selling by amateurs early in the day creates an emotional extreme from which prices tend to recoil later in the day.
In bull markets, prices often make their low for the week on Monday or Tuesday, when amateurs take profits from the previous week, then rally to a new high on Thursday or Friday.
In bear markets, the high for the week is often set on Monday or Tuesday, with a new low toward the end of the week.
The closing prices of daily and weekly bars tend to reflect the actions of professional traders. Many of them take profits in the last hour of trading to avoid carrying trades overnight.
Professionals tend to buy lower openings, sell short higher openings, and unwind their positions as the day goes on. It pays to trade with the professionals and against the amateurs.
The distance between the high and the low of any bar reflects the intensity of conflict between bulls and bears.An average bar marks a relatively cool market.
A bar that’s only half as tall as average reveals a sleepy, disinterested market. A bar that’s two times taller than average shows a boiling market where bulls and bears battle all over the field.
Slippage tends to be less in quiet markets. It pays to enter trades during short or normal bars. Tall bars are good for taking profits.
Candlesticks
Japanese rice traders began using candlestick charts some two centuries before the first chartists appeared in America.
The Japanese consider highs and lows relatively unimportant. They focus on the relationship between opening and closing prices and on patterns that include several candles.
Many candlestick chartists neglect Western tools, such as volume and technical indicators.
Elder learned on bar charts, and he’s sticking with them.
Efficient Markets etc.
The logical flaw of Efficient Market theory is that it equates knowledge with action. People may have knowledge, but the emotional pull of the crowd often leads them to trade irrationally.
An intelligent observer can identify repetitive behavior patterns of a crowd and make sensible bets on their continuation or reversal. People have memories; they remember past prices, and their memories influence their decisions to buy or sell.
Markets are chaotic much of the time, but out of that chaos, islands of order and structure keep emerging and disappearing. If you trade during chaotic periods, the only one to benefit will be your broker.
Market patterns are fractal. You will not be able to identify a monthly, weekly, daily, or a 5-minute chart. That’s why it is so important to analyze markets in more than one timeframe.
Support and Resistance
Support is a price level where buying is strong enough to interrupt or reverse a downtrend. It appears on a chart as a horizontal line connecting two or more bottoms.
Resistance is a price level where selling is strong enough to interrupt or reverse an uptrend. It’s a horizontal line connecting two or more tops.
Elder doesn’t like trend lines (too subjective), preferring exponential moving averages.
It is better to draw support and resistance lines across the edges of congestion areas where the bulk of the bars stopped rather than across extreme prices. Those congestion zones show where masses of traders have changed their minds.
Support and resistance exist because people have memories.
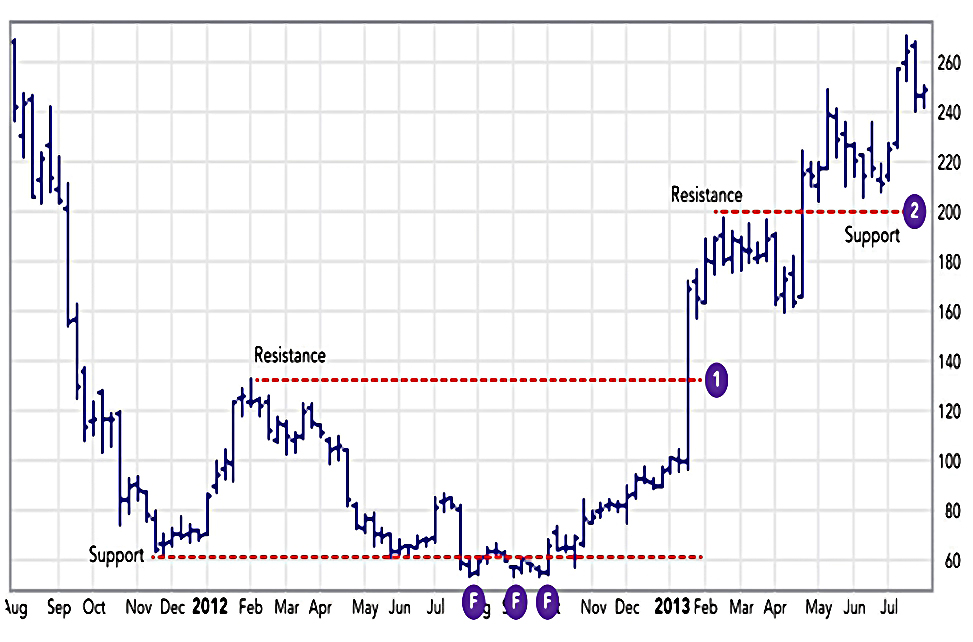
Support and resistance areas often switch roles. After a decisive upside breakout in area 1 (on the chart above) prices hit resistance, but when they broke above that level it turned into a zone of support (2).
Beware of false breakouts from support and resistance (marked “F” on the chart). Amateurs tend to follow breakouts, while professionals tend to fade (trade against) them.
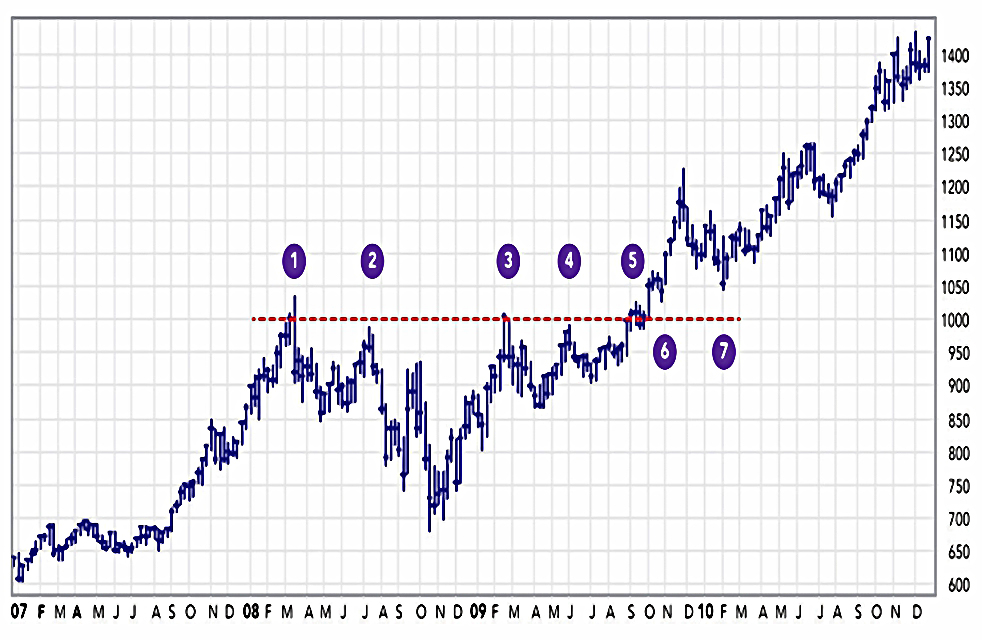
In this gold chart, the price hit resistance five times.
- Most reversals occur on the first three visits.
- A fourth test indicates great pressure to break through.
After the price of gold broke above that level on its fifth attempt, the level of $1,000/oz turned into a massive support level.
Support and resistance exist because traders feel pain and regret.Losers are determined to get out as soon as the market gives them another chance.
Traders who missed an opportunity to buy or sell short feel regret and also wait for the market to give them a second chance.
When the market stays flat for a while, traders get used to buying near the lower edge of its range and selling or even shorting near the upper edge. When an uptrend begins, bears who sold short feel a great deal of pain.
Bulls feel an intense regret that they didn’t buy more. Both are determined to buy if the market declines to the breakout point and gives them a second chance.
This is support. The opposite reactions to a break downwards create resistance.
Strength
The longer prices stay in a congestion zone, the stronger the emotional commitment of bulls and bears to that area.The strength of those zones depends on three factors: their length, height, and the volume of trading that has taken place in them.
As support and resistance levels grow very old, they gradually become weaker. Losers keep washing out of the markets, replaced by newcomers who don’t have the same emotional commitment.
The strength of support and resistance also increases each time that area is hit.
Height also matters:
If a congestion zone’s height equals one percent of current market value, it provides only minor support or resistance. If it’s three percent tall, it provides intermediate support or resistance, and a congestion zone that’s seven percent tall or higher can grind down a major trend.
Trading rules
Elder suggests:
- When your trend approaches support or resistance, tighten your stop.
- Assign more weight to support and resistance on the longer-term charts (weekly).
- False (failed) breakouts are buying opportunities (ie. fade the breakout).
- The extreme of the failed breakout should be used as a stop.
- Don’t place stops at round numbers.
- You want your stop to be at the far end of a cluster of stops.
True breakouts
The best time to buy an upside breakout on a daily chart is when the weekly chart suggests that a new uptrend is developing. True breakouts are confirmed by heavy volume, while false breakouts tend to have light volume.
In true breakouts technical indicators reach new (confirmatory) extremes, while false breakouts are often marked by divergences.
Trading ranges
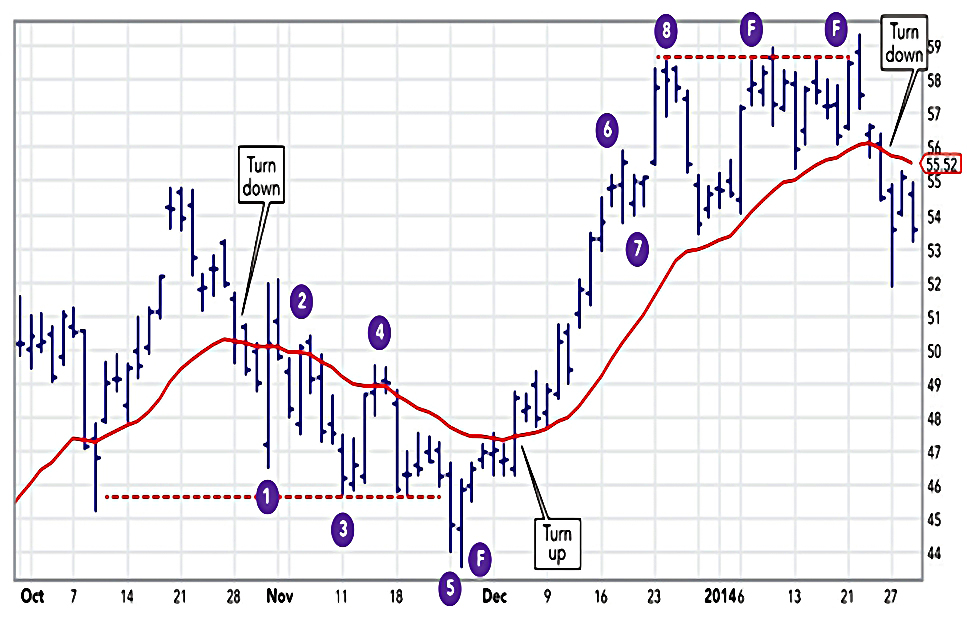
The chart shows a down trend (1 to 5) followed by an uptrend (6 to 8). The red line is a 22-day EMA. F is a failed / false breakout – they signal buying / shorting opportunities.
Trends have higher highs (or lower lows).
- In trading ranges rallies / declines repeatedly stop around the same level.
Markets spend most of the time in trading ranges. In a trading range, you have to use tight stops, and close out positions at the slightest sign of a reversal.
You have to follow strength during trends – buy in uptrends and short in downtrends. When prices are in a trading range, you aim to do the opposite – buy weakness and sell strength.
Trends and ranges are easy to see in the middle of a chart, but as you get close to its right edge,the picture becomes increasingly foggy. Many chart patterns and indicator signals contradict one another at the right edge.
You have to base your decisions on probabilities. Most people are very uncomfortable with uncertainty. They hang onto losing positions. Professional traders get out fast.
Trend identification
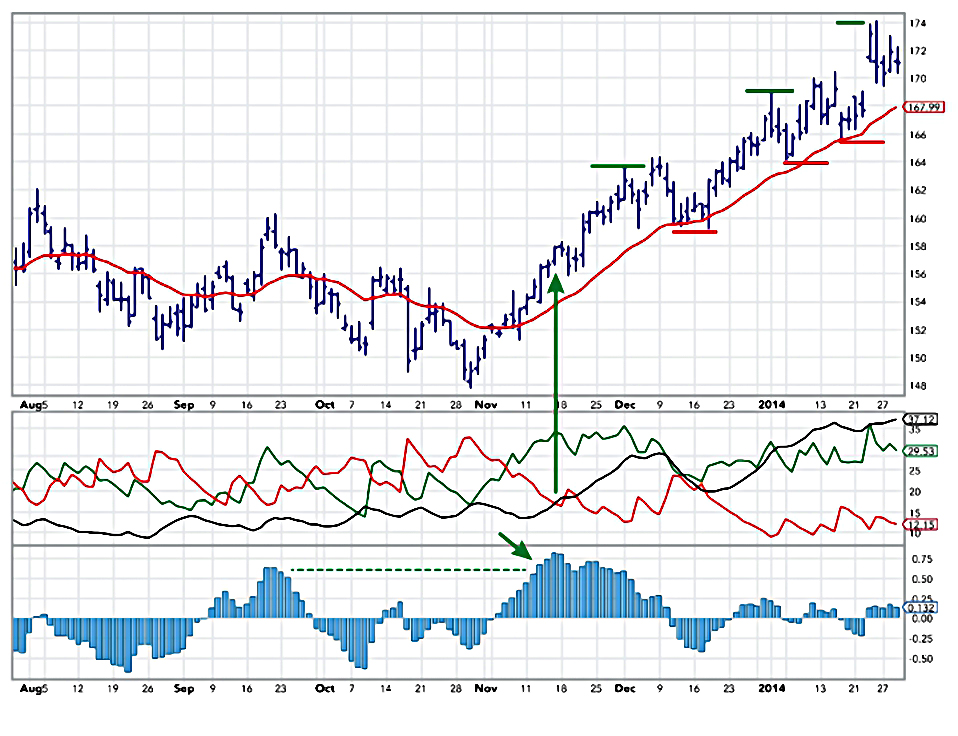
In the chart above, Elder is using two indicators to find trends:
- The Average Directional Index (ADX) and
- The MACD oscillator.
The price dips to the 22-day EMA are buying opportunities.
- Elder recommends 20- to 30-day EMAs.
- If the EMA shows no new high / low in the past month, you are in a trading range.
Having identified an uptrend, you need to decide whether to buy immediately or wait for a dip.
If the market is in a trading range and you’re waiting for a breakout, you’ll have to decide whether to buy in anticipation of a breakout, during a breakout, or on a pullback after a valid breakout.
Consider entering in several steps: buy a third of the planned position in anticipation, a third on a breakout, and a third on a pullback.
Finding good entry points is extremely important in trading ranges. A trend is more forgiving of a sloppy entry.
When trend trading, it pays to put on smaller positions with wider stops. You’ll be less likely to get shaken out.
You may put on bigger positions in trading ranges but with tighter stops.
Most traders ignore the fact that markets move in different directions at the same time in different time frames. They pick one timeframe, such as daily or hourly, and look for trades there.
Before examining a trend on your favorite chart, step back to explore the charts in a timeframe one order of magnitude greater than your favorite.
When professionals are in doubt, they look at the big picture, while amateurs tend to focus on the short-term charts.
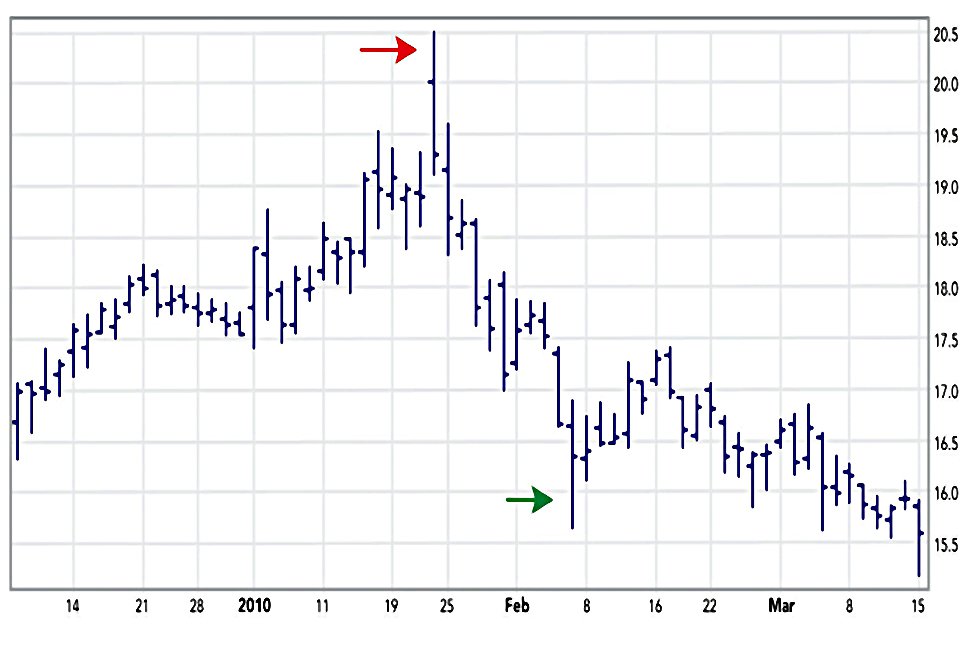
Kangaroo Tails
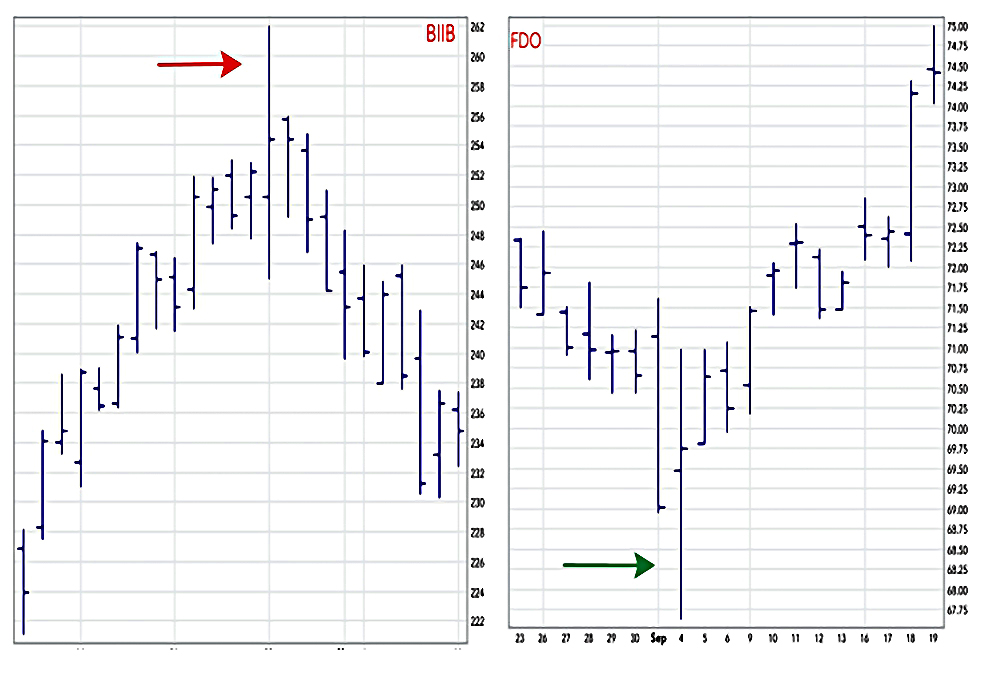
A kangaroo tail (or finger) is a single, very tall bar, flanked by two regular bars, that protrudes from a tight weave of prices. Kangaroo tails reflect failed bull or bear raids.
Upward-pointing kangaroo tails flash sell signals at market tops, while downward- pointing kangaroo tails occur at market bottoms.
The longer the time frame, the more meaningful its signal.
As soon as you recognize a tail, trade against it. Place your protective stop about halfway through the tail.
An experienced trader can recognize a kangaroo tail during its third bar, before it closes.
Remember that trading against the tails is a short-term tactic; on the daily charts, these signals fizzle out after a few days.
Conclusions
That’s it for today.
- We’re more than a quarter of the way through the book, but it still looks as though seven or eight articles will be needed in total.
It was quite dense today, but once again an impressive read.
- I’ll be back in a couple of weeks with the next section, which looks at technical analysis.
Until next time.
Mike Rawson
Mike is the owner of 7 Circles, and a private investor living in London. He has been managing his own money for 40 years, with some success.