Trading For A Living #4 – Volume and Time
Today’s post is our fourth visit to Trading for a Living by Alexander Elder. Today we look at Volume and Time.
Contents
Volume and Time

Volume
Daily volume is the number of shares or contracts traded in one day. Traders usually plot volume as a histogram – vertical bars whose height reflects each day’s volume – underneath prices.
Changes in volume show how bulls and bears react to price swings and provide clues to whether trends are likely to continue or to reverse.
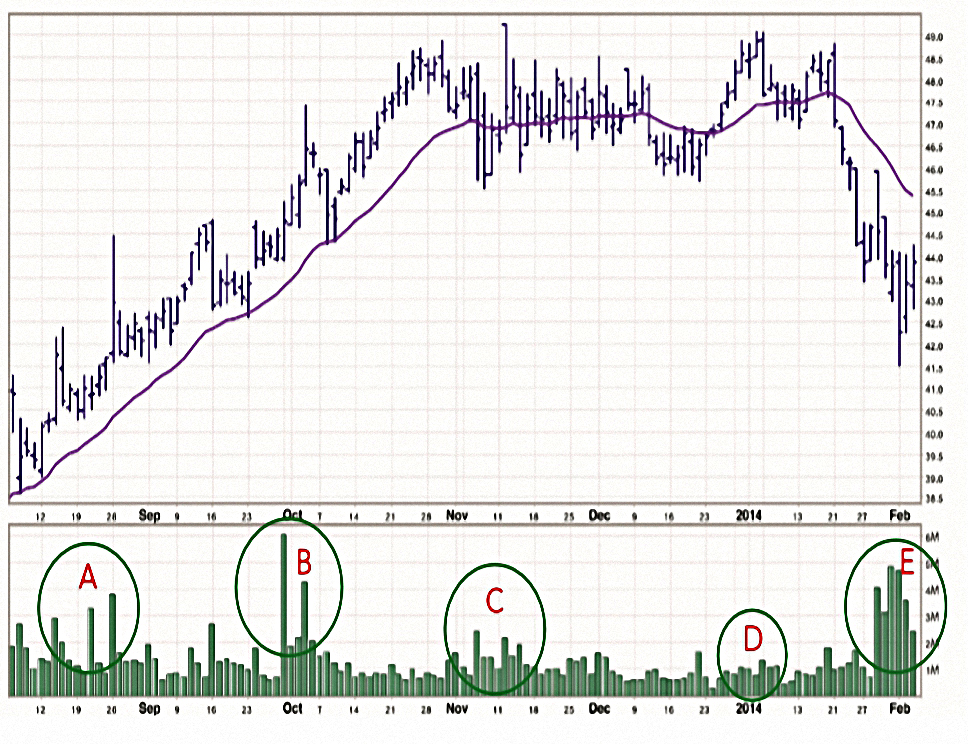
At A and B, high volume confirms the rally. At C and D, lower volume means the rally is over. Rising volume at E confirms the down trend.
There are three ways to measure volume:
- The actual number of shares or contracts traded (best).
- The number of trades that took place.
- Tick volume – price changes during a period of time (10 minutes or an hour).
FX is a decentralised market and has no volume, so currency futures volume is used as a proxy.
The greater the volume, the more pain in the market. Trends can persist for a long time on moderate volume but can expire after a burst of volume.
A trend that moves on steady volume is likely to persist. It shows that new losers are replacing those who washed out. When volume falls, it shows that the supply of losers is running low and a trend is ready to reverse.
A burst of extremely high volume also gives a signal that a trend is nearing its end. It shows that masses of losers are bailing out.
Volume spikes are more likely to signal an imminent reversal of a downtrend than an uptrend. Volume spikes in downtrends reflect explosions of fear.
Volume spikes in uptrends are driven by greed, which is a slower-moving, happy emotion. “
A breakout is often marked by a dramatic increase in volume because losers run for the exits. A breakout on low volume shows little emotional commitment to a new trend.
If today’s volume is higher than yesterday’s, then today’s trend is likely to continue.
Trading Rules 1
- “High volume” is at least 25% above its average for the past two weeks; “low volume” is 25% below average.
- High volume confirms trends.
- Peaks or lows with high volume will be retested or exceeded.
- If volume shrinks during a trend, the trend is ripe for a reversal.
- Look to take profits and / or to short when new peaks have low volume.
- Ignore this signal in downtrends as a decline can persist on low volume.
- During reactions against the trend, low volume (even after initial high volume) means the trend will resume.
Volume Indicators
On-Balance Volume
OBV comes from Joseph Granville and is a leading indicator, often rising / falling before the share price.
- He used it with Net Field Trend / Climax indicator – two techniques that I haven’t come across before.
Net field trend scores all the Dow-Jones stocks as +1 for rising OBV, 0 for neutral and -1 for falling OBV.
- The Climax indicator was the total score across the whole 30 stocks.
He looked for a divergence between the Climax indicator and the market index to see whether trends would persist.
- I might look into this in the future – for the FTSE-100 perhaps.
OBV is a running total of volume. Each day’s volume is added or subtracted, depending on whether prices close higher or lower.
A new high of OBV shows that prices are likely to rise. A new low of OBV shows that prices are likely to fall.

I must say I can’t get much out of this chart myself (although I often look at OBV).
- It’s a shame the chart stops at E, as there is an interesting divergence there.
Trading rules 2
- It is safer to trade in the direction of a trend that is confirmed by OBV.
- A new high in OBV is a buy signal, and a new low is a sell signal.
- This is particularly true when prices are in a trading range.
- Like MACD, bullish divergence (bigger second fall in price than in OBV) is a buy signal
- Bearish divergence is a sell signal.
- Longer-term divergences give a stronger signal.
Accumulation / Distribution
A/D was invented by Larry Williams in a 1973 book as a leading indicator.

A/D looks at the Open/Close relationship as well as the High/Low.
- Elder likens the approach to Japanese candlesticks, which were unknown in the west at the time.
You can think of it as a more sensitive version of OBV.
Once again, when prices go up but A/D goes down, the trend is week.
- Similarly if prices go down but A/D goes up.
Openings tend to be dominated by amateurs who read their news in the evening and trade in the morning. Professional traders are active throughout the day and tend to dominate the markets at closing time.
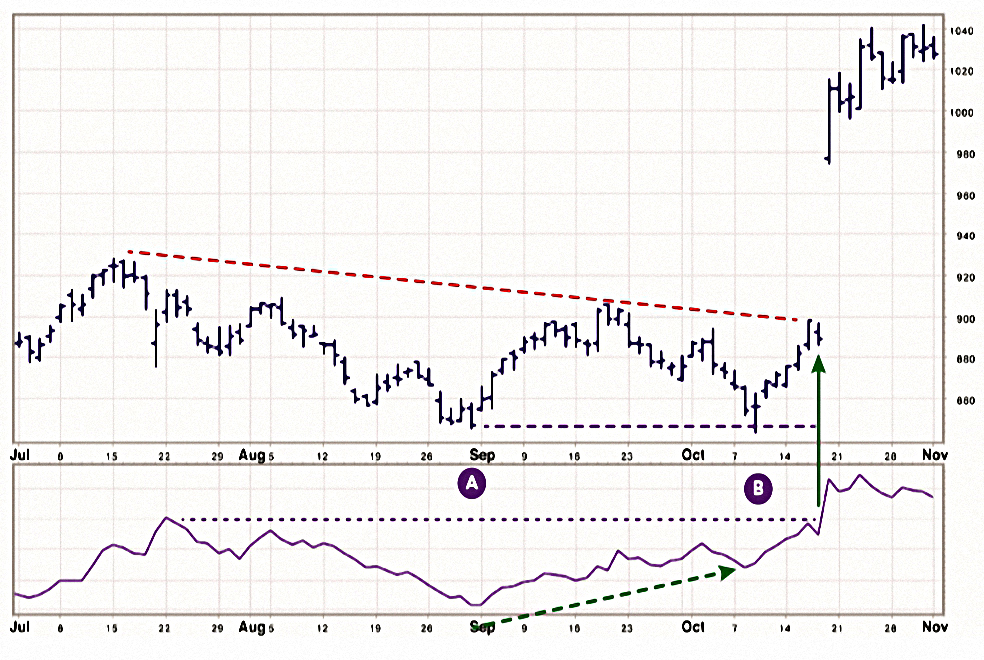
The bullish divergence at B (new low in price, but A/D is higher) precedes the buy signal when A/D reaches a new high.
Trading Rules 3
- If prices hit a new high but A/D hits a lower peak, this bearish divergence is a sell signal.
- A bullish divergence is a buy signal.
Force Index
Force Index (FI) was developed by Elder himself.
- Unfortunately it doesn’t appear in most of the basic charting packages that I have access to.
![]()
It’s another combination of volume and price change, this time comparing today’s and yesterday’s close.
Elder likes to use an EMA of FI – either two day to time entries and exits, or 13-day to confirm trends and identify reversals.
A 2-day EMA of Force Index is useful for finding entry points into the markets. It pays to buy when the 2-day EMA is negative and sell when it’s positive, as long as you trade in the direction of the trend.
A 2-day EMA of Force Index helps decide when to pyramid positions. You can add to longs in uptrends each time Force Index turns negative; you can add to shorts in downtrends whenever Force Index turns positive.
Trading Rules 4
- Buy when a 2-day EMA of Force Index turns negative during uptrends.
- Elder suggest a limit above the high of the day. If prices continue to decline, your order won’t be executed
- Sell short when a 2-day EMA of Force Index turns positive in a downtrend.
- Bullish divergences (new price low, more shallow FI low) are a buy signal.
- Bearish divergences are a sell signal.
- Sharp down spikes (five times the usual) in FI EMA-2 suggest a strong rally is coming.
- It doesn’t work the other way – markets don’t recoil from up spikes (fear vs greed, as discussed before).
Long FI
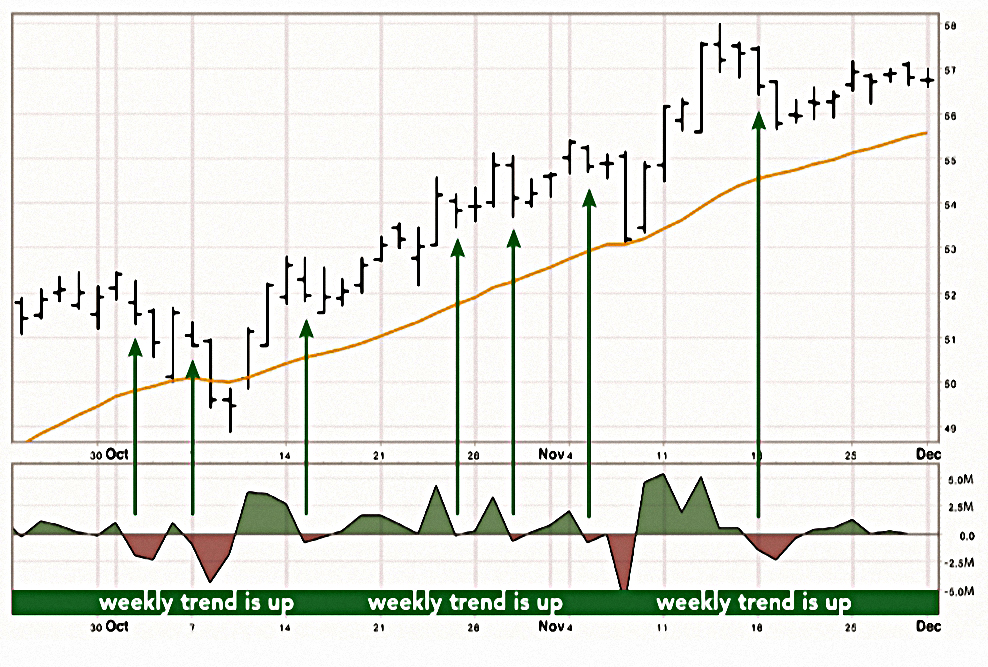
When the 13-day EMA of FI crosses above the centerline, it suggests trading from the long side. When the 13-day EMA turns negative, it suggests trading from the short side.
Divergences between a 13-day EMA of Force Index and prices identify important turning points.
Note that for a divergence to be legitimate, this indicator must make a new peak, then fall below its zero line, and then rise above that line again, but tracing a lower peak. If there is no crossover, then there is no legitimate divergence.
This is a pretty easy to read chart, and the buy signals in particular look good.
Open Interest
Open interest is the number of contracts held by buyers or owed by short sellers in any derivative market, such as futures or options.
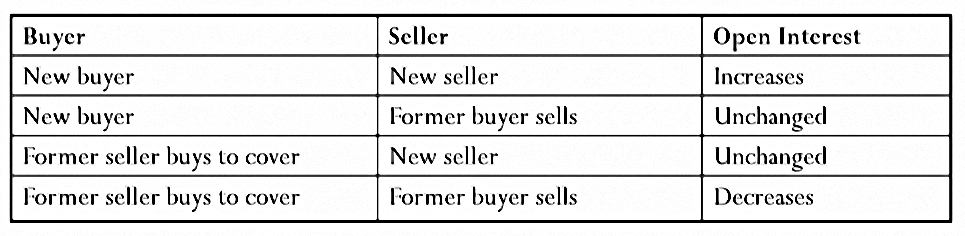
In futures and options the total size of long and short positions is always identical, due to the fact that they are contracts for future delivery. When someone wants to buy a contract, someone else has to sell it to them (go short).
Open interest equals the total long or the total short positions. It rises when new positions are being created and falls when positions are being closed.
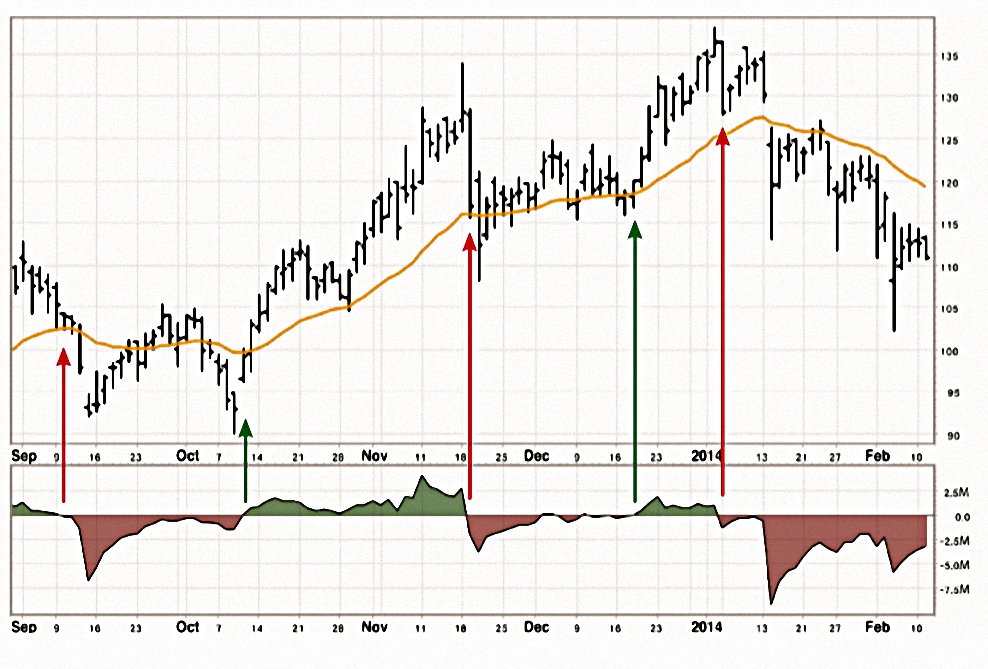
Rising open interest supports trends, flat OI weakens them and falling OI undermines them.

Here the OI bottomed at A, and the T-notes futures at B. By C both are in uptrends. OI tops at D while prices continue to rise. By E, Oi is falling, suggesting that price will follow.
Trading Rules 5
- Rising OI confirms trends (both up and down) but is bearish when prices are in a trading range.
- Falling OI undermines trends but is bullish when prices are in a trading range.
- Flat OI weakens trends but means nothing in a trading range.
Time
This section is more elliptical than the previous 50 pages on indicators.
Cyles
The U. S. stock market tends to run in approximately four-year cycles, because the ruling party inflates the economy going into the presidential election every four years.
The party that wins the election deflates the economy when voters can’t take revenge at the polls. Flooding the economy with liquidity lifts the stock market, while draining liquidity pushes it down.
Major cycles in agricultural commodities are due to weather and fundamental production factors – when livestock prices rise, farmers breed more animals. When those animals reach the market, prices fall and producers cut back.
Indicator Seasons
The concept of seasons for prices was developed by Martin Pring (it sounds like the Weinstein / Minervini Stage System) but Elder thinks that it works even better with indicators.

The basic idea is to stay one step ahead of the crowd.
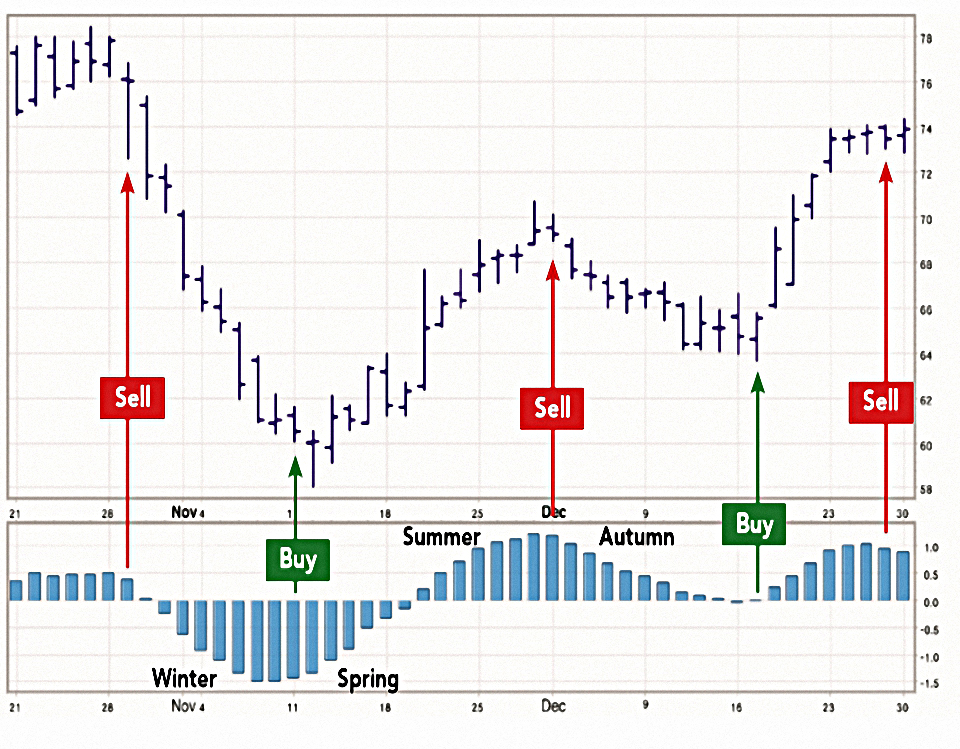
The flaw for me is that the cycles don’t repeat neatly like the weather does.
- In this chart, Autumn is not followed by Winter, but by another Summer.
- Any shorts placed during the Autumn would not have worked out.
I don’t understand why the first buy signal comes in Spring, and the second at the start of Summer.
Factor of five
Elder notes that charting periods are linked by roughly a factor of five:
- Monthly, weekly, daily, hourly, 10-min, 2-min.
The proper way to analyze any market is to review at least two neighboring time- frames. You must always start with the longer timeframe for a strategic view and then switch to the shorter timeframe for tactical timing.
If you like using daily charts, you must first examine weekly charts.
Timeframes
We can roughly divide all trades into three groups:
- Long-term trading or investing – The expected duration of a position is measured in months, sometimes years.
- Advantages: requires little day-to-day attention and may lead to spectacular gains.
- Disadvantage: drawdowns can be intolerably severe.
- Swing trading – The expected duration of a trade is measured in days, sometimes weeks.
- Advantages: a wealth of trading opportunities, fairly tight risk control.
- Disadvantage: will miss major trends.
- Day-trading – The expected duration of a trade is measured in minutes,rarely hours.
- Advantages: great many opportunities, no overnight risk.
- Disadvantages: demands instant reflexes; transaction costs become a factor.
If you decide to operate in more than one timeframe, consider making those trades in different accounts. This will allow you to evaluate your performance in each time frame rather than lump together apples and oranges.
I would stress much more the different levels of time commitment involved:
- long-term investing requires a few hours a month
- swing trading need only involve a few hours a week
- day-trading is a full-time job, and not and easy one
I have no intention to be a day trader.
- Depending on what else is happening in my life, and what the markets look like, I switch between investing and swing trading.
- There’s been a lot more investing over the years, but I expect things to be more even over the next decade.
Investing
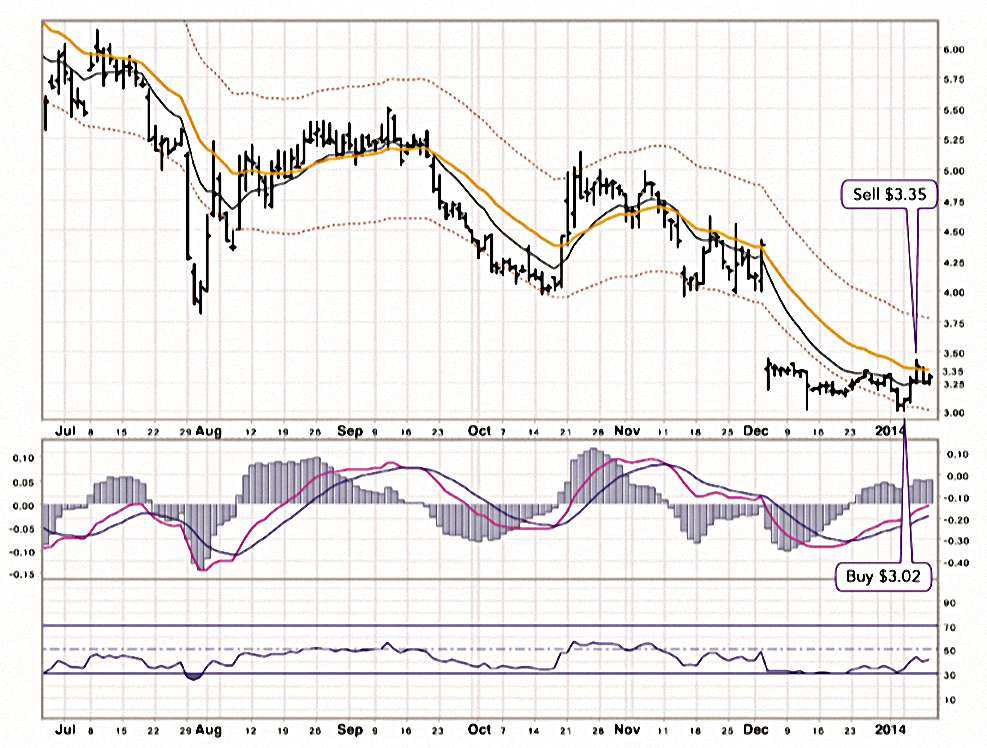
Elder makes the important point that even long-term investing is not easy, unless you are the kind of person who can ignore the stock price for years at a time.
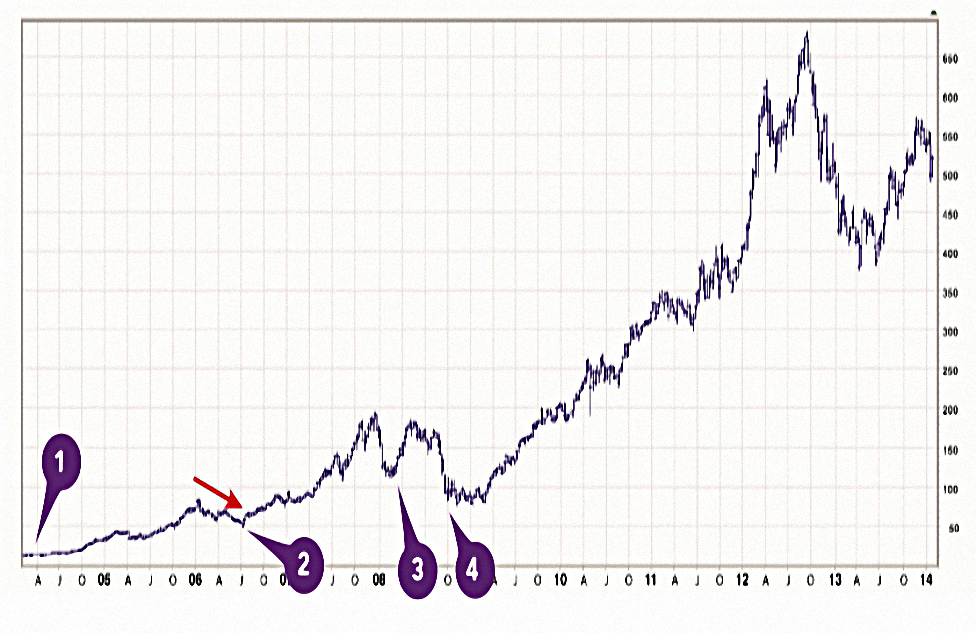
He marks four points on the Apple chart where most investors would have thought about selling, and you could add a fifth in 2013.
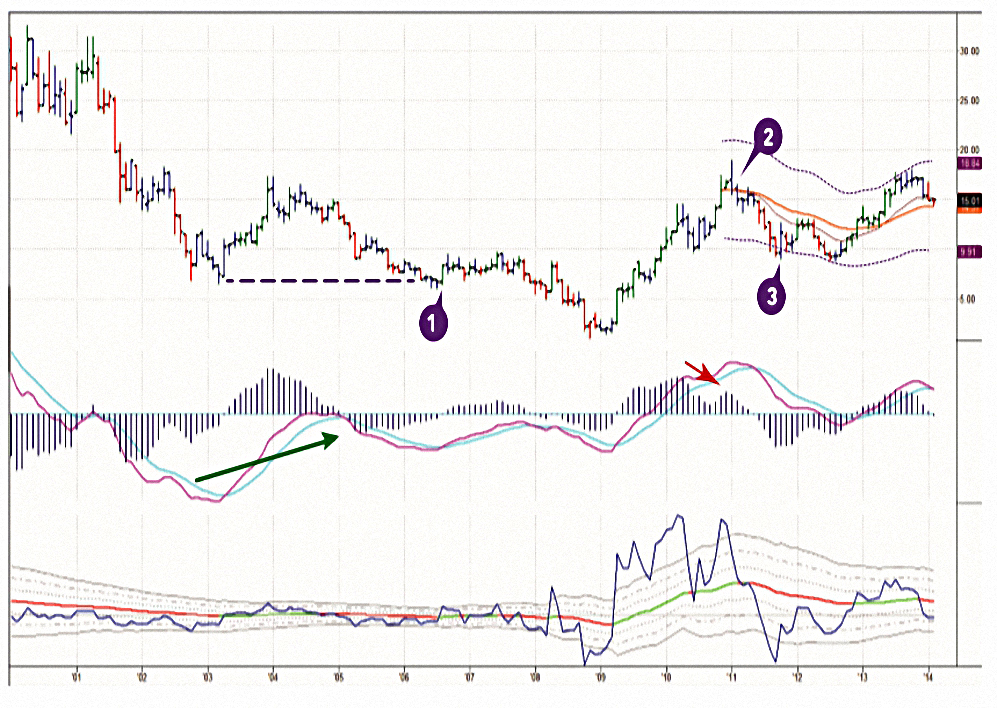
On this long-term, chart of Ford, Elder points out that at 1 there was a false downside breakout with bullish divergence, so he bought.
- This trade didn’t work at first, as there was a bear market.
- At 2 there was an upside kangaroo tail and a weaker MACD, so Elder cashed in his profits.
- At 3 he bought back in at the bottom of the “value zone”
I get the philosophy, but this chart isn’t as convincing as the Apple one.
- Technicals make long-term investing a little better, but still imperfect.
Swing trading
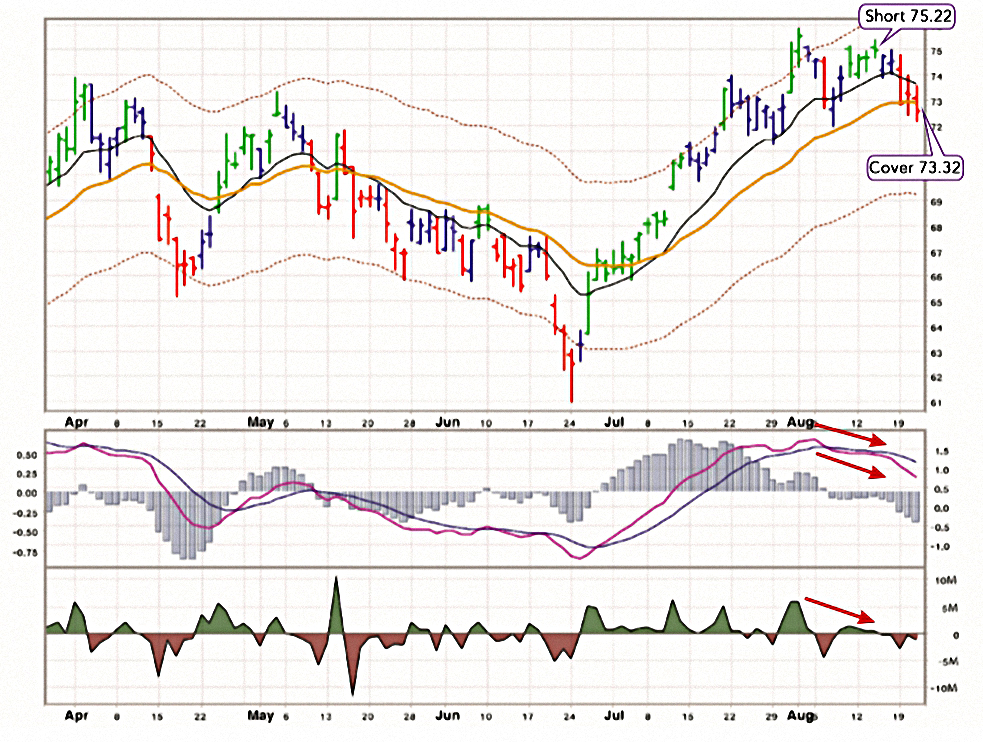
Here Elder shorted a double top with bearish divergence.
Swing trading teaches you faster than long-term investing, whose lessons take years to complete. Swing trading gives you time to think, unlike day-trading, which demands instant reactions.
This is a very short-term trade from bullish divergence in MACD and RSI.
Day-trading
Whatever you might see on Twitter or Facebook, day-trading is not easy.
In 2000, state regulators in Massachusetts subpoenaed brokerage house records, which showed that after six months only 16% of day-traders made money.
Spread betting providers in the UK how have to show how many of their clients lose money (usually upwards of 75%), but we can’t say for sure how many of them are day-trading.
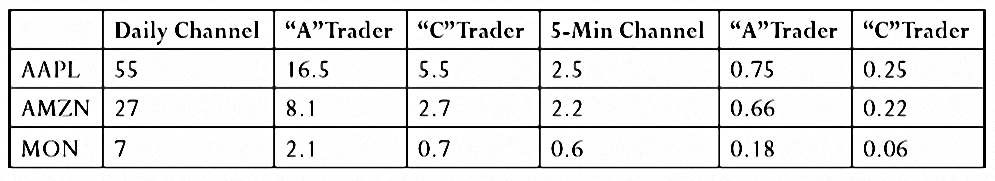
Elder compares the channel sizes (range heights) for popular stocks on a daily chart and a 5-min chart.
Whether you are an “A-trader” who captures 30% of the channel, or a C-trader who captures only 10%, there’s a lot more to aim at in the daily chart.
- Swing-trading is just easier.
Of course, day-traders compensate by using more leverage, which works fine until it doesn’t.
Conclusions
It’s been another long and hard, but rewarding session.
Some takeaways:
- Volume is important.
- A/D looks like an interesting way of tracking volume (I’ve used OBV up to now).
- Force index looks interesting, too, but it’s not in my charting packages.
- Open Interest is just for derivatives, which I don’t trade at the moment.
- Indicator seasons are imperfect because indicator cycles are unreliable.
- Always check charts from two timeframes (say weekly and daily).
- Swing trading is “better” than long-term investing, and easier / much less time-consuming than day-trading.
My personal inclination is to mix long-term investing (supported by technicals) with swing trading.
- The former is well suited to indices, markets, assets and larger stocks.
- The latter makes more sense for smaller stocks (and crypto!).
Until next time.
Mike Rawson
Mike is the owner of 7 Circles, and a private investor living in London. He has been managing his own money for 40 years, with some success.