Trading For A Living #5 – Market Indicators and Trading Systems

Today’s post is our fifth visit to Trading for a Living by Alexander Elder. Today we look at Market Indicators and Trading Systems.
Contents
General market indicators

Market indicators are worth following because general market trends are responsible for as much as half the movement in individual stocks.
Market indicators are much more popular in the US than here in the UK.
- If any readers know of good (free) UK sources of the indicators discussed below, please let us know in the comments.
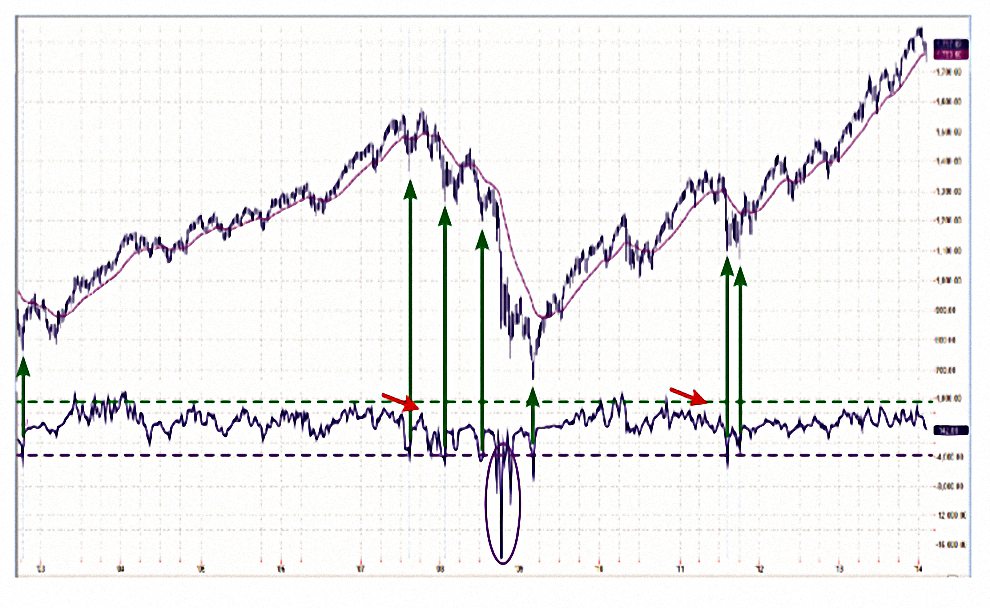
New High – New Low Index
The New High-New Low Index (NH-NL) tracks the behavior of market leaders by subtracting the number of New Lows from the New Highs. In my experience, NH-NL is the best leading indicator of the stock market.

Not easy to find for the UK market, however.
- You could probably find the spot values for NH and NL, and calculate the number for today, but plotting a chart would be a bit more difficult.
The normal lookback period is one year.
For the US, Elder likes barchart.com as a data source.
NH-NL includes data from the NYSE, AMEX, and NASDAQ, excluding only ETFs, unit investment trusts, closed-end funds, warrant stocks, and preferred securities.
When NH-NL rises above its centerline, it shows that the bullish leadership is dominant. When NH-NL falls below its centerline, it shows that bearish leadership is in charge.
As always, Elder sees significance in divergence between a new high in the index and a fall in NH-NL (or the opposite).
NH-NL can stay above its centerline for months at a time in bull markets and below its centerline for months in bear markets. If NH-NL stays negative for several months but then rallies above its centerline, it signals that a bull move is likely to begin.
If NH-NL stays positive for several months but then falls below its centerline, it shows that a bear move is likely to begin.
Elder also uses a weekly NH-NL, plus 20-day and 65-day lookback windows.
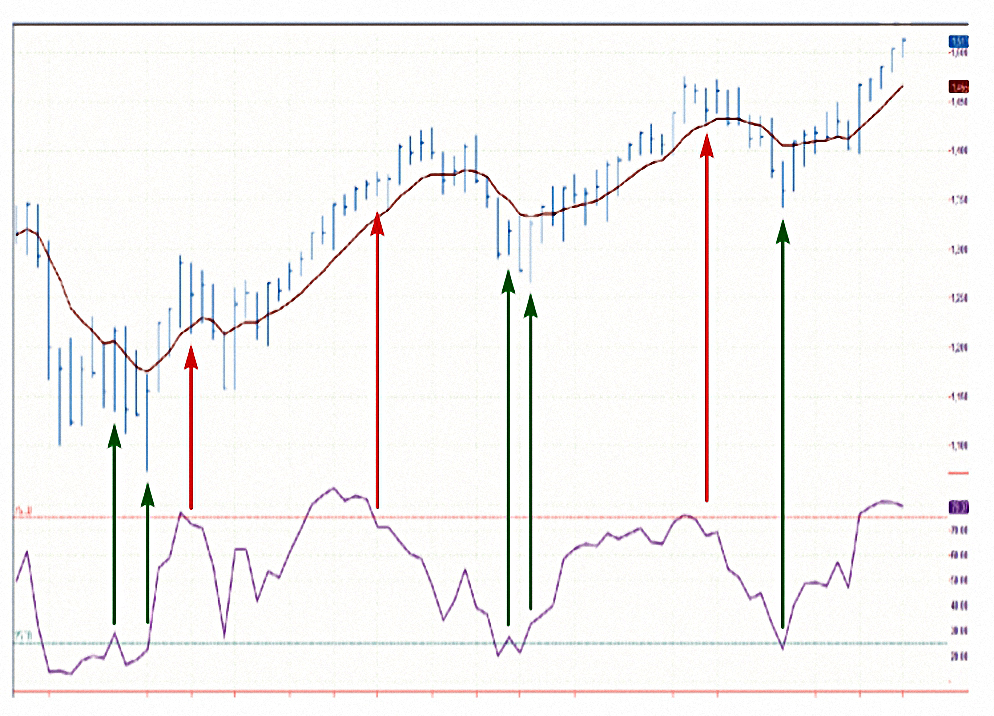
Stocks above 50-Day MA
Another broad stock market indicator not widely available in the UK.
- This one is usually expressed as a percentage of the market.
Reversals up through 25% (buy) and down through 75% (sell) are seen as turning point signals.
Notice that the tops of this indicator tend to be broad, while its bottoms are sharper. Tops are formed by greed, which is a happier, longer-lasting emotion. Bottoms are formed by fear – a more intense and shorter-lived emotion.
Advance / Decline
Elder doesn’t really think that any other wide market indicators have stood the test of time, but he covers them for completeness.
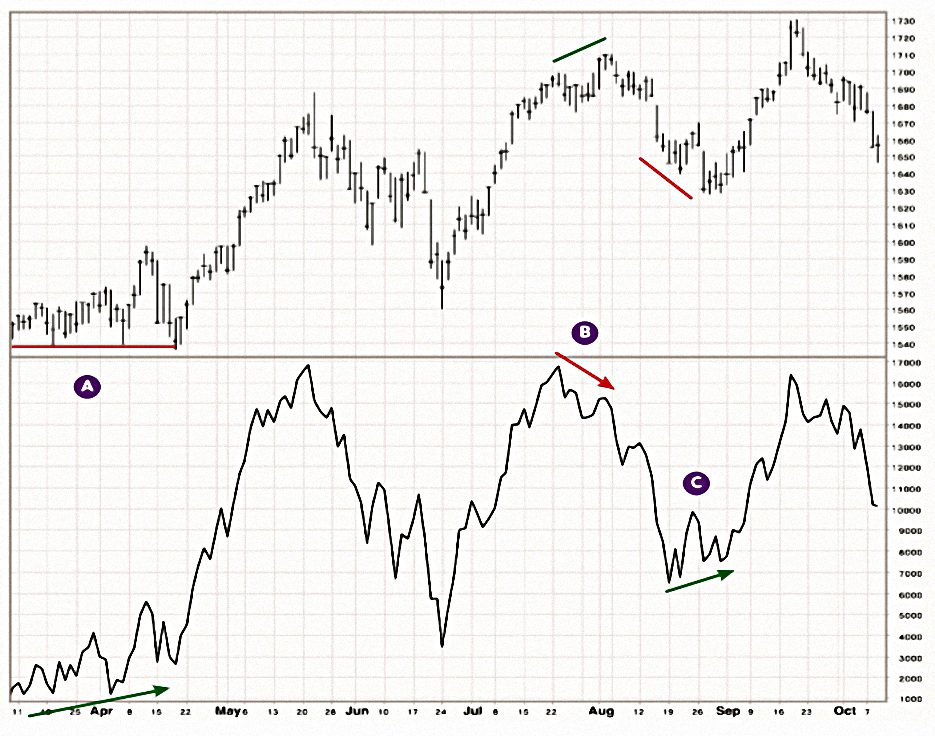
This is just the number of stocks that closed higher minus the number of stocks that closed lower.
Traders should watch for new peaks and valleys in the A/D line rather than its absolute levels, which depend on its starting date.
As usual, divergence between the index and the A/D line is significant.
- Elder mentions another eight broad market indicators, but none of them seem useful to UK private investors, so I will skip over them.
Consensus and commitment
Financial journalists and letter writers tend to overstay trends and miss turning points. When these groups become intensely bullish or bearish, it pays to trade against them.
This is a contrarian indicator.
Abraham W. Cohen came up with the idea of polling market advisors and using their responses as a proxy for the entire body of traders. In 1963, he established a service called Investors Intelligence for tracking letter writers.
James H. Sibbet, applied this theory to commodities, setting up an advisory service called MarketVane.
In recent years, there has been an explosion of interest in behavioral economics, and today many services track advisors. My favorite resource is SentimenTrader.
Bullishness helps sell subscriptions, while bearish comments turn off subscribers. Even in a bear market, we rarely see more bears than bulls among advisors for more than a few weeks at a time.
The front covers of major business magazines serve as contrarian indicators. When a leading business magazine puts a bull on its cover, it’s usually a good time to take profits.
A group of three or more ads touting the same “opportunity” in a major newspaper or magazine warns of an imminent top.
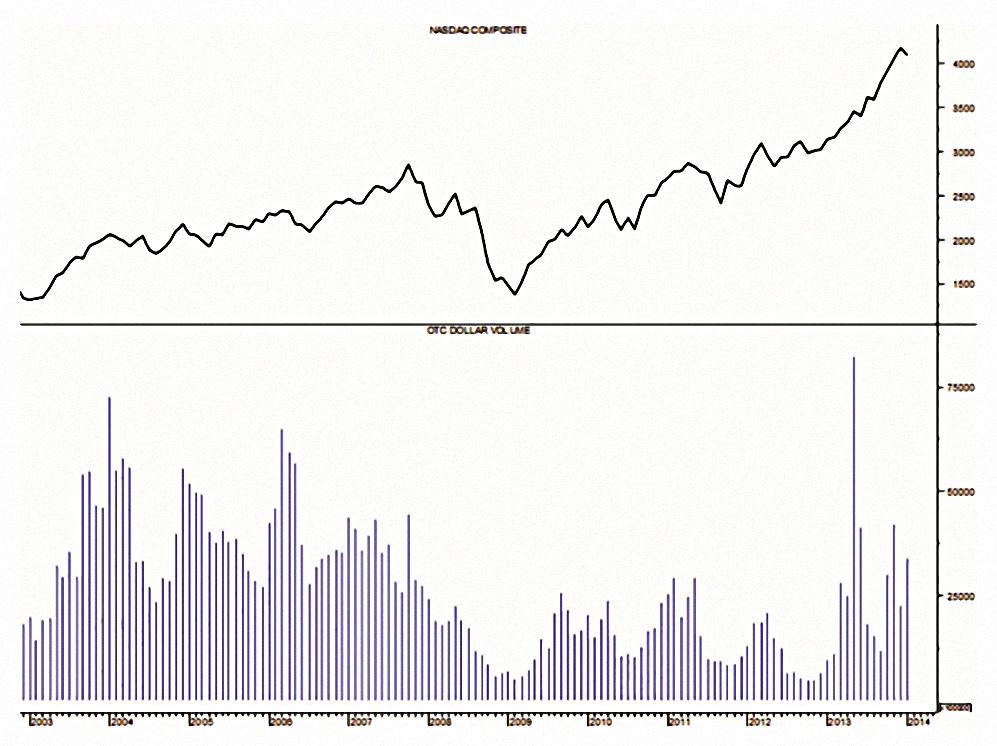
Elder also recommends tracking pump-and-dumpers by looking at the dollar value of OTC stocks.
- This is another contrarian signal, obviously.
The nearest UK equivalent is the AIM market, but there are two problems:
- The top 100 to 200 stocks on AIM are legitimate, and often much larger than the pump and dump targets
- Pump and dump in the UK is a rotational activity, focusing on a few stocks at a time – it’s unlikely to show up in market volumes, or index levels.
So whilst I like the idea, I can’t think of a way to put it into practice over here.
In the US, insider volumes and the positions of futures hedgers are reported.
- This is another piece of the jigsaw that I haven’t seen anyone reference over here (individual insider trades are reported, but not market data).
Neither have I seen short interest reported in aggregate, rather than for individual shares.
Note that all of these would not be contrarian indicators, were they available, though Elder sees high short interest as a positive factor when buying a stock (“more fuel for a rally).
- I take the view that shorters are likely to know better than me, and prefer to stay away.
Trading Systems
A system is a set of rules for finding, entering, and exiting trades. Every serious trader has one or more systems.
Some people use strictly defined systems that leave very little room for personal judgment–we call them mechanical traders. Others use systems that leave plenty of room for personal decisions–we call them discretionary traders.
The key advantage of any system is that you design it when the markets are closed and you feel calm. A system becomes your anchor of rational behavior.
An amateur feels relieved that a mechanical system will relieve him from the stress of decision making. Unfortunately, market conditions keep changing, and mechanical systems eventually get out of gear and start losing money.
A discretionary trader approaches each day in the markets afresh. A good discretionary system includes several inviolate rules, especially in the area of risk management.
In my experience, mechanical traders tend to deliver more steady results, but the most successful traders use discretionary methods.
I am a discretionary trader, but strict rules prohibit me from buying above the upper channel, shorting below the lower channel line, or putting on trades against the Impulse system [see below].
Testing
Before trading real money with a system, you need to test it.”
That can be with backtesting or paper trading or “forward testing” (risking small amounts).
In the end, only one kind of backtesting prepares you to trade – manual testing.
This involves recording the decisions you would have taken from the historical data, and working out the results.
It is slow, time-consuming, and cannot be automated, but it’s the only method that comes close to modeling real decision making. This one-bar-at-a-time testing is vastly superior to what you can get from backtesting software.
Paper Trading
Some alternate between real and paper trades and can’t understand why they seem to make money on paper but lose whenever they put on a real trade.
There are three reasons. First, people are less emotional with paper trades, and good decisions are easier to make with no money at risk. Second, in paper trades, you always get perfect fills, unlike real trading. Third and most important, good trades often look murky when you consider them.
Three for All
There are three essential angles that must be considered for every planned trade – entry, target and stop.
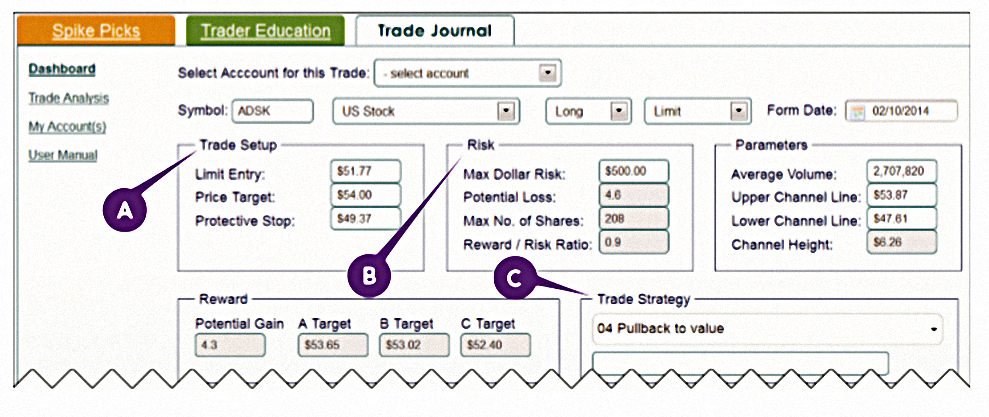
Before entering the market you need to decide how much you’ll pay, how much you’ll risk, and how much you expect to gain. The ratio of potential reward to risk should normally be better than two to one.
Risk management—decide in advance how many dollars you’re prepared to risk on this trade. Divide that amount by your risk per share—the distance from your entry to your stop. This will give you the number of shares you may trade.
Triple Screen System
Elder first published this system in 1986.
The Triple Screen combines trend-following indicators on long-term charts with counter-trend oscillators on the intermediate charts.
Beginners often look for a magic bullet, but the markets are too complex to be analyzed with a single indicator.
The Triple Screen trading system is designed to filter out the disadvantages of trend-following indicators and oscillators, while preserving their strengths.
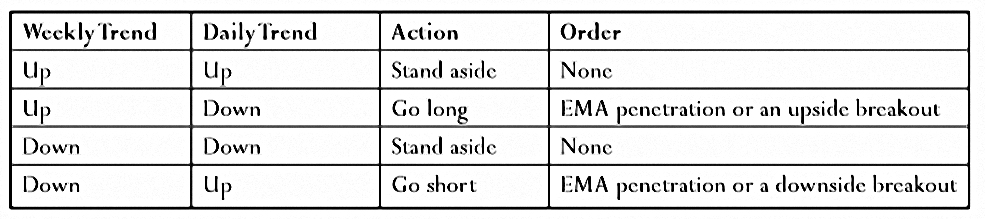
We need a system to handle conflicting signals in different timeframes.
Whatever timeframe is your favorite, the Triple Screen calls that the intermediate time frame. The long-term timeframe is one order of magnitude longer. The short-term timeframe is one order of magnitude shorter.
You may not look at your intermediate time frame until you examine the longer-term timeframe and make your strategic decision there. Triple Screen allows you to trade only in the direction of the trend on the long-term chart.
It uses the waves that go against the tide [on the intermediate time-frame] for entering positions.
When the weekly trend is up, daily declines create buying opportunities. When the weekly trend is down, daily rallies provide shorting opportunities.
For Elder, The first stage is the weekly chart, using the slope of the EMAs (26- and 13-) as the directional signal.
- He used to use the MACD, but found it too sensitive.
- He also uses the Impulse system (see below).
Other traders use the directional system (DMA) as the first stage.
A trader has three choices: buy, sell, or stand aside. The first screen of the Triple Screen trading system takes away one of those options.
Buy or stand aside during major uptrends. Sell short or stand aside during major downtrends.
Stage 2:
Apply an oscillator to a daily chart. I like using Force Index, but RSI, Elder-ray, or Stochastic also perform well.
When the weekly trend is up, Triple Screen takes only buy signals from daily oscillators but doesn’t short their sell signals. When the weekly trend is down, take only shorting signals.
Screen 3:
“The Third Screen is your entry technique. You can go to an even shorter time-frame, or you can use the same intermediate time frame.
Elder used to buy breakouts:
Above the previous day’s high for longs or below the previous day’s low for entering shorts.
After a “wide” day this would mean wide stops and hence smaller positions. After a “narrow” day the stops would be more likely to be hit.
- He now uses 25- and 5-minute charts to enter via day-trading techniques.
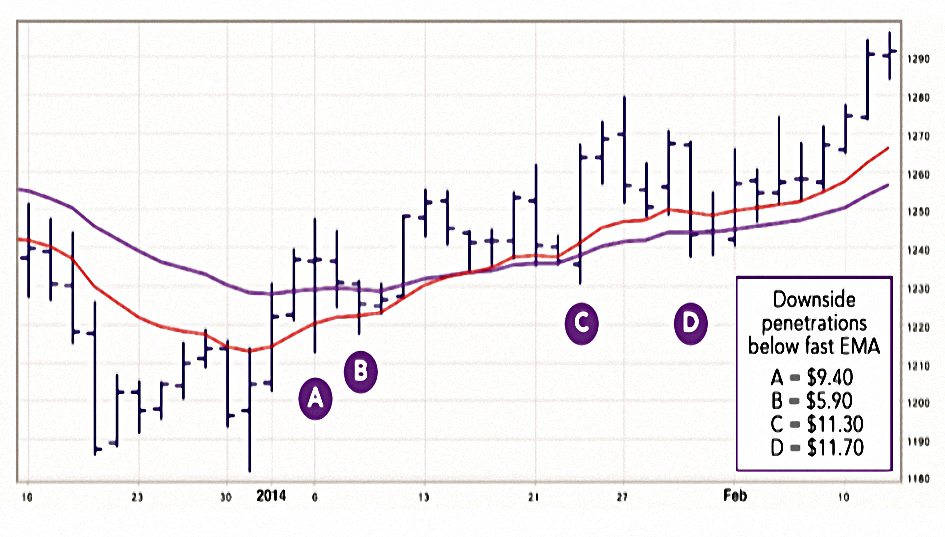
An alternative is the “an average EMA penetration”, which is a 3-step process:
1- Calculate an average penetration [spike down below the fast EMA].
2 – Subtract yesterday’s EMA level from today’s and add this number to today’s EMA: this will tell you where your EMA is likely to be tomorrow.
3 – Subtract your average penetration from your estimated EMA level for tomorrow and place your buy order there.
Or more simply, just look for a significant spike down below the fast EMA.
In the chart above, the average downside penetration was $9.60, with the 13-day EMA $1,266.
- So anywhere around $1,256 would be fine for a buy.
Keep in mind though downtrends tend to move twice as fast as uptrends.
Stops and Profit Targets
Before you enter a trade, write down three numbers: the entry, the target, and the stop. Placing a trade without defining these three numbers is gambling.
Triple Screen calls for setting profit targets using long-term charts and stops on the charts of your intermediate (trading) timeframe.
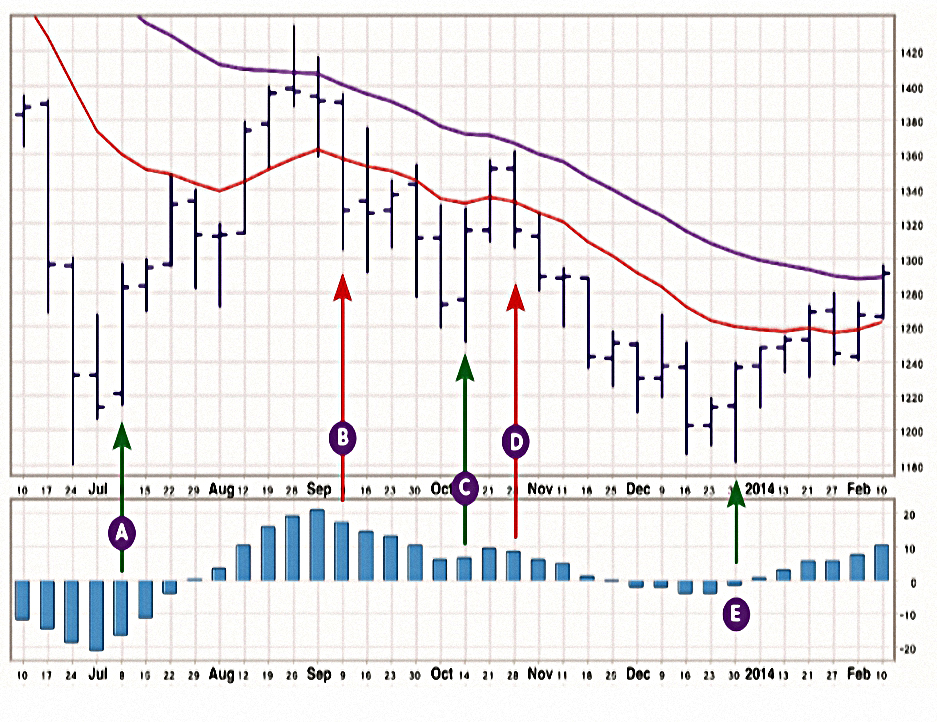
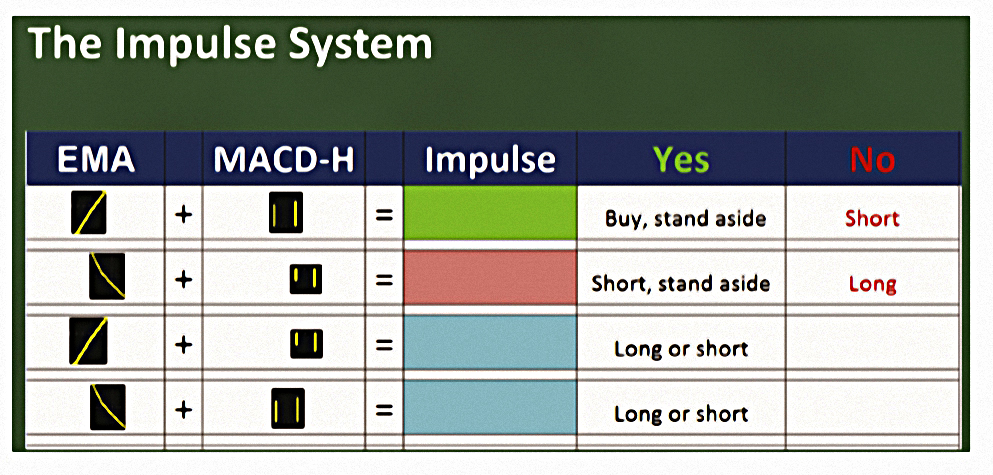
The Impulse System
Elder’s second system is called the Impulse system, which combines “inertia” and “power”.
- This was published in Elder’s second book (Come into my Trading Room, 2002).
A good measure of the inertia of any trading vehicle is the slope of its fast EMA. The power of any trend is reflected in the slope of MACD-Histogram (the relationship between the final two bars).
Elder says:
It is relatively simple to program most software packages to color price bars or candles using the Impulse system.
If both indicators are rising, the bar is green-bullish. If both are falling, the bar is red–bearish. When the two indicators move against one another, that bar is blue–neutral.
The Impulse system doesn’t appear to be available within the simple charting packages available to me, so I won’t waste too much time on it here.
- When I find a straightforward way to access it through software, I’ll revisit the theory in more detail.
Elder initially used this as an automatic system:
The automatic system caught every single trend, but it got whipsawed during trading ranges, where it kept flipping between green and red.
“A few years later it dawned on me – it was a censorship system! It told me what not to do. If either weekly or daily bar was red – no buying allowed. If either weekly or daily bar was green – no shorting permitted.
“And that’s how I’ve been using the Impulse system ever since. It keeps me out of trouble.
As with the Triple Screen, Elder uses two time frames (eg. weekly and daily).
The shorter a timeframe,the more sensitive its signals: the Impulse on a daily chart almost always changes colors ahead of the weekly.
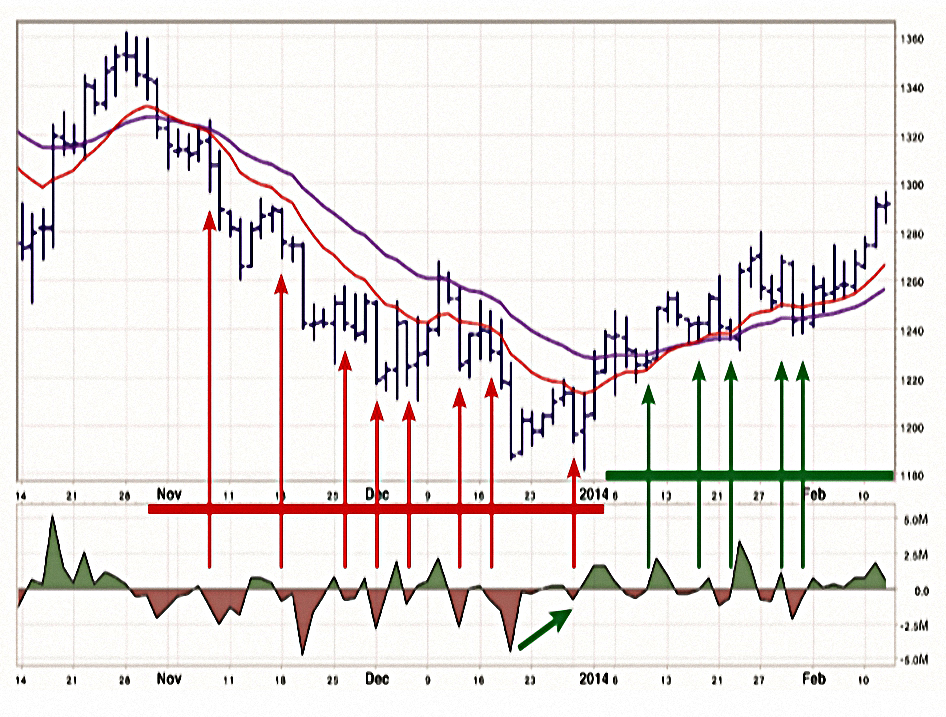
If you’re a short-term momentum trader, you can buy as soon as both timeframes turn green and take profits as soon as one of them fades to blue.
When trying to catch market turns, the best trading signals are given not by green or red but by the loss of green or red colors.
If a stock is falling, when both timeframes stop being red, they allow you to buy. If you think that a stock is forming a top, when the green disappears from both timeframes, you may start shorting.
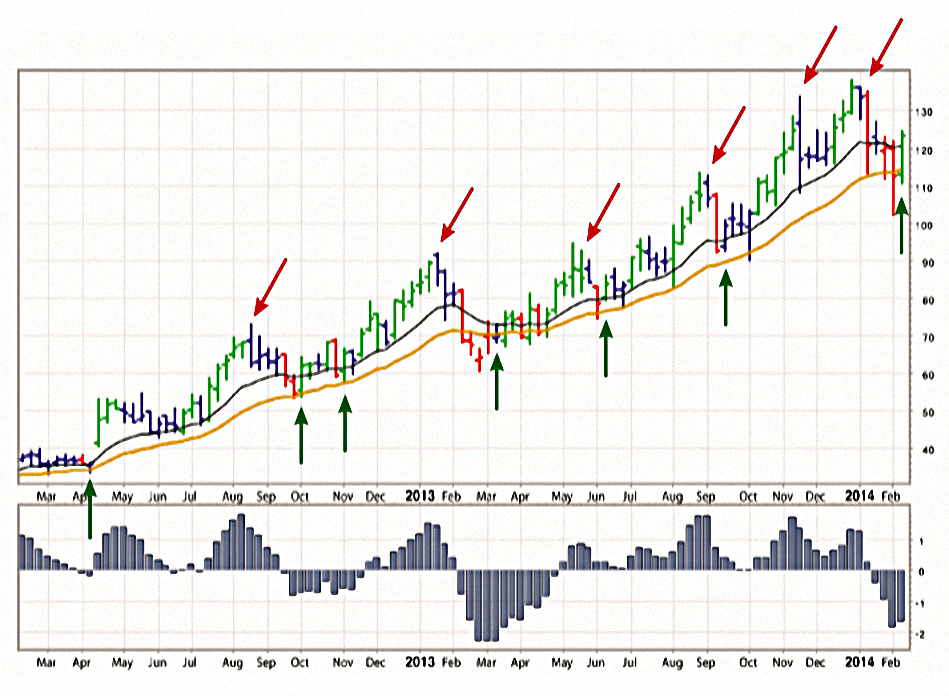
Here the green arrows are right after a red signal disappears.
- This is the best time to buy.
The sloping red arrows are blue bars after green bars that have taken price away from value (the EMA channel) – these are good for taking profits.
If you’re a short-term momentum trader, close out your trade as soon as the color of the Impulse system stops supporting the direction of your trade, even in one of the two timeframes.
When the buy signal disappears, take profits without waiting for a sell signal. Reverse this procedure in downtrends. Cover shorts as soon as the Impulse system stops being red, even in one of the two timeframes.
The Impulse system encourages you to enter cautiously but exit fast. This is the professional approach. Beginners tend to do the opposite; jump into trades and then take forever to exit.
A swing trader may stay in a trade, even if one of the timeframes turns blue. What he should never do is stay in a trade against the color. If you’re long, and one of the timeframes turns red, it is time to sell. If you’re short, and the Impulse system turns green, cover your short.
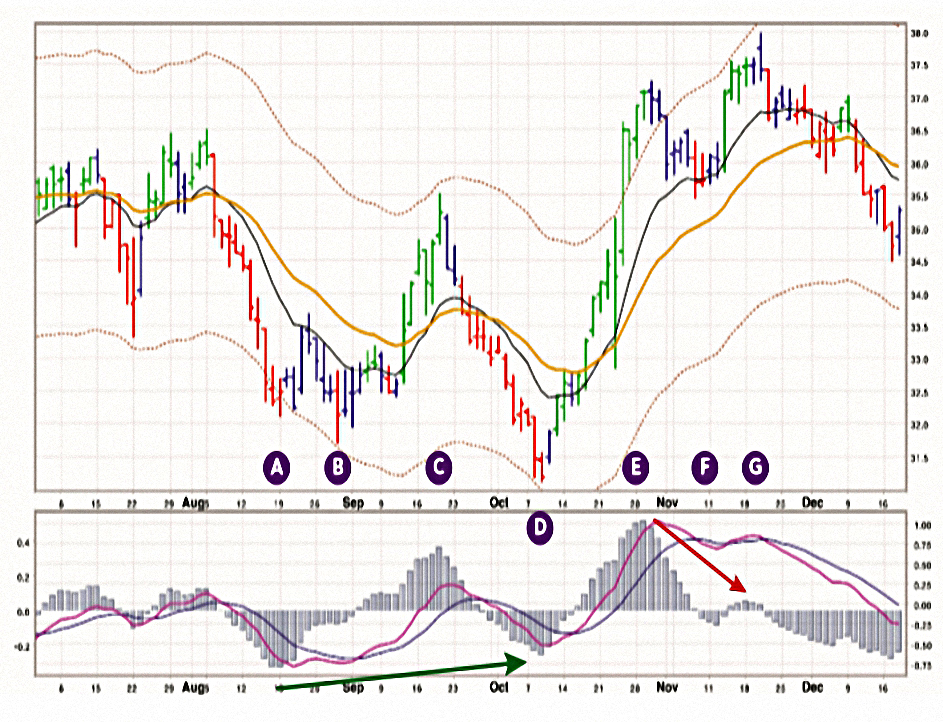
Channel Trading Systems
Channels help us anticipate where support and resistance levels are likely to be encountered.
Prices oscillate above and below value – Benoit Mandelbrot”
If we have the means to define value and measure an average oscillation, we’ll have a trading system. We’ll need to buy below value and take profits at value or sell short above value and cover at value.
Value is the zone between a short and a long moving averages. We can use channels to find normal and abnormal oscillations.
We may construct a channel by plotting two lines parallel to a moving average: one above and another below. We may also vary the distance between the channel lines depending on that market’s volatility (standard deviation channels).
If you use 13-day and 26-day EMAs, draw your channel lines parallel to the 26-day EMA.
Edler says that straight channels work best for stocks and futures, whereas Bollinger bands are good for options.
![]()
The coefficient is usually a percentage of the EMA level.
- Edler would use something in the 3% to 5% range that ensured that 95% of the recent price data (say 100 days) was within the channel.
- This is similar to the 2 standard deviation limit on Bollinger bands.
Volatile markets require wider channels, while quiet markets require more narrow channels. Cheaper stocks tend to have higher coefficients than expensive ones. Long-term charts require wider channels.

Elder uses a tool called Auto Envelope, but simple charting packages tend to only offer Bollinger bands and perhaps ATR channels, both around price rather than an EMA.
- The Ms and Ds on the chart above correspond to manic and depressed moments for Mr Market.
One of my strict rules is never to buy above the upper channel line or sell short below the lower channel line.
[
Multiple ATR channels (1, 2 and 3 ATRs from the EMA can be very useful, but many charting packages plot the ATR channels from the price rather than the EMA, which is of little use.
Trading rules
Amateurs like to bet on long shots–they tend to buy upside breakouts and short (if they ever sell short) downside breakouts. Professionals tend to trade against deviations and for a return to normalcy. Most breakouts are exhaustion moves that are soon aborted.
Breakouts can produce spectacular gains when a major new trend blows out of a channel, but in the long run it pays to trade with the pros. Most breakouts fail and are followed by reversals.
- A sell signal is given when prices reach the upper channel line while an indicator, such as MACD-Histogram, traces a bearish divergence.
- Look for shorting opportunities on the dailies when prices are sinking on the weekly charts.
- A buy signal is given when prices reach the lower channel line while an indicator traces a bullish divergence.
- Look for buys on the daily charts when prices are rising on the weeklies.
- Go long near the moving average when the channel is rising, and take profits at the upper channel line.
- Go short near the MA when the channel is falling, and take profits at the lower channel line.
Bollinger bands
Major market moves tend to erupt from flat bases. Bollinger bands help identify transitions from quiet to active markets.
These bands are useful for options traders because option prices are largely driven by swings in volatility. Narrow Bollinger bands help you buy when volatility is low and options are relatively cheap.
Wide bands help you decide to write options when volatility is high and options are expensive.
Buying options is a losers’ game. Professional traders write options.
Conclusions
It’s been an interesting tour of market indicators and trading systems, but many of Elder’s favourite tools are not readily available to the UK private investor:
- Market indicators
- New High – New Low is not easy to get hold of.
- Nor is Stocks above their 50-day MA.
- Advance / Decline is difficult, too.
- Trading Systems
- Triple Screen uses EMAs, Force Index, and “day-trading techniques”.
- We can substitute RSI for Force Index, but the screen would still need to be calculated manually.
- EMA penetrations could be used instead of the day-trading techniques.
- You just need to look for a significant spike through the EMA.
- The Impulse system uses EMAs and MACD, but again will probably need to be calculated manually.
- It might also be possible to combine elements from each system.
- On channel trading, we are probably limited to Bollinger bands.
That’s it for today.
- I’ll be back in a few weeks with the next section of the book, which looks at the products we can trade, and at risk management.
Until next time.
Mike Rawson
Mike is the owner of 7 Circles, and a private investor living in London. He has been managing his own money for 40 years, with some success.


Thank you for writing up these book reviews. I enjoy them very much.
Elder Impulse System seems to be available in TradingView.com (it offers UK market when one enters website) and I found ElderImpulseSystem and several variations in the charts, indicators, public library and search for Impulse.
Hope that helps.
Thanks for the kind words, Mark – and its good to know that we can get hold of some of these indicators.