Underestimating the Red Queen

Today’s post looks at a paper from Morgan Stanley on the impact of maintenance spending on a company’s growth.
Contents
Underestimating the Red Queen
As so often, I came across this paper on a podcast. (( In this case, Value After Hours, which I highly recommend ))
- The hosts were interested because one of the authors is Michael Mauboussin.
Before Morgan Stanley, Michael worked at Credit Suisse.
- He’s also a professor of finance at Columbia Business School.
Now, here, you see, it takes all the running you can do, to keep in the same place. If you want to get somewhere else, you must run at least twice as fast as that! – the Red Queen, Through the LookingGlass.
The thesis of the paper (called “Underestimating The Red Queen”) is that a parallel can be drawn between the growth of organisms and that of companies.
- Organisms allocate energy between growth and maintenance/repair, and they stop growing when maintenance requires all of their energy.
Companies follow a similar trajectory when you swap energy for capital.
- The implication is that in order to predict a companies growth, you need to work out how much capital it spends on growth versus maintenance.
Maintenance spending is an estimate of “how fast a company has to run just to stand still”, and is underestimated by most investors.
- The recommended approach is to split selling, general, and administrative expenses into investment and maintenance components.
Klieber’s Law
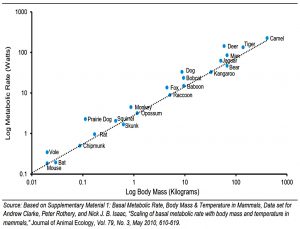
Max Klieber discovered that the mass of an animal (plotted on a log scale) correlates with its metabolic rate (also log-scale).
- This is a power-law relationship, with a slope of 0.75.
Theoretical physicist Geoffrey West showed that this relationship is driven by energy dissipation through a network.
Evolution figured out the optimal network structure to feed all of the cells in the body, which applies to a mouse as it does to an elephant.
The same principles explain blood flow, heartbeats, longevity and growth.
- And more importantly, there are similar rules governing the growth of social systems such as cities and companies.
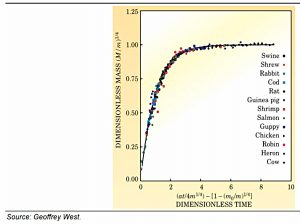
West explains that energy is allocated between the growth of new cells and the maintenance and repair of existing ones. When you are born, your energy can largely be directed toward growth. But after you reach a certain size, all of your energy has to go to maintenance and repair and you stop growing. (( Some species of animals and plants continue to grow through their lives ))
Growth curves for all animals look the same when dimensionless units of time and mass are used.
- West has a similar universal growth curve for companies but uses capital rather than energy as an input.
Estimating maintenance capital expenditures provides insight into how fast a company has to run just to stay in place.
Inflation and obsolescence
Inflation and obsolescence can complicate the calculation.
Inflation can cause CapEx to exceed depreciation even in a stable business since new CapEx will include inflation whereas depreciation is based on historical (non-inflated) costs.
- Were we to see deflation, CapEx would decline and depreciation would overstate maintenance costs.
There is also a deflationary effect from phenomena such as Moore’s Law, where computing power declines over time.
- Early adopters and first movers will spend more than followers.
Technological obsolescence means that the useful life of an asset can be overestimated.
- The authors use climate change and the move to electric vehicles as examples.
Both inflation and obsolescence mean that more investment is needed for the maintenance of current operations.
Tangible vs intangible
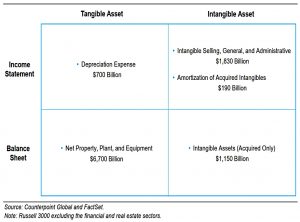
The growth story is different for tangible and intangible assets:
The tangible part of the economy is on average mature, with capital expenditures as a percentage of sales flat to down for the last three decades.
Here depreciation will ten to underestimate maintenance. Such firms:
“experience future write-offs and negative future earnings” and are associated with “significantly negative future abnormal stock returns.”
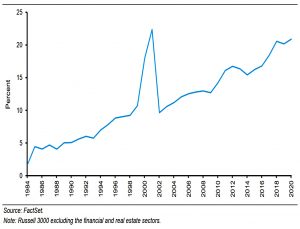
Intangibles have risen over recent decades and firms with mostly intangibles tend to grow faster (albeit with a larger standard deviation).
Buying firms with high intangibles and shorting those with low intangibles generated an average annual return of 4.6 percentage points from June 1989 to November 2020.
Accounting
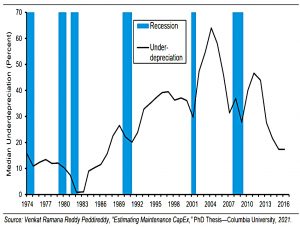
The authors use the simplifying assumption that in a steady-state company (no growth in sales) depreciation is equal to maintenance CapEx.
- Any excess investment is for growth.
A more sophisticated measure of maintenance spending is “cumulative capacity cost”, the sum of depreciation and amortization (D&A), asset write-downs, loss on the sale of assets, goodwill impairment, and intangible asset impairments over a five-year period.
- This includes the impact of obsolescence.
From 1974 through 2016, maintenance CapEx was around 20% higher than D&A (though this figure varies by industry).
Limitations
The authors discuss several limitations to this approach.
- The first is asymmetry – premature obsolescence is captured but when firms understate an asset’s useful life (much rarer), they get free use of it after depreciation.
Changes in accounting rules, particularly around M&A, are also not captured.
- Pooling of interests (combined balance sheets) was replaced by amortisation of goodwill which was in turn replaced by annual testing of impairment of goodwill.
The rise of intangibles
Accounting for intangibles – investments into which is now twice as large as that for tangibles (in the US, at least) is more difficult.
- R&D looks like growth spending, but – especially for large tech firms – some is really to maintain current operations.
Intangible spending of both types is largely expensed through the income statement.
Acquired intangible assets are recorded on the balance sheet following a deal, but the ongoing spending to maintain the value of those intangible assets is expensed.
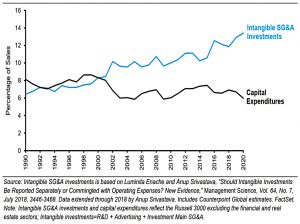
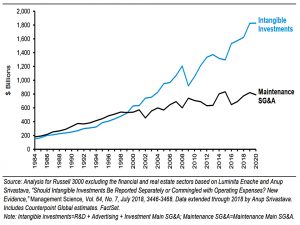
The authors look at a paper that splits Selling, General, and Administrative (SG&A) into three:
- R&D plus advertising = intangible investments
- maintenance main SG&A
- investment main SG&A
Maintenance Main SG&A expenses support existing operations and are calculated by matching them with current revenues. Examples include rent for offices and distribution centers, delivery costs, and sales commissions.
What’s left over is called “Investment Main SG&A,” and is considered discretionary spending that is the source of future earnings.
The chart compares items 1 & 3 in the list (as intangible investments) with item 2 (maintenance main SG&A).
- Intangible investments have increased since 2000.
Conclusions
The central idea in this paper is very interesting, but unpicking the accounting rules and the changing balance between tangible and intangible assets doesn’t lead to clear conclusions.
As companies age, capital spending tends to shift from growth to maintenance. Depreciation expense understates maintenance capital spending, which means there is less money left over to support growth. It also implies that earnings are overstated.
But the rise of intangibles and the increasing amount of SG&A spending directed towards growth counteracts this.
More intangible investment is funding growth. Intangible-intensive companies grow faster on average and generate higher shareholder returns than tangible-intensive companies.
But the life-cycle conceit remains useful:
Early on, resources are skewed toward growth and they shift to maintenance later on. As a result, larger companies grow more slowly than smaller companies do on average.
It’s been a thought-provoking read, but with little that is actionable by the private investor.
- Until next time.


