Van Tharp 5 – Setups

Today’s post is our fifth visit to Trade Your Way to Financial Freedom by Van Tharp.
Contents
Setups

![]()
We’ve reached the third part of Van’s book (out of four), which looks at the key parts of a system:
- Setups
- Entries
- Risk per position (Stops)
- Exits (taking profits)
Chapter 8 is about setups.
Setups refer to conditions that must occur before another action is taken. They are an essential aspect of most entry and exit portions of any system.
A setup is about 10 per cent (or less) of your trading system. Most people will place all their emphasis on finding the right setups, but setups are actually one of the least important parts of the system.
Five phases
Van says there are five phases to entry (though phase is misleading since they don’t appear to be sequential – I would call them market attributes or parameters).
- The first is to determine whether “the appropriate conditions” exist to use a particular system and/or market.
Van’s first example is the use of a bear market mutual fund when you expect the S&P 500 to fall. He needs two out of three conditions to be met:
- The market must be overvalued, meaning that the P/E ratio of the S&P 500 must be over 17.
- The Federal Reserve must be in the way, meaning that it is raising interest rates or that its last change was to raise interest rates sometime during the preceding six months.
- The market has to be acting badly. This basically means that the market is above its 45-week moving average.
I find the wording of point 3 confusing, but it’s just an example.
- Van notes that such a “big picture” signal is a blunt instrument and can flash red for months on end without the strategy working.
Van also mentions the Motley Fool Foolish Four, a kind of “Dogs of the Dow” strategy.
- Van felt that the prospect of the boomers pulling their retirement funds out of the mutual funds which support the major indices meant that such a strategy was not appropriate.
Of course, things didn’t pan out like that and as I write 15 years later, we are close to all-time highs in US indices, and up more than 200% (without dividends) since Van wrote the second edition.
- Having said that, the Dogs strategy is one that doesn’t work as well as it did before it became well known.
Phase two is the market selection.
- Your markets should be liquid, with small spreads and lots of volume.
Van recommends avoiding new markets.
Whether it’s newly created futures contracts or stocks that have just been introduced onto the exchange. A lot of mistakes are made in such new issues.
He accepts that IPOs can work in bull markets, and says that a year is usually long enough to wait for a market to settle down.
Next, you should consider the exchange which makes the market.
- Do you understand the rules?
- Who are the market makers and the regulators?
- Are stops executed properly, or farmed (“tree-shaken”)?
Is the volatility of the market appropriate?
- The faster you trade, the more volatility you need in your chosen market.
You need enough volatility that given the size of your initial risk, you can still make a profit that is at least two to three times the size of that initial risk.
Does the market (in stocks) have securities of the appropriate capitalisation?
Speculative investors who are looking for sharp moves in the market want low-capitalization stocks (under $25 million). On the other hand, conservative investors want slow, smooth changes in price. You are much more likely to see this kind of behaviour in highly capitalized stocks.
Does the market suit your trading concept?
The less capital you have, the more important this selection process is to you. If you are a trend follower, you need to find markets that trend well. If you follow seasonal patterns, then you must trade markets that show strong seasonal tendencies – agriculture or energy.
You should also select multiple markets, with low correlations between them.
- You are hoping to increase your chances that at least one market is in a suitable condition to trade (eg. trending).
Phase three is the market direction.
If you accept “sideways” as a condition of the market, then you probably want a system that will keep you out of the market the 70 percent of the time in which you are not likely to make money.
Phase four consists of your setup conditions.
Setups are not usually criteria for entering the market. Instead, they are necessary criteria that you should expect before you will even consider taking a position in the market.
Phase five is market timing.
You’ve selected the markets you want to trade. You understand your concept, and the current market conditions fit your concept for trading. You also have several market setups, and those conditions have also been met.
One more key criterion should be met before you actually enter the market—the move you are expecting should start. Profitable traders and investors usually wait for the move to begin before they enter the market.
It turns out that few entry techniques beat random entry.
The best way of improving your odds is to make sure the market is moving in the direction you are expecting before you enter the market.
Short-term setups
Van recommends Connors and Raschke’s book Street Smarts as a source here.

![]()
Failed tests
Test setups are basically failed tests of previous highs or lows.
Turtle Soup is a failed test setup named after the Turtle Trader rule for entering the market on 20-day breakouts.
Today, most of these 20-day breakout signals are false breakouts—in other words, they don’t work and the market falls back.
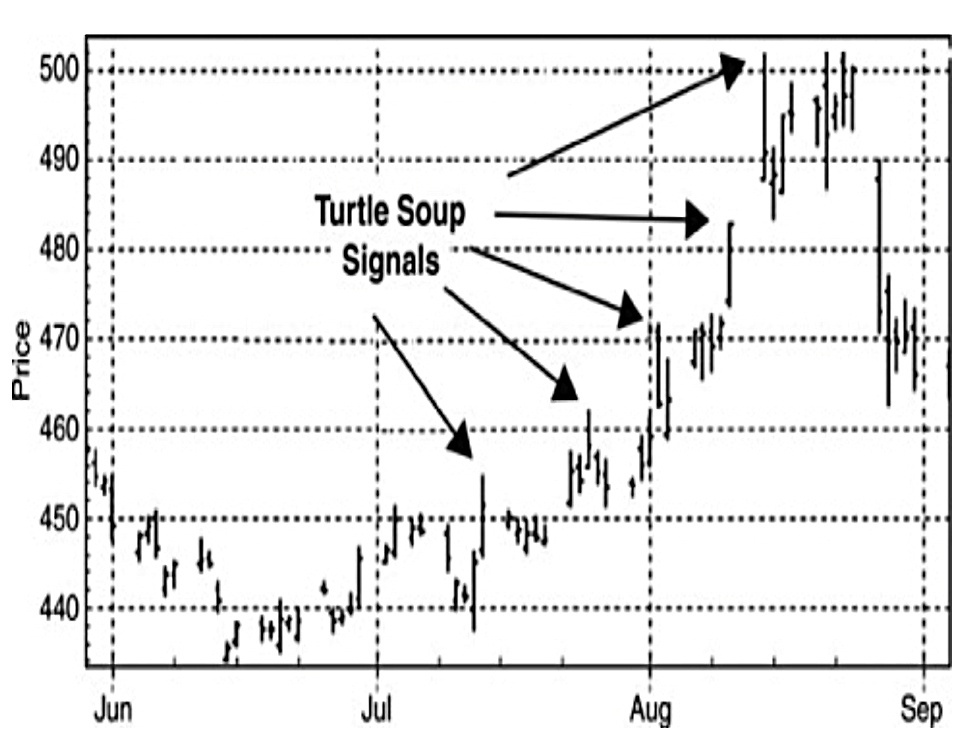
Here we are betting on short-term declines after the breakout high.
Another high-probability setup is based on the observation that when a market closes in the top part of its trading range, it has a strong probability of opening higher. The converse is also true. These are extremely high-probability setups with 70 to 80 per cent reliability for a more extreme opening in the same direction the next day.
Even though there is a high probability of the market opening up in the same direction, the probability that it will close in that direction is much less. In addition, when you have a trending day yesterday (that is, the market opening up at one extreme and closing at the other), there is an even greater probability of a reversal.
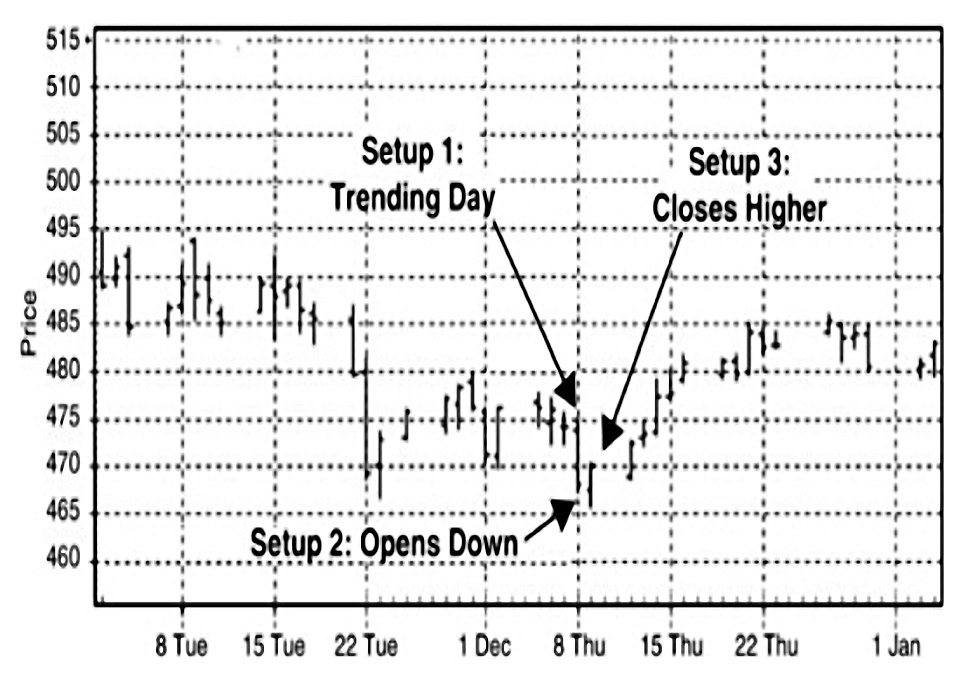
Here we are looking for all three signals.
If your goal is to do short-term trading, or “swing” trading, then failed-test setups are probably what you want to use.
Exhaustion
The next kind of setup is an exhaustion reversal, which is similar to a failed test but has extra evidence that the move is extreme and will not proceed.
These types of patterns can vary a lot, and many such climax moves are typically chart patterns that are difficult to objectively describe so that they can be computerized.
Van is not a fan of chart patterns, but singles out the gap climax as an example.
Such setups are based on two observations: (1) gaps to an extreme tend to be filled, and (2) days that reverse from market extremes tend to have follow-through the next morning. You might want another setup indicating high volatility such as this: the average true range of the last 5 days is two to three times the average true range of the last 20 days.
In my opinion, these patterns are dangerous. You are attempting to “stop” a freight train that is going very fast. Climax setups, in my opinion, are primarily for brave short-term traders.
Interestingly, for longer-term traders, Van sees them as warnings that you might be in for a short-term reversal.
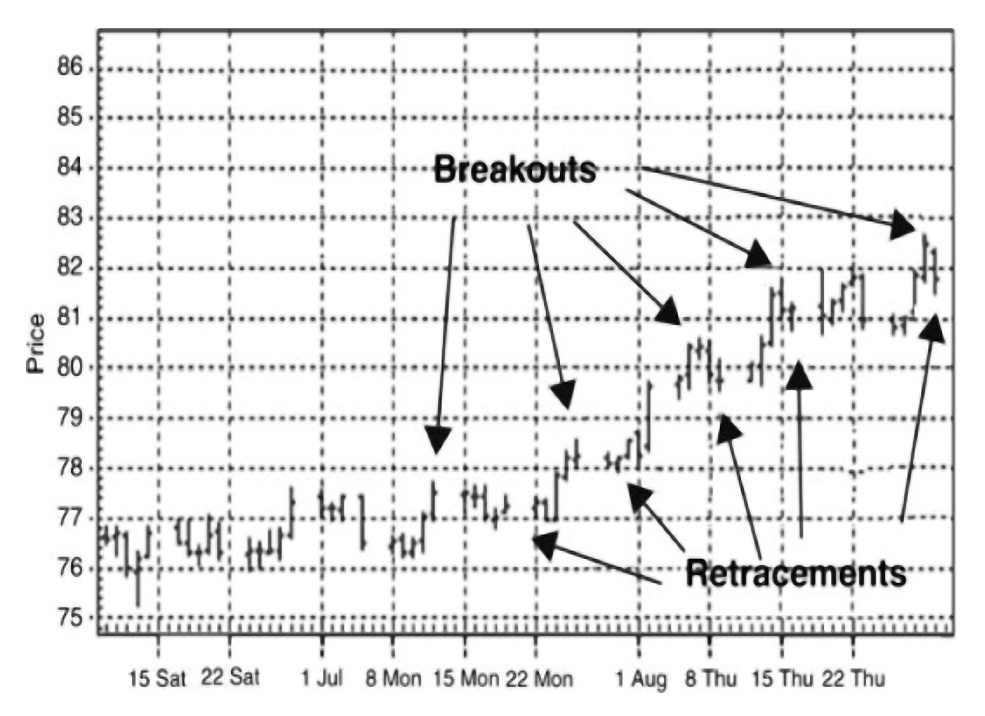
Retracements
The third kind of setup is a retracement, which has three parts:
(1) finding the longer-term trend; (2) getting some sort of pullback from the trend; (3) entering in the direction of the trend based on some third type of signal such as a resumption of the trend with a new high.
This type of setup dates back to Wyckoff in the 1920s.
Van likes retracement setups:
(1) they allow you to place tight stops and thus extract high reward-to-risk trades;
(2) you can use them for both short-term “swing” trading or for long-term “position” trading;
(3) they give you a way to get into a market that you might have originally missed; and
(4) they provide you with an excellent way to get back into a market once you have been stopped out.
Filters
Filters are indicators that are needed before you make an entry.
- The danger with indicators – and particularly a combination of multiple indicators – is that they can be over-fitted to past data.
Generally, the simpler your system, the better it will work trading the markets. Many different indicators will help you if each of those indicators is based on a different type of data.
Since filters/indicators are usually based on the same data (price), they are not generally useful.
Setups generally involve some additional data:
- time data (eg. seasonal cycles)
- sequential price data (eg. retracement setup)
- fundamental data (market or company-specific)
- volume
- component data (sectors, index constituents, advance/declines, upticks/downticks)
- volatility (see below)
- company management
These days, I guess you might add sentiment (eg. as measured from social media).
Volume and tick
Van provides some detail on how to use volume, via the Arms Index (the “TRIN trading index”).
- This is the ratio of advances to declines divided by the ratio of up volume to down volume.
Use a moving average of the Arms Index (typically use about five days). A reading above 1.2 indicates a potential bottom, and a reading below 0.8 indicates a potential top. These are short-term trading opportunities [and]should be combined with an entry signal of price moving in the expected direction.
With the tick:
An extreme reading can often predict a market turn—at least in the short term. You would simply trade some sort of reversal signal that occurs once this extreme was reached.
Volatility
Under this heading, Van talks about “narrow range” setups:
1. The market is in a trend as measured by any number of indicators such as being above or below a moving average or having a high ADX value.
2. The market moves into a narrow range, which might be shown by comparing the range of the last 5 days with the range of the last 50 days.
Van suggests that the current range should be less than 60% of the historic one.
- It appears this is an indicator that a big move (in one or other direction) is imminent,
This might also show up a narrowing in the Bollinger Bands.
Here’s a second narrow range setup:
1. The market has an inside day (that is, its price range is contained between the high and low of the previous day).
2. The market has the narrowest range of the previous X days.
Well-known setups
O’Neil CANSLIM
This has been widely publicised, not least in O’Neil’s book:

![]()
Van points out that CANSLIM is only part of a system:
You know very little about the actual entry into the market except that the N criterion also includes the stock’s making a new high. You know nothing about protective stops, nothing about how to get out of the market, and nothing about the most critical part of a system—position sizing.
CANSLIM is just setups, which is the least important part of a system.
Buffett Value
Van points out that Buffett has never written about his methodology.
- But he does give some clues in his annual reports (which we cover here), which have been collected along with his other essays in the book The Essays of Warren Buffett: Lessons for Corporate America by Warren Buffett.

![]()
There’s also The Warren Buffett Way by Robert Hagstrom.

![]()
Buffett, according to Hagstrom, has 12 criteria that he looks for before buying any company. Of the 12 criteria, 9 amount to setups, and the remaining 3 might be considered entry criteria.
Once again, not a system (but then Buffett is not a trader – his ideal holding period is forever).
Van classifies the setups:
- three are to do with the nature of the business
- three are to do with management, and
- three are financial (RoE, owner earnings and profit margins).
Kaufman Market Efficiency
Perry Kaufman’s book is called Smarter Trading.

![]()
Kaufman argues that longer trends are the most dependable, but they respond very slowly to changing market conditions. You need a methodology that speeds up an entry when the markets are moving and does nothing when the markets are going sideways
Kaufman’s solution is an adaptive moving average and a “market efficiency” filter.
As the market gets more volatile (noisy), one must use a slower trend to avoid getting whipsawed in and out of the market. At the same time, the faster prices are moving, the less significant noise becomes.
A price move that is either “cleaner” or “faster” can take advantage of a short time frame for entry; while a price move that is “noisy” or “slow” must use a longer time frame for entry.
Kaufman’s efficiency ratio divides the net price movement between two time periods by the sum of the [modulus of the] individual price movements.
This is a ratio of speed to noise, over 10 days.
- It produces a number between 1 (no noise) and 0 (lots of noise).
Kaufman maps this number to different speeds of signal/entry.
- Alternatively, you could just set a minimum value for a particular entry.
Gallacher fundamentals
Gallacher’s book Winner Take All provides a fundamental approach to futures trading.

![]()
Gallacher says that you must select markets according to value – [are] historically “cheap” or “expensive.”
This is easier for some markets than for others.
Then you need to work out which fundamentals drive the market.
- For some markets (eg. corn) demand might be stable, making supply the key.
- Held-over stock and harvest yields will drive the price.
Gallacher’s book is fairly old now, and the globalisation of the world’s economy could have impacted the drivers he identifies.
Van is not convinced:
It is very difficult to get any precise setups for commodity fundamentals. The only thing you really get is a bias that says (1) be neutral, (2) be bullish, or (3) be bearish.
Once you develop an opinion, Gallacher still believes in a price entry signal, limiting losses, taking profits systematically, and practising sound position sizing.
Ken Roberts
Ken Roberts is a commodity trading trainer who doesn’t seem to have written a book.
His setup is called 1-2-3:
Essentially, the setups require that the market make a major high or low and then show a reversal hook pattern. You open a position when it’s “clear” that the major trend is reversing.
The high/low is for the last nine months to one year.
- Point 2 is a retreat from the high/low.
- Point 3 is a move back towards the high/low, without reaching it.
When the market retreats again past point 2, you have an entry.
Again, Van is not convinced:
Setups in the Roberts method seem subjective to me. The major high or low is fairly objective, but the exact time parameters under which it occurs are not. [1-2-3] patterns occur in the market after almost every high.
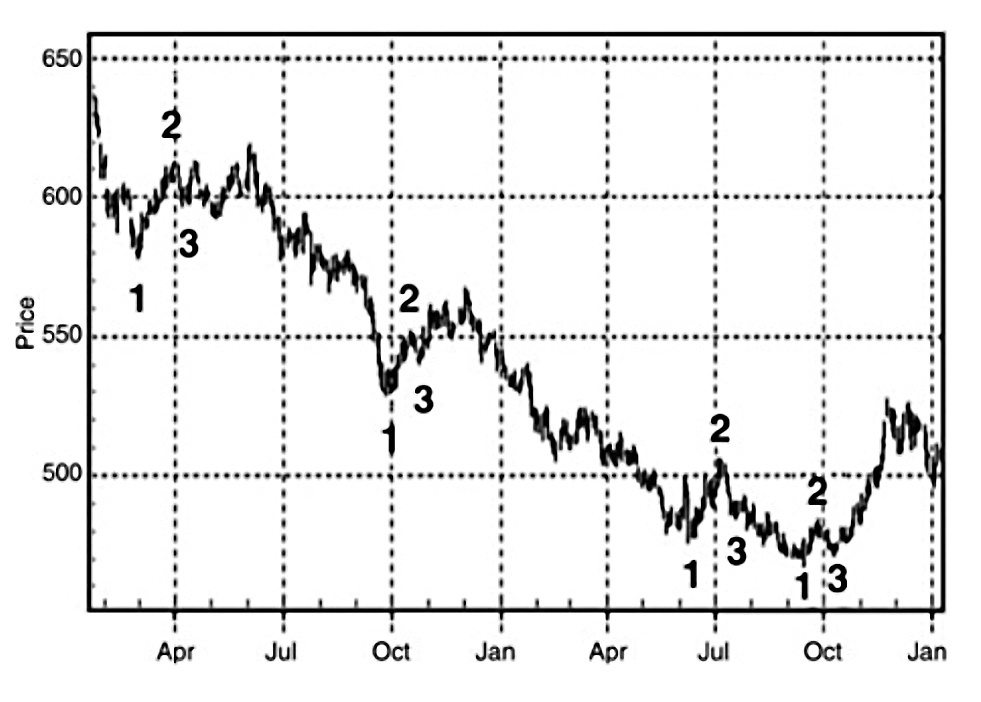
The chart suggests that the pattern has worked, but there are three earlier failed setups on the same chart.
Conclusions
It’s been heavy going today, and we’ve only covered a single chapter.
- So perhaps we will need more than eight articles in this series.
After all that, setups are not crucial.
- The best kinds use additional data (other than price).
Until next time.
Mike Rawson
Mike is the owner of 7 Circles, and a private investor living in London. He has been managing his own money for 40 years, with some success.