Van Tharp 3 – Concepts

Today’s post is our third visit to Trade Your Way to Financial Freedom by Van Tharp.
Contents
Concepts that work
Chapter 5 looks at the process of choosing a concept to trade.
The more you understand the concept you are trading, how it might behave under all sorts of market conditions, the less historical testing you need to do – Tom Basso
Van estimates that less than 20% of investors are systematic and that most of those simply use some indicators without thinking about the concepts which underly them.
Most people try to find a high-probability entry signal as their system. They typically have no concept of an exit or of adequate position sizing. This usually leads to a trading methodology with a negative expectancy.
There’s no need for a system to produce more than 50% winners – it’s how you manage the positions that matters.
- In the rest of the chapter, Van gets some successful traders to talk about the concepts that they use.
Trend following
Tom Basso, who we met in an earlier article, looks at trend following.
Although Tom is now retired, when he was trading, he was the most mechanical trader I’ve ever met. Tom traded two computerized trend-following systems.
Tom starts with the need for a trend:
No matter what the technique, if there is not a trend after you buy, then you will not be able to sell at higher prices. Trend-following indicators tell the investor when the direction of a market has shifted from up to down or from down to up.
The advantage of trend following is simple: you will never miss a major move of any market. The profits from just one trade can be substantial – one trade can make your whole year.
Another way of looking at this is that the fat tails which mean that return distributions are not normal are the engine which drives trend following.
The disadvantage of trend following is that your indicator cannot detect the difference between a major profitable move and a short-lived unprofitable move.
These short-term losing positions are known as whipsaws.
Most markets spend a large amount of time in non-trending conditions. Trending periods could be as little as 15 to 25 per cent of the time.
Which is why is makes sense to trade a lot of markets.
- Van suggests trading individual stocks as a way around this problem, since there are always some stocks that are trending (either up or down).
Tom makes the point that trend-following is one of the easiest techniques for new traders and that long-term signals are to be preferred since they result in lower transaction costs.
Fundamental analysis
The next section is by Charles LeBeau – another friend of Van’s who used to edit the newsletter Technical Traders Bulletin, and was also a CTA and hedge fund manager, but has since retired.
- More relevantly, Chuck also used to lecture about fundamental analysis at a “major university”, and ran a discretionary fundamental trading system.
Fundamental analysis [in futures trading], is the use of anticipated relationships of supply and demand to forecast the direction and magnitude of future price changes.
So this is not the fundamental anslysis we know from stocks.
Chuck is very much of the opinion that there is no need to be either/or about fundamentals and technicals.
- Why not use both?
Fundamental analysis has a distinct advantage over technical analysis in the area of determining price objectives.
I’m not convinced that this is a great advantage – I’m inclined to exit positions mechanically, say via trailing stops.
- For me, having a price target would only add to the stress of holding a position.
Chuck concedes that fundamental analysis is very imprecise.
You might be able to conclude that a particular market will probably make a “big” move in an upward direction at some vague time in the future. Fundamental analysis will rarely tell you when the price movement will begin or exactly how far prices will travel.
Chuck doesn’t recommend doing your own fundamental analysis.
True fundamental experts are devoting full time to this task, and their conclusions are readily available at no cost.
He recommends Consensus.
Chuck points out that news and fundamental analysis are not the same things:
Fundamental analysis predicts price direction, while news follows price direction.
That’s quite a bold claim, but Chuck makes it clear that he’s talking about reported news, eg. in the papers.
The media would often phone me after the markets had closed. If the market had gone up, I would give them some bullish news. If the market had gone down, I would give them some bearish news. There is always plenty of bullish and bearish news floating around.
Pending news will move a market longer and further than actual reported news. When the news is eventually reported, the market may well move in the opposite direction.
This is of course, “Buy the rumour, sell the fact” (or vice versa).
You also need to put the news into the context of expectation – bullish news, but less bullish than expected, is actually bearish.
- And the reaction may change with time – the initial reaction is often overdone or even in the wrong direction.
Chuck recommends looking for demand-driven markets rather than supply-constrained ones:
Price rallies motivated by supply concerns tend to be short lived.
He also says that you should wait until fundamental signals are confirmed by the price action.
You may have to wait for weeks or even months to take advantage of an accurate fundamental forecast.
Like Van, Chuck recommends a Schwager book: Schwager on Futures: Fundamental Analysis.

![]()
Value trading
Now we move onto value trading, a fundamental approach which applies to stocks.
- This section is written by Van himself.
Value investing (which I will take to be a slower version of value trading) is well known to most investors.
- Warren Buffett is probably the most famous value investor (along with his mentor Ben Graham), but his approach has evolved over the years.
Your goal is to buy when something is undervalued and sell it when it’s at fair value or when it is overvalued. You can also short it when it is overvalued and buy it back when it reaches fair value or becomes undervalued.
The key question you must ask yourself is how you determine worth.
Value has had a bad run over the last decade, as momentum/growth stocks have led the market.
- Many observers put this down to the rise of intangible assets (IP and goodwill), and the difficulty of working out which of these assets are productive.
Another factor is that the numbers behind the objective value approaches (such as Graham’s “net-net” approach) no longer work.
- Companies only sell for less than their liquidation value when they are about to be liquidated.
Nowadays, value investors have to rely on their own subjective calculation of “intrinsic value”.
Van recommends adding a trend overlay to value investing:
Never buy an undervalued stock when it is going down.
Van will buy a value stock when it has formed a base for two months, but he prefers it to be already going up.
Like me, Van is sceptical about value investing based on analyst earnings forecasts and recommendations.
Most analysts are just guessing at many of the variables they look at. There is no evidence that their forecasts are meaningful in terms of future performance.
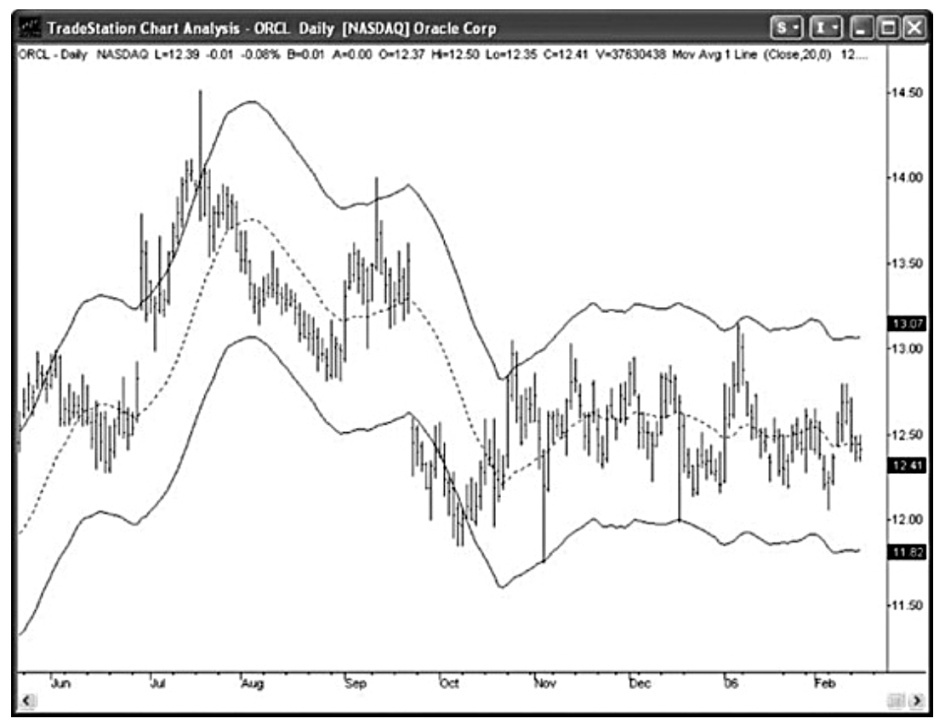
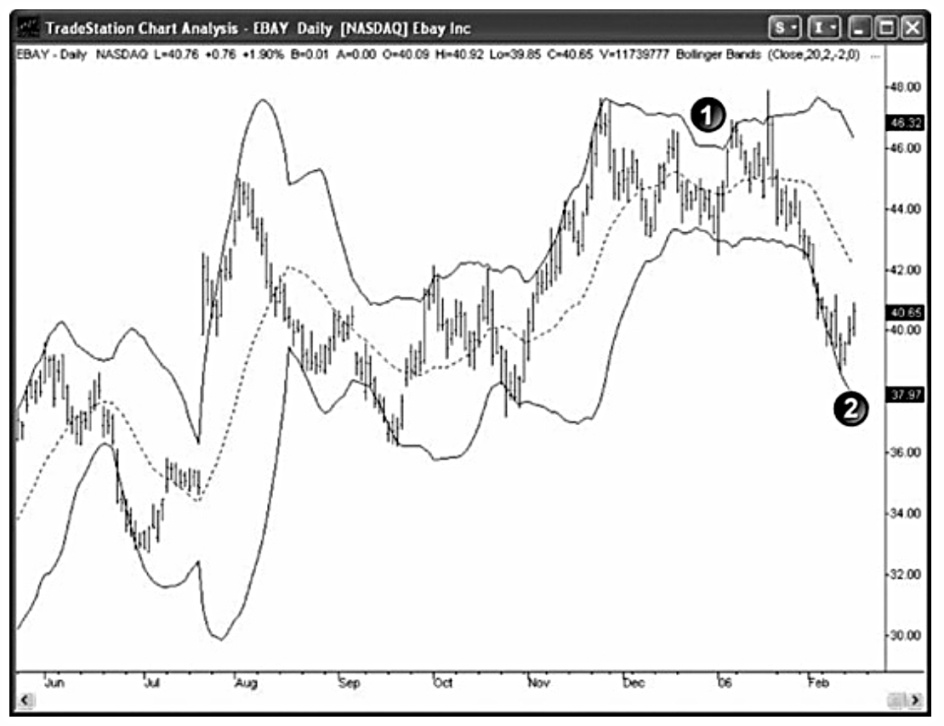
Band Trading

This is Van’s name for range trading.
- This section is written by D. R. Barton, who teaches in Vans’s workshops and writes a newsletter about range trading.
The attraction of range trading is that it works when trend following doesn’t – the 85% of the time when markets are going sideways.
A band trading strategy attempts to buy at the bottom of a trading range and sell at the top of the range.
DR notes that range trading can work in trending markets too, as shown in the chart above – the swings show up in the downtrend as well as the sideways consolidation.
DR offers multiple ways of defining ranges:
- Donchian channels (which uses the high of the last x number of days as the upper channel and the low of the last x number of days as the lower channel).
- Envelopes – a simple moving average (say 20MA) with upper and lower bands drawn at a user-defined percentage (say 5%) above and below the MA.
- Dynamic bands, where the distance between the bands varies, usually with volatility – Bollinger bands are the most famous type (where the lines are 2 standard deviations above and below the 20MA).
- ATR lines used the average true range to define the distance of the lines.
Setting the width of the bands is a large part of the art and science of band trading. Using a one-size-fits-all, such as a 5 per cent moving average envelope, insures against curve fitting.
But you might need to vary the percentage by the market (or across groups of markets with similar volatilities), or you risk overtrading volatile markets and under-trading less volatile ones.
There are two approaches to entries:
In a pure countertrend entry, you would sell (or short) at the first touch of the upper band, or buy it after a touch of the lower band. In the retrace option, you would wait and enter after a prescribed retracement back into the channel after a band had been touched or penetrated.
In the second case, the price is already moving in your favour before you enter.
- You then hold the position until the price touches the other band, at which point you prepare to reverse the position.
Range trading works under any market conditions (up, down, sideways) where there is sufficient volatility.
- It also produces more trades than trend-following which leads to a smoother equity curve (albeit at the cost of more commissions).
- This in turn supports more aggressive position-sizing and lower equity minimums.
The main issue with range trading is psychological – you need to make entries that are counter-trend (which is obviously difficult for trend-followers and momentum traders).
Seasonal trading
This section is by Jerry Toepke, the editor of Moore Research Center Publications.
- I should say at the outset that I’m not a massive fan of seasonal effects in the stock market, but certain commodities and futures (foodstuffs and energy, for example) could potentially offer more fertile ground.
Seasonality may be defined as a market’s natural rhythm, the established tendency for prices to move in the same direction at a similar time every year.
Jerry identifies four phases, not unlike the stage or box system used to trade stocks:
The four primary components of any cycle are (1) its low point, (2) its rise, (3) its high point, and (4) its decline. When translated into a seasonal price pattern, those components become a seasonal low, a seasonal rise, a seasonal high, and a seasonal decline.
Note that the pattern reflects both seasonal demand and a seasonal supply response – the peak price is not in the coldest month.
Seasonal patterns rarely appear as perfect cycles. A seasonal decline may typically be punctuated by brief rallies. Conversely, a seasonal rise may typically be punctuated by brief dips.
Jerry discusses several seasonal patterns in some detail but doesn’t explain how to trade them.
- Presumably, one bets on the traditional patterns appearing on schedule.
Spreads
This section is by Kevin Thomas, a former LIFFE floor trader.
Spreads are synthetic positions created from two or more futures or options.
They have several advantages over outright trading – a lower risk profile and a much lower margin requirement.
They can also be designed to have a much higher expectation of a profit (win rate).
The spread can be across time (long a nearby contract and short further out) or price (for example, two options on a stock at different strike prices).
- Greater distance between the two contracts generally means higher volatility/responsiveness.
Once a spread position has been taken, then it can be treated like any other position you would have. Trend-following and position-sizing models can be applied.
Arbitrage
This section was written by Ray Kelly, another close friend of Van’s who unfortunately died between the first and second editions of the book.
- Ray averaged annual returns of 40% to 60% between 1987 and 1994.
- He later retired to become a traders’ coach and run a spiritual retreat centre.
Arbitrage is the buying (selling) of a security in one market and the simultaneous selling (buying) of the same security in another market.
- The security must be mispriced in at least one of the markets in order for you to make a profit.
Your mission is to correct inefficiencies whether people want you to or not. You get paid to correct errors. Your job is to pick apart the strategy or concept of someone else piece by piece. If you don’t find anything, which is usually the case, you simply move on to another strategy or concept.
Arbitrage can be seen as morally dubious in the same was as shorting stocks, but for me, they are each part of the process of price discovery.
- However, I am personally sceptical that good opportunities for arbitrage exist today for private investors.
Arbitrage is usually time-sensitive. Once certain opportunities are discovered, competition usually lowers the profits, and regulators eventually plug the once overlooked loophole. This time frame is usually referred to as “the window.”
Eventually, others will figure out what I am doing and find a way to cut themselves in on the profit. This is called reverse engineering.
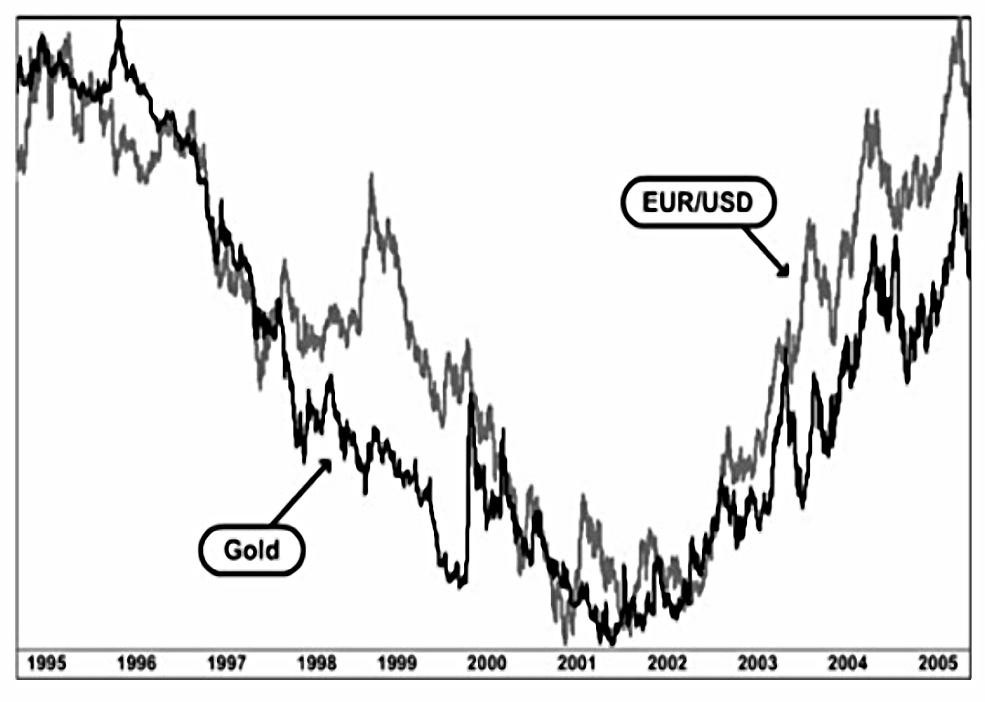
Intermarket analysis
This section is by Louis B. Mendelsohn.
No individual market operates in a vacuum – one market is quickly influenced by what happens in other related markets. Although there has long been general awareness of intermarket relationships, the difficulty is in quantifying these relationships in terms that traders can use.
My research since the mid-1980s has focused on developing a quantitative approach to implement intermarket analysis. Intermarket analysis, in my opinion, is just an expansion of traditional single-market technical analysis.
An important aspect of my ongoing research involves analyzing which markets have the most influence on each other and determining the degree of influence these markets have on one another.
Lou’s work appears to be a form of multi-factor regression to determine which assets are correlated with one another.
Studies on data from the last few years have shown a negative correlation between gold and the dollar of more than minus 0.90—that is, they almost never move in tandem but almost always move in opposite directions. [Not necessarily surprising, when the gold price is measured uin dollars.]
On the other hand, the value of EUR/USD versus gold prices shows a high positive correlation—that is, the value of the euro and gold prices often go hand in hand, suggesting these markets are both beneficiaries when funds are flowing away from the U.S. dollar.
Because of crude oil’s standing in world business and commerce, it is another key market to monitor because anything that affects its supply or distribution is likely to produce a response in other markets. That’s why terrorist attacks or natural disasters such as Hurricane Katrina that threaten the normal flow of oil supplies often cause an immediate response in forex and other markets.
As with the section on seasonality, Lou doesn’t really explain how to use intermarket analysis in trading.
- I think a big-picture macro approach can help with tactical approaches to asset allocation and risk appetite, but at some point, it needs to be translated into trading rules.
Magic numbers
The last part of the chapter is written by Van himself, and is called “There’s an order to the universe”.
- The flippant sub-heading is mine because I’m very sceptical of the idea.
To me, ideas like Elliott Wave and Gann theory are part of the hunger for religion, for the safety of the idea that a higher power is responsible for the state of the universe, rather than random chance.
- I have no such hunger – the universe is indifferent to us.
There are three types of “higher-order” belief systems, each design to identify turning points.
Up first is the concept of cycles, as made famous by Elliott Wave theory.
Here one assumes that the impulses of fear and greed follow a distinct wave pattern. The market is thought to consist of five up waves followed by three corrective waves.
The major upthrust of the market would consist of five waves up (with waves 2 and 4 being in the opposite direction) followed by three waves down (with the middle wave being in the opposite direction).
The third wave of five is considered the best to trade.
- It gets more complicated, however, as the waves have a fractal structure:
The first wave of the major movement would consist of another whole sequence of five waves followed by three corrective waves. Elliott decided that there were nine categories of magnitude of waves, ranging from the Grand Supercycle to the subminuette waves.
The task is to determine which wave series was responsible for any given turning point.
Concept number two relates to the influence of physical systems (eg. sunspot cycles and solar flares) on human behaviour.
- This is little more than astrology to me.
The third concept really is about magic numbers.
It asserts that certain “magic” numbers, and the relationships among the numbers, influence the markets.
Gann Theory is the most well-known example in this category, along with Fibonacci numbers.
- The numbers in these systems “predict” the levels of turning points, and in some cases also the timescales involved.
I’ve seen some pretty amazing correlations when Fibonacci retracements are placed on the chart. For example, 0.667, 0.618, and 0.5 do seem almost “magical” in predicting turning points.
However, there is also a nonmathematical explanation for this. If enough people believe in the power of magic numbers, then they will achieve a magic just from people’s faith in them. Remember that you can trade only your beliefs about the market.
Conclusions
That’s it for today.
- We’re about three-eighths of the way through the book, so there’s still a long way to go.
Today’s chapter offered a comprehensive survey of trading concepts but was not without its frustrations:
- Some concepts were familiar – trend, value
- Some were not easily tradeable by private investors – arbitrage, inter-market analysis, futures fundamentals, seasonal trading
- Some are not tradeable by anyone – magic numbers.
Throughout, there was a lack of detail on how to place the trades, though perhaps that might emerge in later chapters.
- The best section was probably the one on range trading, which offered a decent approach to implementation.
- Spreads are another approach worthy of further investigation.
In the next article, we’ll look at the big picture.
- Until next time.
Mike Rawson
Mike is the owner of 7 Circles, and a private investor living in London. He has been managing his own money for 40 years, with some success.