Van Tharp 4 – Big Picture and Expectations

Today’s post is our fourth visit to Trade Your Way to Financial Freedom by Van Tharp.
Contents
The Big Picture

![]()
Chapter 6 of Van’s book is about the big picture, or what we might call macroeconomics.
- Van calls this “mental scenario trading”.
I find that a lot of investors are sceptical about the usefulness of macroeconomic data.
- What has worked for me has been to pay attention to actual (historic) data, but to largely ignore forecasts.
Note that the macroeconomic picture has changed significantly since Van wrote the second edition of his book (around 2006) and so we will concentrate on principles rather than his detailed examples.
Obviously, the leading mental scenario traders (Kovner, Rogers, Soros, Druckenmiller) would take a different view, but I believe their skills to be uncommon, and the goal of this series of articles is to seek out techniques which can be applied by the average private investor.
- Van, on the other hand, does recommend that everyone build a mental scenario of what might happen over the next 5 to 20 years.
- Van suggests gathering a variety of data at least each month.
Which is fine, so long as you follow the principle of “strong ideas, weakly held”.
- You must be able to abandon your positions when new information comes in.
I would also recommend developing multiple scenarios so that you can plot a “least bad” course.
Here are a few of the things that Van thought in 2006:
- Emerging nations will be consuming increasingly greater quantities of raw resources.
- The US is in the beginnings of a secular bear market during which such issues as our massive debt and the retirement problems of the baby boomers must play out.
- The United States has probably reached its peak as a world power and will decline.
- The US must endure at minimum a general devaluation of the dollar (best-case scenario) and perhaps a fairly strong inflation.
These are not bad predictions, apart from inflation, even if they are happening more slowly than Van might have expected.
- It’s fair to say that he didn’t expect the extended QE response to the 2008 crash, but who did?
He expected a commodities boom and a switch to real assets, which didn’t last long, but maybe on the cards again in the 2020s.
- Let’s go through the key elements of Van’s big picture.
US Debt
The US national debt has been increasing rapidly in recent decades, and Van was worried about how things might end.
I am writing this during the Corona crisis of 2020, which has massively increased most western national debts.
- This makes it likely that low interest rates are here to say, thought the extent of money-printing means there must be a risk of inflation.
The economic consensus has moved on to the point where it seems much more plausible that a nation can run a debt of 100% of GDP in a low interest rate environment, provided that all its peers are doing the same thing.
- Certainly “austerity” and balancing the books appear to have gone out of the window.
China holds a lot of US debt, and some observers speculate that this could be sold in order to crash the dollar, but this would likely impact China negatively also.
- They would lose money on the bonds and have a much smaller market for their exports.
Corporate debt and consumer debt are also potential issues, but all debts appear serviceable in the current low interest rate environment.
- Who knows what will happen? We are in uncharted territory.
Secular Bear Market
The US has technically been in a secular bear market since the 2000 crash.
- Of course, 2003 to 2007 featured a debt-fuelled recovery.
Soon after Van wrote the second edition, we had the 2008 crash, followed by a 10-year bull market.
- And now in 2020, we have had a short crisis followed by rapid recovery (in markets, if not in GDP).
Stock prices are near all-time highs, yet commentators are now starting to talk about the possibility of another “roaring twenties” as the economy recovers from the effect of the virus.
- Personally, I will be looking for any sign of inflation moving above 4% pa.
Globalisation
As trade has become globalised since the 1980s, so have world economies.
- Manufacturing moved to China (and later to Vietnam and other nations) whilst services were outsourced to India.
- China has bought up supplies of raw materials around the world.
The Coronavirus has thrown globalisation into question.
- Perhaps global supply chains will be reengineered, or perhaps we will forget all about it once a vaccine has been rolled out.
Mutual funds
Until fairly recently, most stocks were held by individuals.
- Now people (and pension funds) buy funds, and funds management groups have a lot of market power.
Note that Van talks about (active) mutual funds, but since the book was written, the focus has moved to (passive) ETFs, a market dominated by three giant providers.
It’s fair to say that Van doesn’t like mutual funds (he prefers ETFs).
- I agree that they are expensive and likely to underperform.
I have largely abandoned OIECs (as mutual funds are known in the UK – they used to be called unit trusts) in favour of ETFs, though I also use investment trusts for asset classes which are hard to access via ETFs.
Van also worries about demographics.
- When the boomers retire (it’s happening already) their pension plans are likely to sell mutual funds, which might depress stock markets.
He’s somewhat gloomy about the prospects for the stock market, and gently directs his readers towards other sectors of the economy.
- I think it’s hard to ignore the stock market over the long term, but diversification is always a good thing.
Regulation
In the next section, Van gives some examples of changes to US regulations and taxes which impacted markets.
- It’s clear that investors in general need to be aware of the regulatory environment and any potential changes to it, but this issue is not specific to traders of any type.
Here in the UK, the erosion of the benign taxation environment for investors – which was only constructed in recent decades – is the main thing to look out for.
Potential changes include:
- SIPP annual and lifetime limits, and tax relief
- ISA limits
- Dividend and savings interesnt taxation
- CGT changes
- IHT changes
- VCT and EIS restrictions
- punitive taxation of buy-to-let and rental income
Human inefficiency
The next section is about behavioural finance:
- the fear and greed cycle
- prospect theory and investors’ inability to run winners and cut losses
- the focus on entries rather than position sizing and asset allocation
- the need to keep up with the Joneses
We’ve covered all these many times before.
Other factors
Other things that Van discusses briefly include:
- global warming (spot on there)
- the risk of wars (including the war on terror) and trade wars (though not pandemics)
- the health (obesity) crisis in the US (and now elsewhere)
Monitoring

Van uses an ETF monitor to keep up with what is going on in the world.
- Prices and trends are converted into a single rating.
The entire world is represented in this figure. The center nine boxes represent the overall U.S. stock market with big-cap stocks being on the top (DIA, SPY, and QQQQ) and small-cap stocks on the bottom (IJS, IWM, and WT). Value stocks are represented on the left. Growth stocks are on the right. And balanced stocks are in the middle.
Thus, at a glance you can tell that the place to be in the U.S. stock market on February 11, 2006, was in small caps (bottom row) and value stocks (left row). However, those areas are nowhere near the strongest areas on the chart. The top of the graph also shows other financial markets in the United States, including gold, long-term Treasury bonds, corporate bonds, and real estate.
A great trading system
Van says there are six key aspects to a trading system:
- Reliability (win rate)
- Profit size relative to loss size
- Cost of trading
- Frequency of trade signals
- Position sizing
- Account size (capital)
Van groups the first four under the heading “expectancy” and the last two under “position sizing”.
Expectancy
One of the real secrets of trading success is to think in terms of reward-to-risk ratios
Van (along with many others) uses R to describe the amount of money at risk on a trade.
- It can be the risk per unit (per share) or the total risk of the trade, so long as you use the same principles to calculate reward.
If you buy a $40 stock and you decide to get out if that stock falls to $30, then your risk is $10.
Or if you bought 100 shares of that stock, your risk could be $1,000.
- So a profit of $20 per share (or $2,000) would be 2R.
Your goal as a trader (or as an investor) is to keep your losses at 1 R or less.
The series of wins and losses from your trades forms an “R-multiple distribution.”
- The mean of that distribution is your system’s expectancy – the likely profit on a single trade.
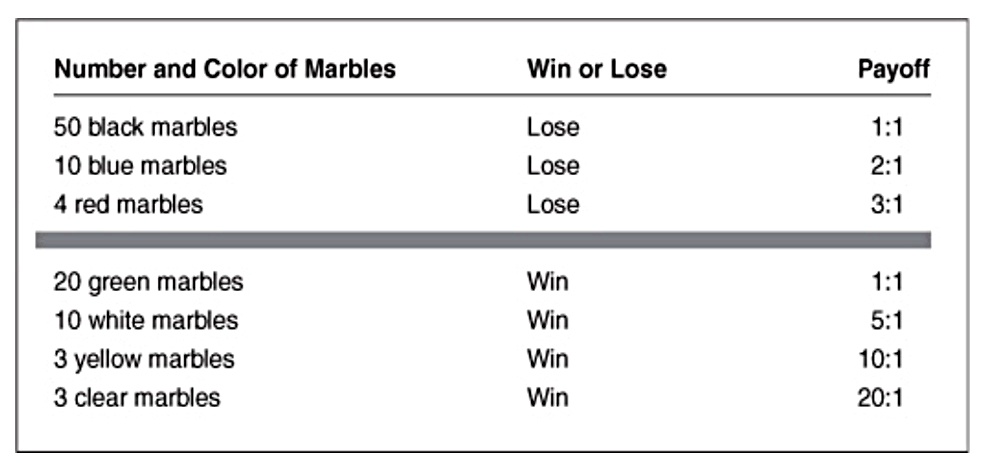
Let’s say we have a bag of marbles consisting of 60 blue marbles and 40 black marbles.Each time a marble is drawn out, it is replaced.
A blue marble wins 1R and a black marble loses 1R.
- Expectancy is 60 (blue) minus 40 (black) divided by 100 (number of marbles)
Which works out at 0.2R.
- If your trade size is $1,000, your expected profit per trade is $200.
If your system signals two trades per month, your expected monthly profit is $400 (or 0.4R).
- But you won’t make $400 every month.
On about half of your months you’ll make less money, and on half your months you’ll make more money.
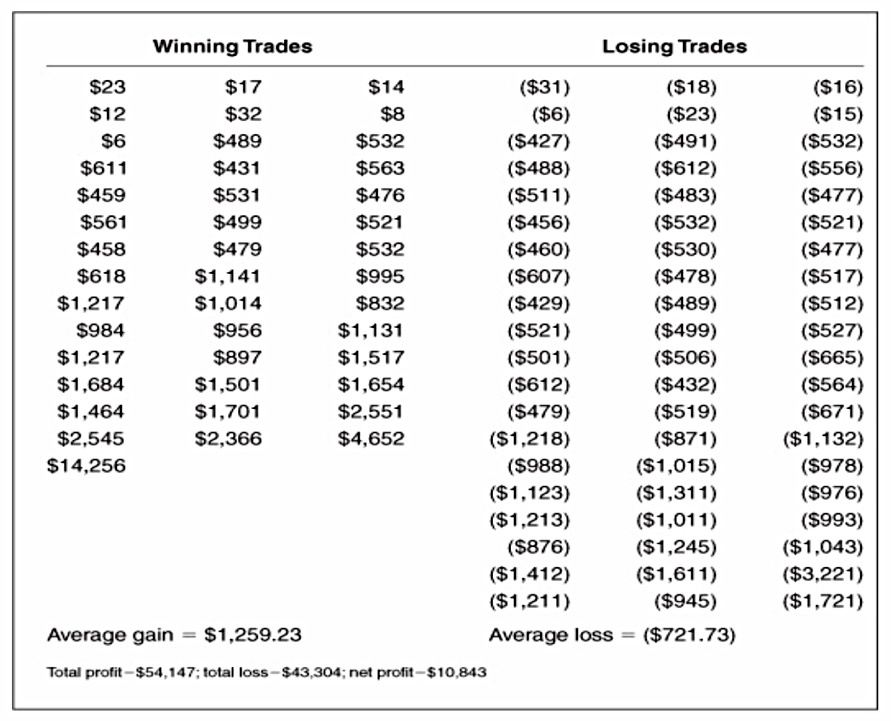
The next simulation is more complicated and uses the matrix above.
The chances of winning are only 36 per cent in this game. Would you want to play it? The R multiples of all the winning marbles total + 160 R, and the R multiples of all the losing marbles total –82 R. This means that the sum of all the R multiples in the bag is + 78 R.
Which is an expectancy of 78/100 = 0.78R.
- This is much better than the previous game, which had a 60% win rate but an expectancy of only 0.2R.
Van cautions that position sizing is also important, and we will look at this in more detail later in the book.
- Basically, if you bet too much, you can go bust early and not realise the expected long-run returns.
Your position size on any given trade must be low enough that you can realize the long-term expectancy of your system.
Another factor in choosing between systems is trade frequency.
- A high-frequency system with a lower expectancy per trade could lead to higher monthly profits.
Van refers to this as opportunity, but I prefer to call it signal frequency.
Prediction
Van illustrates the dangers of prediction (which can be seen as aiming for a high win rate) with a system that is 90% right, with 1R wins and 10R losses.
Expectancy = 0.9(1 R) − 0.1(10 R) = − 0.1 R – the expectancy is negative. This is a system through which you get to be right 90 percent of the time and you’ll eventually lose all of your money trading it.
Investors have a strong psychological bias towards being right and you must fight against it (more correctly, design around it).
Real trading
Real trading doesn’t involve bags of marbles, and you don’t know the true probabilities of winning and losing.
So you use samples based on historical testing or real trades.
The bigger our sample, the more likely we are to know how our system will really perform. I’d recommend a minimum of at least 30 trades just to get an idea of expectancy. However, 100 trades will probably give you a much better idea of what to expect.
Comparing two systems
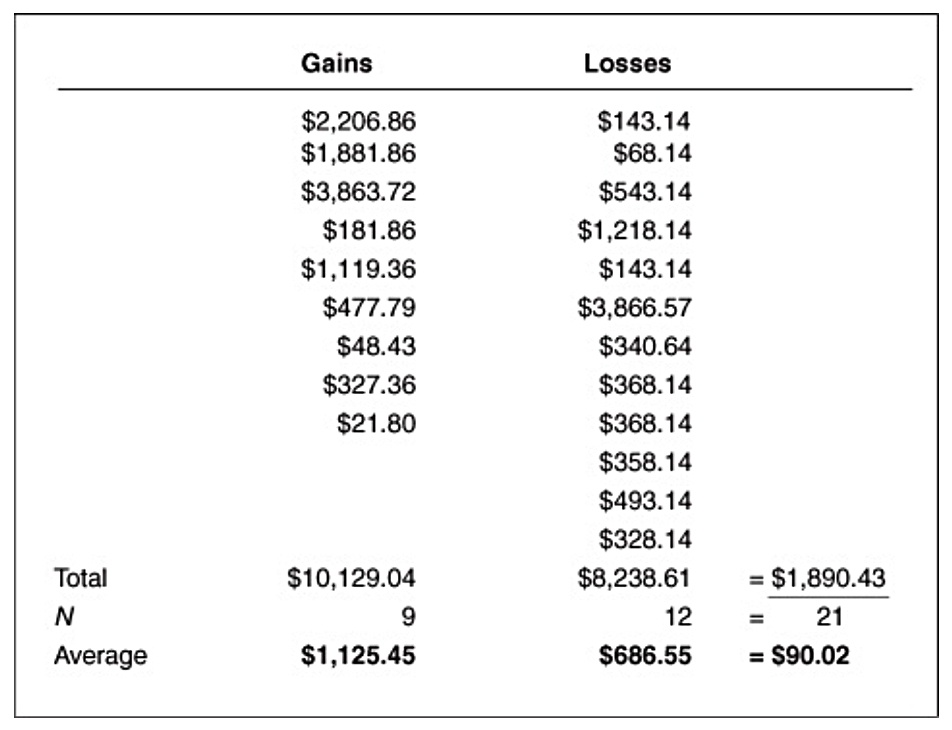
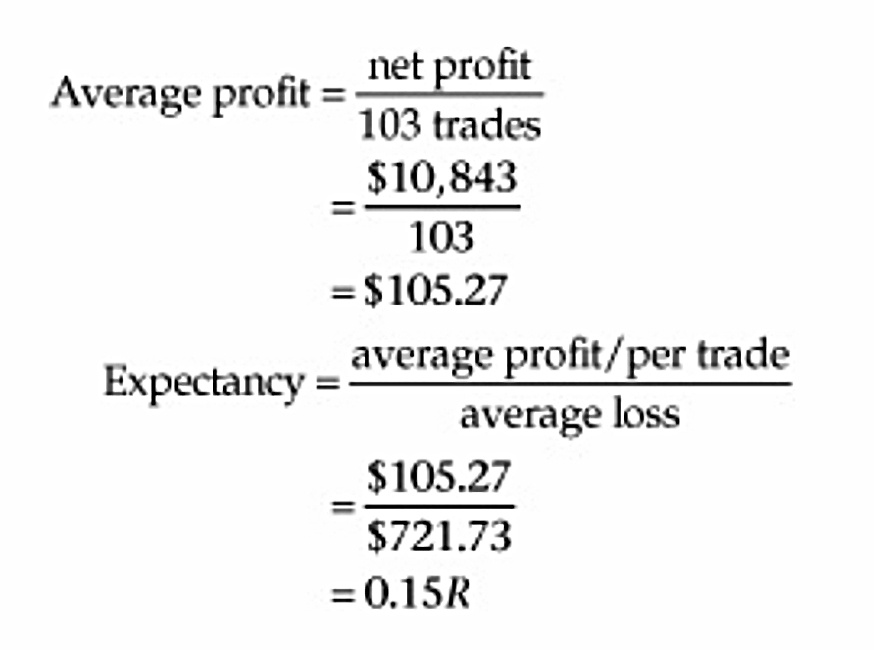
The system made $1,890.43 over 21 trades, an average gain of $90.02. Since the average loss is $686.55, we’ll assume that is equivalent to 1 R. If we divide $90.02 by $686.55, we get an expectancy of 0.13 R.
The biggest fault with Fred’s system is that it has a giant $3,867 loss that offsets the giant $3,864 gain. Without that one loss, Fred would have an outstanding system.

We will enter these gains and losses as if they were each a round lot of 100 shares to eliminate the effect of position sizing. The [adjusted] system made $7,175 over 18 trades, an average gain of $398.61 per trade.
This is much more per trade than Fred’s system, and Ethyl also has a higher win rate (55.6% vs 45%).
Ethyl’s system has an average loss of $1,527.63, so we must consider this to be her average risk or 1 R. We must divide $398.61 by the average loss – the net result is an expectancy of 0.26R (twice as good as Fred’s)
Fred’s profit was mostly a function of one good trade. The same is also true of Ethyl’s profit. Her one profit of $7,358 was bigger than her entire two-year net profit of $7,175. TThis is quite often true of good, long-term systems.
Next, we come to opportunity (signal frequency).
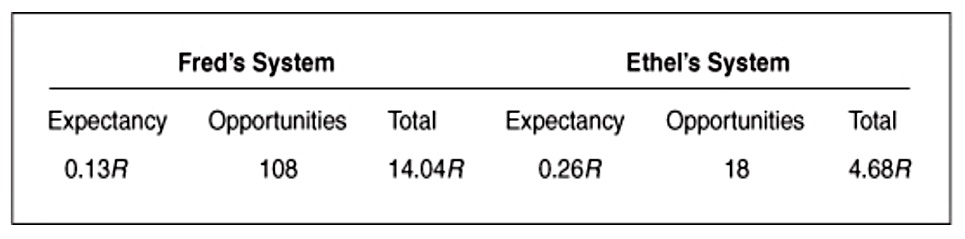
Fred’s system produced 21 trades in 4 months. Ethyl only made 18 trades in a two-year period.
When you look at the two systems in terms of expectancy times opportunity, then Fred appears to have a better system. However, this assumes that both investors have made the maximum use of their opportunities.
Conclusions
It’s been pretty good today.
- The macro picture has moved on since Van wrote the book, but his analysis still led to a useful consideration of the issues.
And the section on expectancy (and frequency) was simple and clear.
We’re about half-way through the book now, so I expect to write another four articles in this series, plus a summary.
- Until next time.
Mike Rawson
Mike is the owner of 7 Circles, and a private investor living in London. He has been managing his own money for 40 years, with some success.