Van Tharp 1 – Holy Grail and Biases

Today’s post is our first visit to a new book – Trade Your Way to Financial Freedom by Van Tharp.
Contents
Van Tharp

Van Tharp is a well known and well-respected trader and educator who has been around for a few decades now.
- I’ve never taken one of his classes, and this the first of his books that I have read.

![]()
Trade Your Way to Financial Freedom is intended to provide the core teachings from Van Tharp’s books, workshops and home study courses.
- We’ll be looking at the second edition, which dates back to 2007.
Foreword
The foreword to the second edition is by Chuck Whitman, the CEO of Infinium Capital Management, a “proprietary trading firm located in the Chicago Board of Trade”.
Chuck lists his principles of trading, which were mostly leaned from Van:
- Psychology – You are responsible for the results you get. When you get results that you don’t like, you made a mistake, and you can fix that mistake.
- Position sizing – You are going to have losses, and it’s important to limit the damage of those losses to achieve optimal compounded returns.
- Market selection – The market you trade is far more important than how you trade.
- Exits – The key to making money in the markets is in how you exit the market. You must limit your losses.
- Entries – ou can enter the market randomly and still make money.
He notes that these principles conflict with the belief of most investors:
The general trading public is primarily focused on picking the right stocks at the right time and they ignore what’s really important for success.
Preface
In his preface to the second edition, Van talks about financial freedom, or financial independence/FIRE as we call it now.
- Since the first edition of this book dates back to 1998, Van can be considered one of the pioneers of this concept, albeit that he wasn’t advocating the usual route to FIRE (frugality and index funds).
He also explains that while the core concepts of the first edition have not changed, some of his beliefs about the markets – and the markets themselves – have changed.
The preface to the first edition explains that people ask the wrong questions:
- What’s the market going to do now?
- What should I buy now?
- I own XYZ stock. Do you think it’s going to go up?
And when investors move on to “how” questions, they are still focused on how to identify high-probability entries and on signals and software.
- There’s little emphasis on exits, psychology or position sizing.
Holy Grail
The first part of the book is about self-discovery.
You cannot design a system that is right for you unless you know something about yourself.
Van starts by describing a volatility breakout system:
First, you take yesterday’s price range. If there’s a gap between yesterday and the day before, then add the gap into the range. That’s called the true range.
Now, take 40 per cent of yesterday’s true range, and bracket today’s opening price by that amount. The upper value is your buy signal, and the lower value is your sell signal (that is, for selling short).
If either value is hit, get into the market, and you’ll have an 80 per cent chance of making money.
The things missing from this pitch are:
- How to protect your capital if the market goes against you
- How or when to take your profits
- How much to buy or sell when you get a signal
- What markets the method is designed for and if it works in all markets
- When the method works and when it fails miserably
And if you had all that information, you would then need to know whether that system was right for you.
Does it fit your personality? Can you tolerate the drawdowns or the losing streaks it might generate?
Van notes that pitches for systems often describe returns in percentage terms, rather than in terms of multiples of the amount of money at risk (known as R).
- A 400% return sounds much better than 4R, which allows “gurus” to sell lousy systems.
Van sees the Holy Grail search (for the secrets that will bring you riches) as a metaphor for finding an authentic life and escaping the “wasteland”:
Joseph Campbell says that the wasteland symbolizes the inauthentic life that most of us lead. Finding the Holy Grail means leading our own life and thereby attaining the ultimate potential of the human psyche.
Van stresses the long-term benefits of a contrarian approach over following the crowd:
Most successful conservative investors are contrarians. They do what everyone else is afraid to do. They buy when everyone else is afraid, and they sell when everyone else is greedy. They have patience and are willing to wait for the right opportunity.
And also of getting in tune with the market:
Real money is made through intelligent exits. Making intelligent exits requires that the trader be totally in tune with what the market is doing.
You don’t need to win on the majority of your trades:
Good traders usually make money on less than half their trades. If you cannot accept that losses will occur, then you cannot accept a good trading system that will make a lot of money in the long run but might lose money 60 percent of the time.
Most successful speculators have success rates of 35 to 50 percent. They are not successful because they predict prices well. They are successful because the size of their profitable trades far exceeds the size of their losses.
The common theme is internal control.
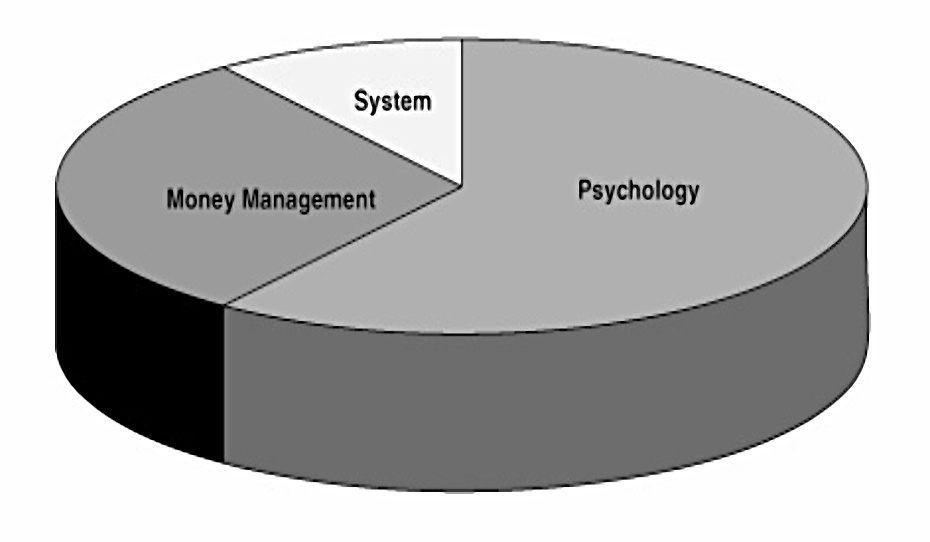
The diagram shows how most sophisticated investors split the importance of psychology (60%), money management (30%) and system development (10%). Van would go even further:
I’ve argued for a long time that trading is 100 percent psychology and that psychology includes position sizing and system development. We are human beings, not robots.
Modelling
The next section discusses whether trading can be taught, and looks at modelling (of successful traders) and at neuro-linguistic programming (NLP).
If at least two people can do something well, then the skill can be taught to most other people.
Van is a fan of modelling:
If you attempt to model one person, you will find a lot of idiosyncrasies that are unique to that person. But if you model the common elements of a number of good traders and investors, then you find what’s really important to the success of all of them.
The only common element that Van found to the systems used by 50 traders he modelled was that they all had the ability to find “low-risk ideas” (the definition of which will follow later).
- The next stage is to work out what beliefs the traders hold in order to carry out the necessary tasks.
The final test is to teach the model to others and see if they get the same results (as in the Turtle Traders experiment). According to Van:
We’ve been able to create some amazingly successful traders, thus verifying the model.
Van also has a model of how good traders learn their craft, which is the basis of this book.
- His third model is on position sizing and his fourth model is of wealth (or as he prefers, financial freedom from passive income, in which he includes trading income).
Bias
Chapter 2 of the book is about judgemental biases.
A basic source of problems for all of us is the vast amount of information we must process. Humans can take in only 1 to 2 percent of the visual information available at any one time. And for traders and investors the situation is at an extreme.
How do we cope? We generalize, delete, and distort the information to which we are exposed. We also generalize the information we do pay attention to by being selective.
We then have our computers sort the data so that an incredible amount of information is suddenly reduced to several lines on a computer screen. Those few lines are something we can process.
Indicators offer the same compression/distortion.
- People also cope by using heuristics – short cuts which help us to preserve the status quo – our beliefs about the markets.
Which could be the wrong way to use them:
Karl Popper points out that progress in knowledge results more from efforts to find fault with our theories than from efforts to prove them. The more we realize our beliefs and assumptions and disprove them, the more success we are likely to have.
System development biases
The first bias is representativeness, which Van illustres by mapping bar and candlestick charts to the underlying trades.
What doesn’t a typical daily bar show you? How much activity occurred [volume]. It doesn’t show you how much activity occurred at what price. It doesn’t show you when during the day the underlying was at a given price (except at the beginning or the end).
Of course, you can add volume data and drop down to shorter time-frames to investigate further.
- But that won’t tell you who is in the market, or who traded with who.
- Nor can you know the level of conviction of the market participants.
People tend to judge something by what it “looks like” as opposed to what its probability rate is. Do you consider the percentage of time that your predicted outcome follows your signal?
Van’s second bias is the reliability bias – that data is what it is supposed to be.
Most data vendors are fairly accurate with respect to daily bar charts, but when you start using tick data, 5-minute bars, 30-minute bars, and so on, accuracy goes out the window.
Bias number three is the lotto bias, which is different from the lottery preference – which means that people like long shots (originally horses with long odds, now blue-sky resources and biotech stocks).
- The lotto bias is the illusion of control which comes from manipulating data (originally, choosing your lottery numbers).
People think their odds are improved because they choose the numbers.
- Van draws a connection between this and people’s desire to be told what to buy and when to get in – their obsession with entries.
There are as many as 10 components to a professional trading system, and the entry signal is probably the least important.
Bias number four is the law of small numbers, which says that we don’t need much data in order to jump to a conclusion.
- This is a form of confirmation bias – we look for the edge cases which support our theory.
Bias number five is something Van calls conservatism, but which sounds like a confirmation bias:
Once we have a trading concept in mind, we fail to recognize, or even see, contradictory evidence. Most people, as a result, are not neutral with respect to the market, and they cannot go with the flow.
Bias number six is randomness bias.
Economists and many investors tend to assume that the market is random.
But in fact, the market is not random (by which Van means that it doesn’t conform to the normal distribution which is used is many simple statistics:
The distribution of prices in the market has extreme tails that you could never predict from normally distributed random prices. More extreme scenarios than you might imagine are right around the corner. As a result, any derived estimate of risk will be significantly underestimated.
The other aspect of randomness worth mentioning is our interpretation of sequences.
When a long trend does occur in a random sequence, people assume that it is not random. They seek patterns where none exist and assume the existence of unjustified causal relationships.
This results in a desire to – and belief that we can – pick tops and bottoms.
We want to be “right” and have control over the market.
Bias number seven is the need to understand.
- The way Van explains it, this seems to be a form of “paralysis by analysis” whereby investors never feel they understand enough about the market to be able to define exit signals and position sizing rules.
- Which means of course that they don’t really have a system at all.
Need to understand is also behind the “explanations” provided by the financial media after every market move.
- Van also lumps complicated technical analysis like Elliot Wave theory into this bucket.
Testing biases
The first testing bias is degrees-of-freedom bias.
A degree of freedom is a parameter that yields a different system for every value allowed. For example, a moving average based on 10 days will yield different results from a moving average based on 24 days. Thus, the length of a moving average represents 1 degree of freedom.
The more degrees of freedom (indicators) you have, the better you can fit your curve to the test data.
Unfortunately, the more a system fits the data upon which it was developed, the less likely it will be to produce profits in the future.
Fine-tuning is not necessarily a good thing when it comes to trading system development. Van says:
I strongly recommend that you not use more than 4 or 5 degrees of freedom in your system. So if you use two indicators (1 degree of freedom each) and two filters in your complete system, that’s probably all you can tolerate.
The second testing bias is postdictive error bias.
- This is using information which is only available after the fact.
For example, “highest” prices can only be known with hindsight.
The third testing bias is the lack of protection.
- Once again, Van stresses the importance of “low-risk ideas”, but this time he supplies a definition:
A methodology with a long-term positive expectancy and a reward (overall return) to risk (maximum peak-to-trough drawdown) ratio with which you can live.
In addition, you need to define a position size (as a percentage of equity) that protects the short-run downside and allows you to achieve the long-run expected returns.
- The big error here is trading in too large a size.
If you are a day trader and you get margin calls, then your risk level is way too high. That risk level may get you high rates of return, but it will eventually bankrupt your account.
Trading biases
The first trading bias is the gambler’s fallacy – the idea that trend or sequence could (or should) end at any time.
- Ten heads in a row don’t imply that the next coin toss will end in tails.
When you understand what’s involved in winning, you’ll tend to bet more during a winning streak and less during a losing streak. However, the average person does exactly the opposite: he or she bets more after a series of losses and less after a series of wins.
This is related to cut your losses and let your winners run (see below).
- It’s also relevant to the Kelly criterion, which tells you how much of your bank (your equity) to bet on each round.
Van’s second trading bias is a more explicit version of cut your losses – he calls it the “Conservative-with-Profits-and-Risky-with-Losses Bias”, which is not quite as catchy.
People have a bias towards sure gains but will gamble to avoid a loss.
- This has the unfortunate effect that when people are “behind”, they will gamble more to try to get even.
They also take a profit as soon as it is available, rather than letting it run.
The third trading bias is the “must be a winner” bias.
People have an overwhelming desire to be right.
This is another factor underlying the tendencies to (i) gamble to get even and (ii) take profits early.
Conclusion
That’s it for today.
- This is a thick book, and we’ve only covered around one-eighth of it today, so I expect another seven articles in this series (plus a summary).
It’s been a slow start, and we’ve come across the biases that Van points out before.
- But in the next article, we’ll start to look at the design of a trading system, which should be more interesting.
Until next time.
Mike Rawson
Mike is the owner of 7 Circles, and a private investor living in London. He has been managing his own money for 40 years, with some success.