Van Tharp 6 – Entries

Today’s post is our sixth visit to Trade Your Way to Financial Freedom by Van Tharp.
Contents
Entries
Chapter 9 of Van’s book is about entries, or what he calls market timing.
95 percent or more of the people who attempt to design trading systems are simply trying to find a “great” entry signal. Traders are always telling me about their short-term systems that have reliability rates of 60 percent or better.
But as we know, high win percentage does not mean large positive expectancy.
Entry plays only a small part of the game of making money.
There are two approaches to entry:
- reliability of the signal (high win rate)
- entries that have a high percentage of multiple-R winners
Van talks about “stalking the market” until conditions are optimal.
- This is reminiscent of Warren Buffett’s advice to only swing at the “fat pitches”.
Random entry
The first bar for an entry system is to beat random entry.
- Tom Basso famously experimented with random entries.
He was always in the market, either long or short, based on a random signal. As soon as he got an exit signal, he’d reenter the market again based on the random signal. Tom’s results showed that he made money consistently.
Van repeated the experiment with Tom, and produced similar results.
- Stops were at 3 times the 10-day EMA of ATR.
- Risk levels were 1% per trade.
- The system was always in 10 markets, long or short according to a coin flip.
It made money 100 percent of the time. The system had a reliability level of 38 percent, which is about average for a trend following system.
LeBeau and Lucas
In their book, Technical Traders’ Guide to Computer Analysis of the Futures Market, Chuck LeBeau and David Lucas took the opposite approach.

![]()
They used classic entry signals in a system with timed exits 5, 10, 15, and 20 days after entry.
Most of the indicators failed to perform any better than random – including all the oscillators and various moving-average crossover combinations that are so popular.
Entry systems which appear predictive (eg .60% win rate) often lose this advantage when they have a stop loss added.
- Many “winning” runs will then be truncated early.
Trailing stops (for winning exits) have a similar impact.
- So most trend-following systems have hit rates of less than 50% and rely on a few big wins each year.
Channel breakouts
First up in our survey of entry signals is the channel breakout.
You enter the market on either the highest high of the last X days on the long side or the lowest low of the last X days on the short side.
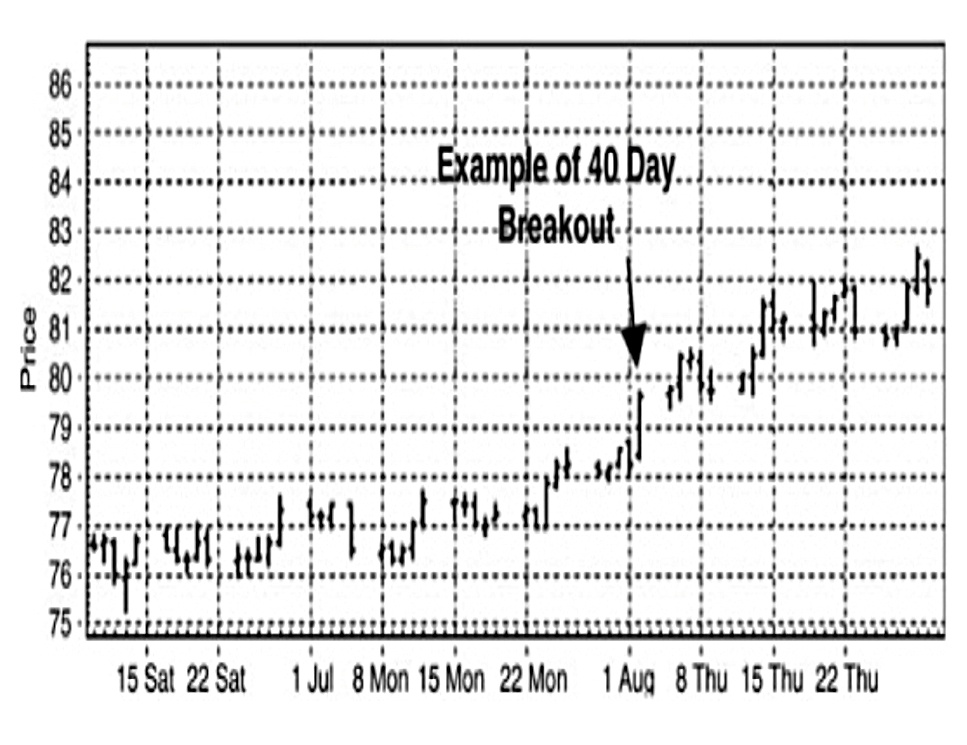
Channel breakouts were first used by Donchian and were then made famous by The Turtle Traders.
- The Turtles used 20-day breakouts, but then moved to 40-days.
Today, research seems to indicate that breakouts between 40 and 100+ days still work fairly well.
Shorter time periods may work for shorts.
Cole Wilcox and Eric Crittenden have also done some interesting research on channel breakouts with equities.
They entered at all-time-highs (ATHs) and used a trailing stop of 10 times the 45-day ATR (ie. a very wide stop).
They did 18,000 trades over a 22-year test period and found that their average trade made 15.2 percent. Winners, on the average, lasted 441 days and made 51.2 percent. Losers lasted 175 days and lost, on the average, 20 percent. They made money on 49.3 percent of their trades.
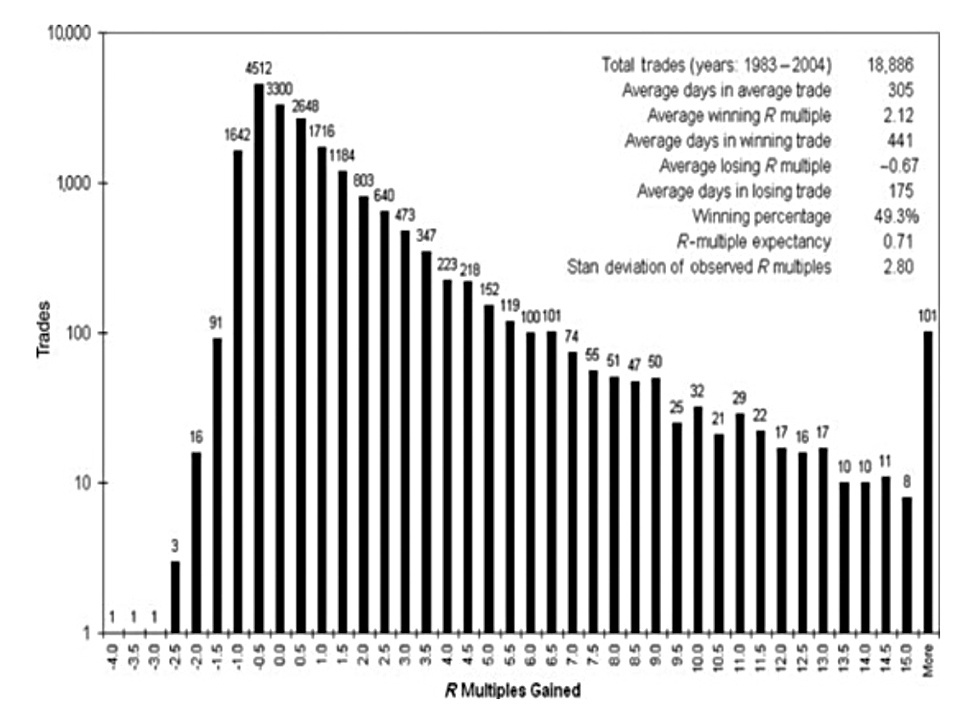
This table shows the R-distribution for the study.
The study shows how powerful simple entry techniques can be because you cannot get any simpler than entering when the stock makes a new all-time high. You also cannot get any simpler than their exit, which was a very wide trailing stop.
Van discusses how to combine a strong entry like this with a setup (a filter), before moving on to its limitations.
There are two major drawbacks with the channel breakout systems. First, they tend to produce large drawdowns. The second problem is that a lot of money is required to trade it successfully.
Narrower stops would help to fix the first problem.
We did extensive testing with entering on a 55-day breakout and exiting on a 13-day breakout. The results suggested that a million dollars was probably an optimal account size for this sort of system. A $100,000 account, in contrast, could trade only a few markets as opposed to the 15 to 20 markets that are normally traded with such a system.
Channel breakouts are good for not missing a trend, but their reliability is not much more than random, and you need enough money to trade 15 markets at once.
Van recommends a setup filter based on price:
You might require (1) a narrow band of volatility before the breakout occurs, and/or [2] a high relative strength in the stock.
Charts and patterns

I won’t spend much time on this as I think that charts, in general, are too subjective.
Some patterns are described as bullish and others as bearish. Types of chart patterns include daily patterns such as gaps, spikes, key reversal days, thrust days, run days, inside days, and wide-ranging days.
Other patterns are better described as continuation patterns. Finally, there are top and bottom patterns. These include double bottoms and tops, head and shoulders patterns, rounded tops and bottoms, triangles, wedges, and island reversals.
There are also candlestick patterns, which are more objective.
Van recommends Jack Schwager’s book, Schwager on Futures: Fundamental Analysis for more detail on this topic.
- Van agrees that most patterns are no better than 50% reliable.
Prediction
Van groups “techniques” like Elliott Wave and Gann under the heading of prediction.
My belief is that prediction has nothing to do with good trading.
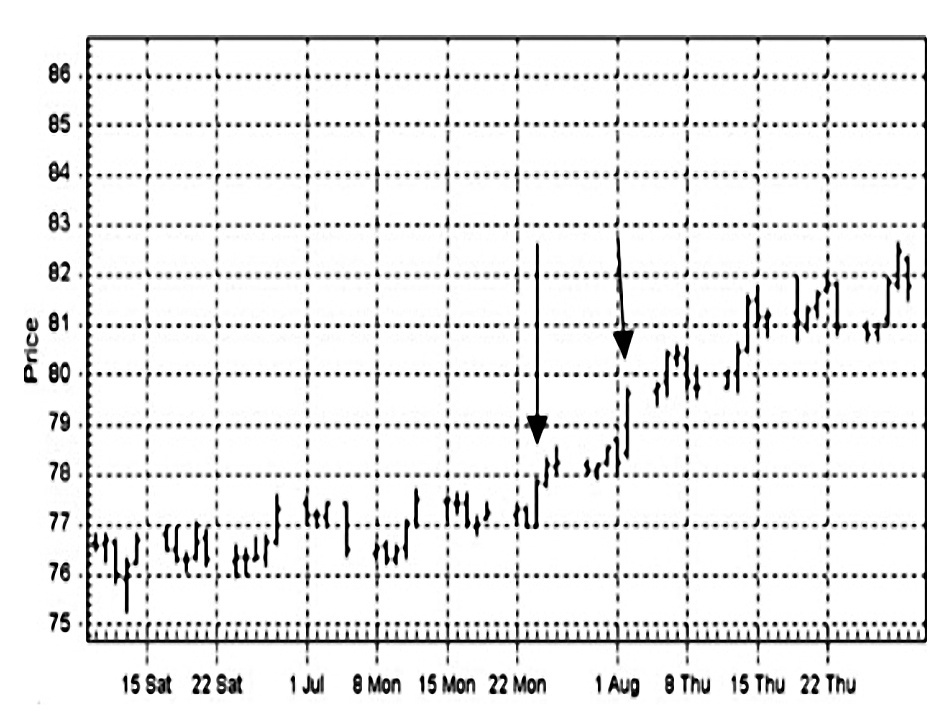
Volatility Breakouts
Volatility breakouts were first described by J. Welles Wilder in New Concepts in Technical Trading Systems.

![]()
Volatility breakouts are essentially sudden dramatic price movements. Suppose the average true range is about 3 points. We might define a volatility breakout to be a move of 0.8 times the average true range (from the prior close) in a single day or 2.4 points.
In this example, 0.8 ATR is not a big move, by definition (since it’s less than 1 ATR).
Wilder uses a 3 times ATR trailing stop.
I need to do more research here because at the moment I would be tempted to wait for a clearer signal (say a 1.5 times ATR move).
Directional movement
Two more concepts from Wilder are Directional Movement and Average Directional Movement, which are designed to tell you whether a market is really trending.
- The directional movement is the difference between today’s high and yesterday’s high (in an uptrend) or between today’s low and yesterday’s low (in a downtrend).
Inside days (today’s high and low are within yesterday’s range) are ignored.
- For outside days (today’s high and low each outside yesterday’s range) the larger of the up and down moves is used.
To calculate the indicator, you sum the up and down moves over a period (say 14 days) and divide each total by the ATR.
- The sum of these is the DI sum.
- The (absolute) difference between them is the DI difference.
The index is DI-diff/DI-sum*100.
LeBeau and Lucas found that anywhere from 14 to 20 days worked, and that 18 days was optimal.
The moving average of this index (over the same number of days) is known as the average directional. movement index or ADX, which is available in most charting packages.
- The higher the ADX, the more trendiness – anything above 15 is useful.
When the ADX is rising, indicators such as overbought or oversold oscillators will not work. Such oscillators work only when the ADX is falling.
There are two problems with ADX:
When the market changes direction suddenly, the longer-term ADX, may suddenly appear to go flat [wrongly] indicating a trendless market.
The second problem is lag – you won’t know you are in a trend until it’s underway.
- So ADX is not so useful for short-term traders.
Van offers three entry signals with ADX:
- Enter after crosses of the DI+ and the DI−. Long trades would occur after the DI− goes above the DI− and the high of the previous day is penetrated. This is Wilder’s original use of the indicator.
- Enter when the ADX increases more than 4 points in two days.
- Enter when the ADX reaches the highest value of the last 10 days.
Moving averages
Moving averages are very popular because they are simple and easy to calculate.
Evermore so, as technology advances.
If you have a lot of days in your average, then you will have a slow-moving average. If your moving average includes only a few days, then it will move quickly.
Van says that a lot of people use the one-year average to judge the long-term trend.
Colby and Meyers, in their Encyclopedia of Technical Market Indicators, found that the strategy of buying stock when the price crossed above the one-year average and selling it when it crossed below that average outperformed a buy-and-hold strategy by a large margin.

![]()
Donchian used 5- and 20-day MA crossovers.
Unfortunately, markets tend to trend about 15 percent of the time and spend 85 percent of the time consolidating.
During consolidation, MA systems get whipsawed.
- Some people have tried to fix this by using 3 MAs.
R. C. Allen popularized a method in the early 1970s involving the 4-, 9-, and 18-day moving averages.14 When the 4-day and 9-day averages have both crossed the 18-day average, you would enter the market—long if they are moving up and short if they are moving down.
When the 4-day signal crosses back across the 9, you get an exit signal. However, you don’t get a new entry signal until both the 4 and the 9 are on the same side of the 18-day average. Thus, this sort of system gives you a neutral zone.
Some systems use weighted MAs, which give more value to more recent prices.
- The exponential moving average or EMA is the most popular.
Some people also use displaced MAs (moved forward by a few days) to avoid whipsaws.
- There are also adaptive moving averages which change speed according to market direction, speed and volatility.
Oscillators
This group of indicators includes RSI, stochastic and Williams %R.
According to Van:
There is no evidence that entry signals based on oscillators have a reliability much better than chance.
Popular system entries
O’ Niell CANSLIM
The key portion of the entry is a price breakout from a consolidation period that has lasted anywhere from 7 weeks to 15 months.
Typical patterns would include a cup and a handle, a breakout from a long base, a saucer and a handle, a double bottom, or a double base.
The other critical pointis that the breakout should be accompanied by a large increase in volume – at least 50 percent above the daily average.
Buffett
Buffett’s business evaluation model probably does not have an entry technique. Buffett will buy a new company as soon as he discovers one that meets his criteria.
Kaufman
Van walks through Kaufman’s very complicated entry process in some detail:
Kaufman designed an efficiency ratio that was based both on the speed and direction of the market’s movement and on the amount of noise in the market.
We’ll assume an efficiency ratio that goes from zero to 1—zero meaning no market movement except for noise and 1 meaning that the market was all movement and no noise.
- For example, if the price only moved 1 point over a 10-day period, but the price moved up or down by 10 points each day, then you’d have a ratio of 1/(10 × 10) = 0.01.
The next step is to map the efficiency ratio onto a range of moving-average speeds.
- The smoothing constant for the fast speed is 2/(2 + 1) = 2/3 = 0.66667.
- The smoothing constant for the slow speed is 2/(30 + 1) = 2/31 = 0.06452.
- The difference between these two values, which Kaufman uses in his formula, is 0.60215.
Here’s the formula for deriving the scaled smoothing constant:
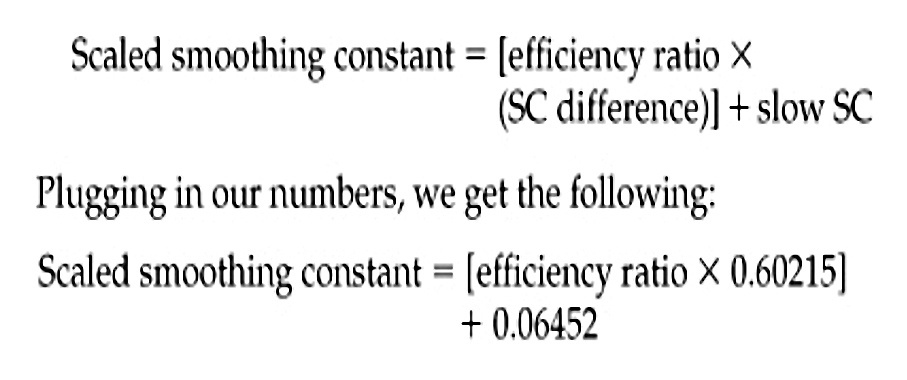
The formula for the adaptive moving average (AMA) is as follows:
AMA = AMA (yesterday) + SC2 × [today’s price – AMA (yesterday)]
Let’s say that yesterday’s AMA is 40. Today’s price is 47—a 7-point difference. In an efficient market, this would produce a major change in the average—raise the AMA by nearly 3.1 points—almost half of 7.
In an inefficient market, with an ER of about 0.3, the differential would hardly make a dent in the AMA, moving it up about 0.4 point. Thus, you’d be much more likely to get a trade from a movement in the AMA when the market is efficient.
You buy the market when the AMA turns up and you sell when the AMA turns down.
But you need a filter to avoid whipsaws:
Filter = percentage × standard deviation (1-day AMA change over last 20 days)
Kaufman suggests using a small percentage filter for futures and forex trading (that is, 10 percent) and a larger percentage filter (that is, 100 percent) for equity and interest rate markets.
Add the filter to the lowest price in a downtrend for a buy signal, and subtract the filter from the highest price in an uptrend for a sell signal. This is basically your adaptive entry.
What a palaver – I think I’ll stick to breakouts, ADX and MAs.
Gallacher’s Fundamentals
Gallacher believes in determining the fundamentals of the market as a setup. When the fundamentals are strong, then you can enter in the direction that those fundamentals suggest.
Van suggests a channel breakout of 50 days or more as an entry signal.
Roberts 1-2-3
Ken Roberts has two setups:
- The market must make a 9-month high or low.
- The market makes a 1-2-3 reversal.
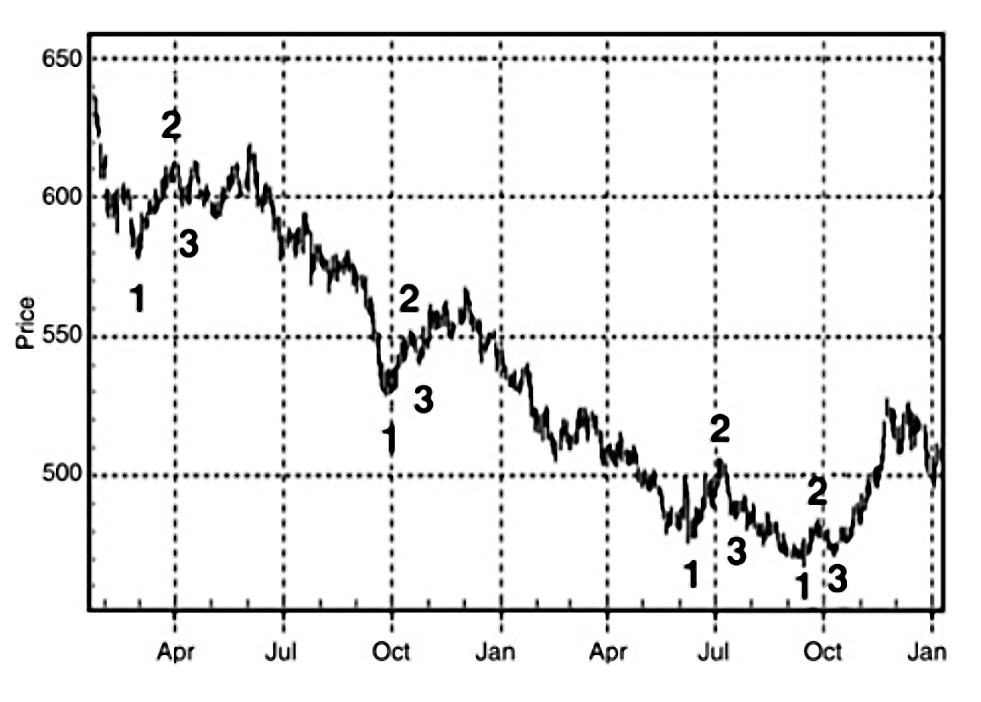
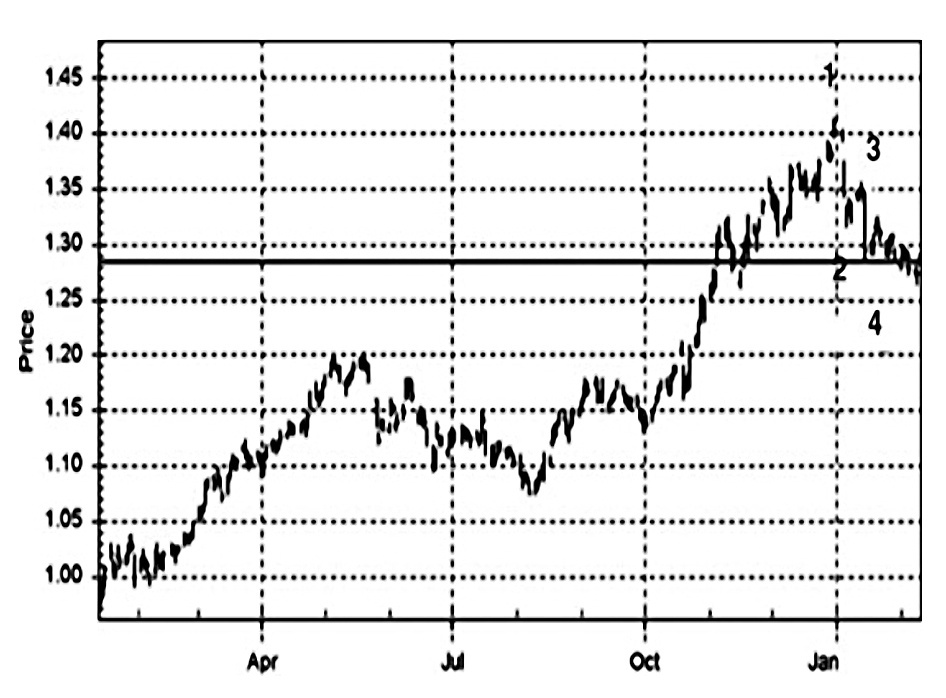
You enter the market when it again moves toward point 2 and makes a new extreme price. You could also enter as soon as the price at point 2 is passed in the direction you expect the market to move.
The assumption behind this method of trading is that after the market has done a 1-2-3-4 pattern, with 4 being a new extreme in the opposite direction, the market will turn around.
Quite often the market doesn’t turn around. Instead, it goes into a long consolidation period that could create many whipsaws.
Conclusions
That’s it for today.
- It’s been fairly hard going again, but we did learn some useful stuff about entries.
The first thing is that they aren’t crucial to trading success, and the second is that there are some fairly simple methods we can use – breakouts, MAs and ADX.
- Until next time.
Mike Rawson
Mike is the owner of 7 Circles, and a private investor living in London. He has been managing his own money for 40 years, with some success.