Weekly Roundup, 20th March 2018

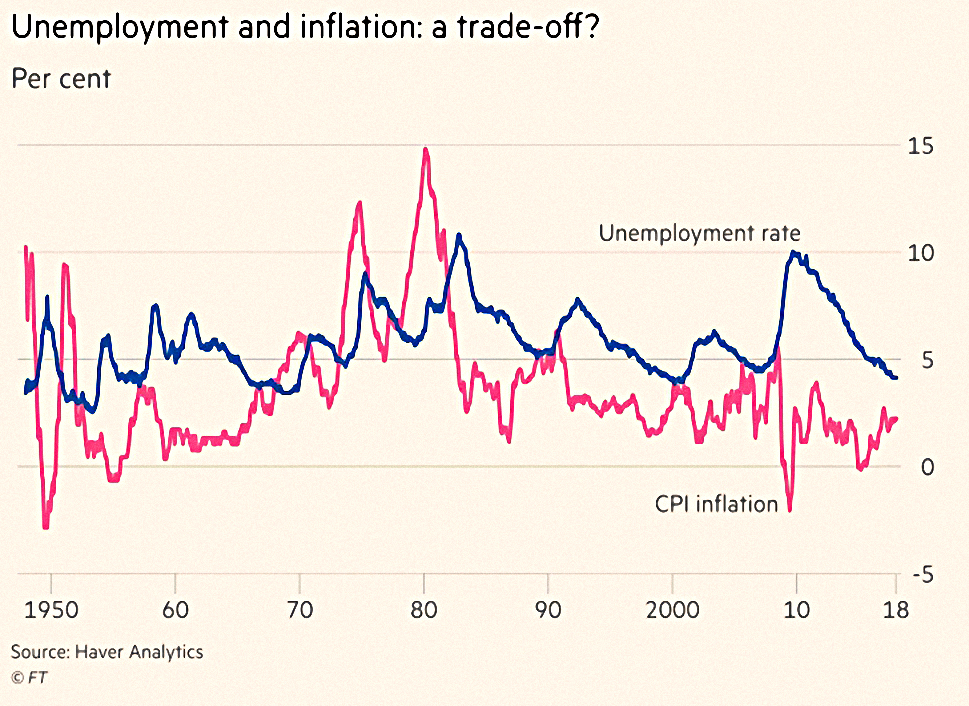
We begin today’s Weekly Roundup in the FT, where John Authers was discussing the Phillips Curve.
Contents
Phillips Curve

The Phillips Curve was invented in the 1950s by an economist from New Zealand.
- It states that there is a trade-off between inflation and unemployment, and that all that central bankers can do is choose which position along the curve they would like to be at.
- For example, 3% unemployment might imply 6% pa inflation.
We have a rate-setting meeting of the Fed this week, and what they decide will depend on how new chairman Jay Powell views the Phillips Curve.
- Will the persistent low unemployment in the US lead to higher wages, and hence more inflation?
Since the current inflation rate is close to the Fed target of 2% pa, more interest rate rises would be needed to control a higher inflation rate.
- Current expectations are for three rate rises in 2018.
Could this rise to four?
- There are eight meetings of the Fed committee each year, but only four with a post-meeting press conference.
The Fed only raises rates at the meetings with a press conference.
- But perhaps Powell will hold a presser after all eight meetings.
Milton Friedman in 1969 said that the Phillips Curve could not be true, since workers would eventually realise that they needed above-inflation pay rises to make progress.
- So the trade-off is actually between unemployment and accelerating (“runaway”) inflation.
- The “stagflation” of the 1970s made Friedman’s interpretation seem to be the correct one.
John says that current views on the Phillips Curve vary widely.
- In the past week he had received 14 pieces of research mentioning it.
The Phillips Curve is variously dead, re-emerging, at last awakening from long slumber, and “potentially more aggressive”.
John concludes that there is no point in over-reacting to monthly changes in inflation as they may not reflect the underlying trend.
- So recent market reactions to the numbers are unjustified.
And perhaps the real focus of this week’s Fed meet is whether Powell seems as committed to low and stable inflation as was his predecessor.
Spring Statement
We covered the Spring Statement last week in its own post, but there were a couple of follow up articles over the weekend.

Kate Beioley looked at the proposed “patient capital” EIS funds.
- These funds might allow CGT write-offs, or up-front income tax relief (it’s currently paid when the underlying investment is made, but can usually be carried back a year).
- The other possibility is that dividends could be made tax-free (as with VCTs) – this might prove popular with retirees.

Claer Barrett looked at the short-lived plan to scrap copper coins.
The Economist also covered the Spring Statement, but was predictably negative, blaming Brexit for slow growth.
Tiggerishness

Merryn used the Chancellor’s channelling of Tigger to look at why it is still possible to be Tiggerish about the markets.
- The bull market really only started in April 2015 when the FTSE broke through the previous high (from 2000) – so it’s not old really.
- I sort of agree with this logic, but I would probably use the 2007 high, which was a bit lower and was surpassed in 2013.
- Note that even though the US recovery has been stronger, the 2007 high was still only passed in 2013.
- Although the US CAPE is now more than 30, and has only been higher in 1999 and 1929 (not a good sign), things are more complicated than that.
- Average earnings over 10 years are still depressed by the low earnings in 2008 and 2009.
- Adjusting for this brings the CAPE down from 33 to 26.
- If you account for low interest rates lowering return expectations, you can get down to 24.
- Take out the tech firms that are the most expensive, and it gets even lower.
- The price rises in the US are earnings-led, rather than being the result of multiple expansion.
- Which means that this particular melt-up need not be followed closely by a meltdown.
- Brexit fears mean that the UK market is one of the cheapest in Europe.
- Domestically-oriented stocks are even cheaper, costing 15% less than exporters.
I think she made a pretty good job of it.
Consumer watchdogs

In another follow-up article, Lindsay Cook looked at all of the UK consumer watchdogs in the light of the Channel 4 “expose” of FOS that we reported on last week.
Meanwhile FOS said that the C4 programme gave an “unfair impression” but promised to review the claims coming out of the the undercover operation:
The Dispatches programme gives an unfair impression of us. Every day we make difficult judgement calls that affect people’s lives. Our people are committed to doing the right thing.
Of course, it’s always important to know where improvements can be made. A review of the concerns raised in the programme will be undertaken.
Nicky Morgan MP, chair of the Treasury Committee, has asked for a response from the FOS by 27
March.
Mrs Morgan has asked Caroline Wayman (the CEO) to address:
- What evidence is there to assure Parliament that the problems identified in the
programme have not led to poor decision making at the FOS? - What are the FOS’ processes to undertake quality control on previous decisions?
- Does the FOS have the ability to reopen cases that it feels it may not have decided
correctly? - The programme suggested that there is a potential bias to decide in favour of a bank,
since that led to an easier path to closing a case. Does the FOS recognise that potential
bias, and if so, how does it combat it?
She has also asked the FOS to provide details on “seemingly forgotten cases and unopened correspondence” and to comment on the training and specialism of FOS staff, as well as providing details of the number of people affected by alleged errors or improper handling of cases.
The Petro
Buttonwood looked at the Petro, a crypto-currency from Venezuela’s incompetent government.
The government’s white paper promises that it will be:
An instrument for Venezuela’s economic stability and financial independence – a sovereign crypto asset backed by oil.
Private sales began in February, and it will be offered to the public from today.
It’s hard to see who will trust the socialist regime that has (according to Buttonwood):
Debased the bolívar, expropriated private enterprises, ridden roughshod over the country’s constitution and faces sanctions from the United States and the European Union.
Buttonwood thinks that a crypto-currency is not a bad idea in principle, since it should be free from political interference.
- With inflation at 100% per month and economic output down 40% in five years, the Petro might help.
But in practice, its probably just a ways to raise cash despite US sanctions.
- That in turn could boost oil production and FX reserves.
- But the US has said that buyers of the Petro will be violating sanctions.
100M Petros have been “pre-mined” at a reference level of $60 per barrel, giving a nominal valuation of $6bn.
- The government claims that $5bn of this has already been sold.
It’s a bizarrely small amount to issue, being less than half the annual interest payment on the national debt.
- And the government’s switch from the Ethereum platform to the smaller NEM – which would be easier to manipulate – does not inspire confidence.
With that possibility of manipulation, and no direct link to oil (the Petro can’t be exchanged for oil), the new currency looks a lot like the existing Bolivar.
Incremental annuities

Henry Tapper alerted me to the concept of “incremental annuities“.
- US firm Blueprint Income plans to sell small chunks of annuities that provide either immediate or deferred guaranteed income.
- You need $5K to get started, and can them buy more for as little as $100 per month.
For this service, Blueprint plans to charge a commission of between 1% and 4% of the sum invested.
The basic idea of buying annuities in small chunks is a good one, and I’d love to see deferred annuities in the UK.
- But until interest rates rise substantially, annuities will remain horrible poor value.
And Blueprint’s commission will just make things worse.
Twitter pics
I have six for you this week.
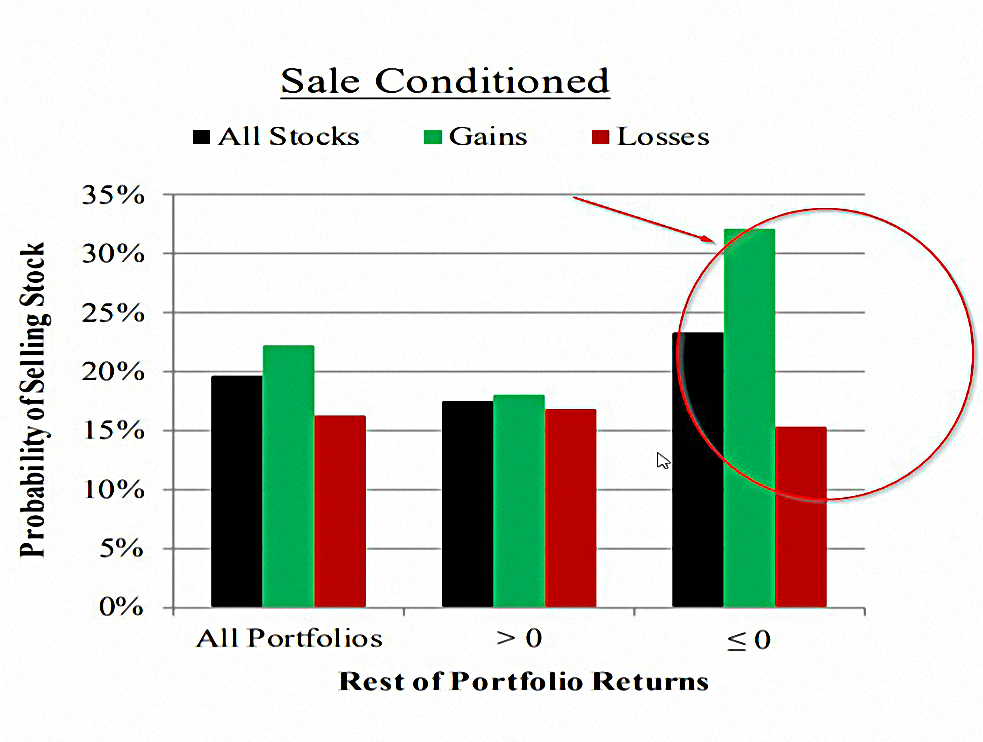
The first is from a new paper which shows that people are more likely to sell their winners and hang on to the losses (the wrong strategy – you should instead Cut Your Losses and Let Your Winners Run) when their portfolio as a whole is down.
To quote from the abstract:
We find no disposition effect for a stock if the remaining portfolio is at a gain. We find a large disposition effect only when the remaining portfolio is at a loss.
The disposition effect is the tendency of people to value the things that they already own more highly than they are valued by those who do not own them.
- It is often used to explain why people hang on to losing stocks.
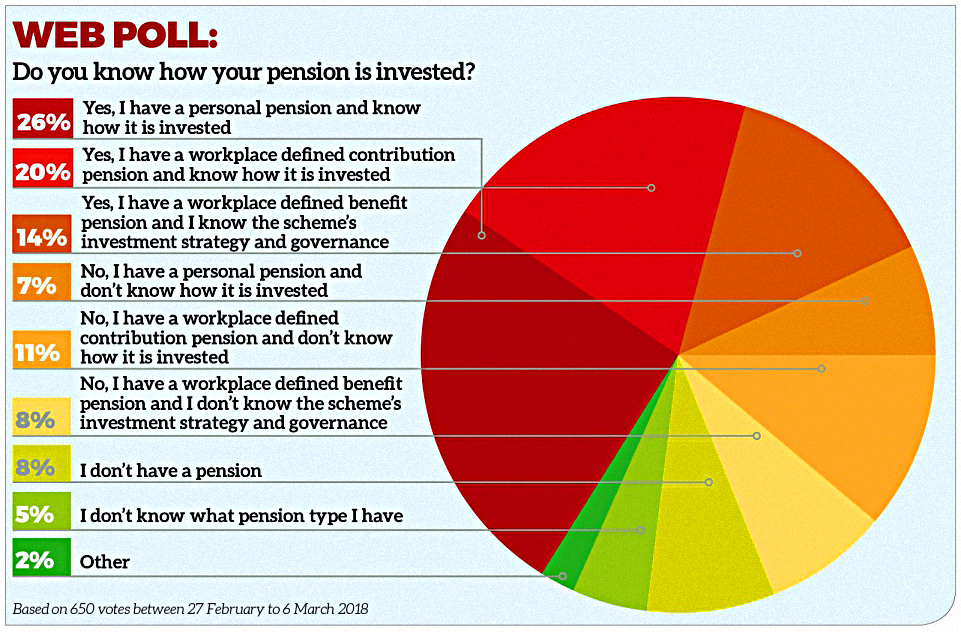
The second shows what people in the UK know about their pensions:
- A quite impressive 60% of investors know how their pension is invested.
- 32% don’t know how it is invested
- The rest don’t know anything about their pension.
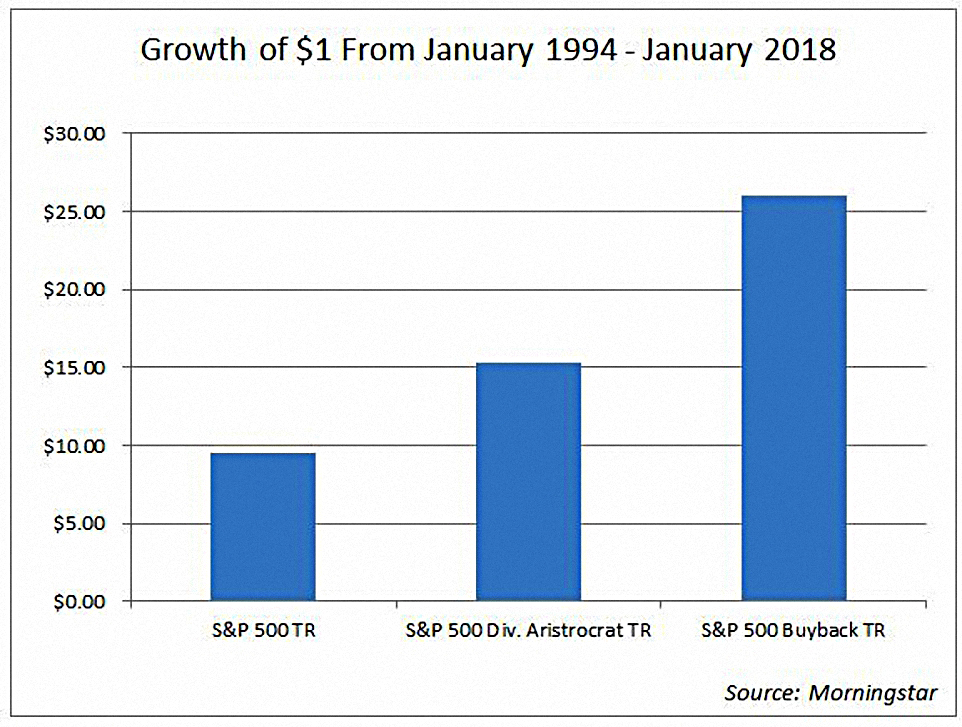
The third chart covers something that is a bit of a pet subject of mine – dividends vs buybacks.
- A lot of UK private investors love dividends, citing the famous compounding up of reinvestments.
I think dividends are a bit of a red herring.
- Companies with high dividends do well because that signal is a proxy for the value factor, but you would be better off using the value tilt directly.
- And dividends that are not funded from current earnings can be a danger signal.
- Dividends can also be tax-inefficient, though that’s not relevant to this chart.
The chart shows that (US) companies which used share buybacks as their preferred method of returning excess capital to shareholders outperformed those who used dividends.
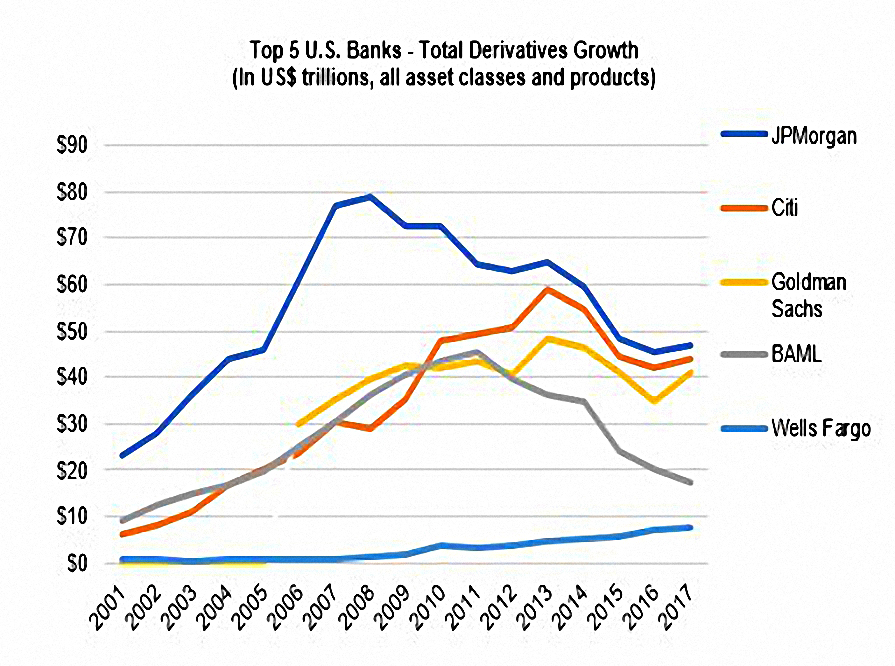
The fourth chart shows that the track record of the big US banks on derivatives has been mixed since the 2008 crisis.
- JP Morgan (the worst offender at the time) and Bank of America have cut back
- Goldmans, Citi and Wells Fargo have not
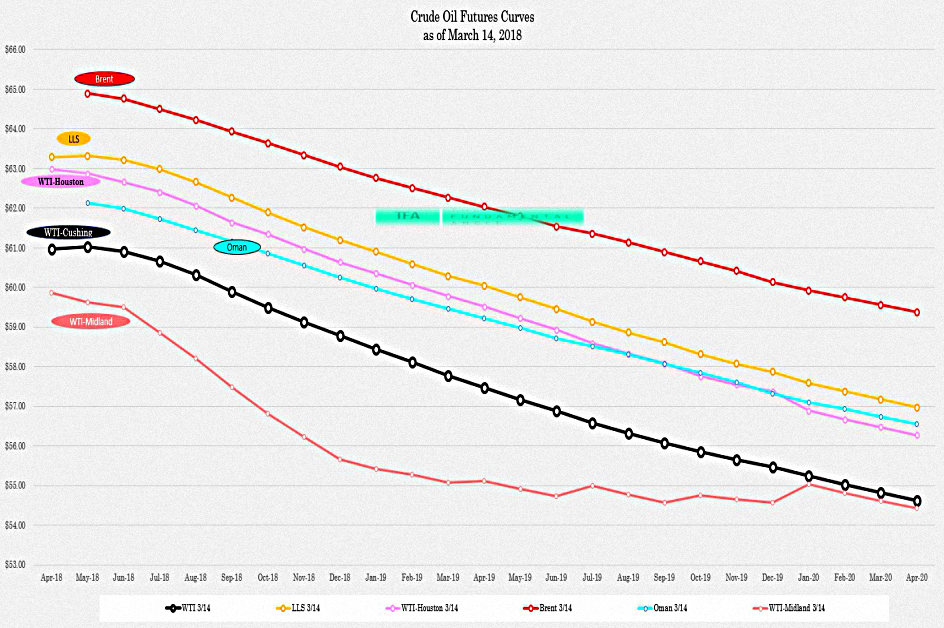
The penultimate chart shows that oil futures have a bleak message for the oil price.
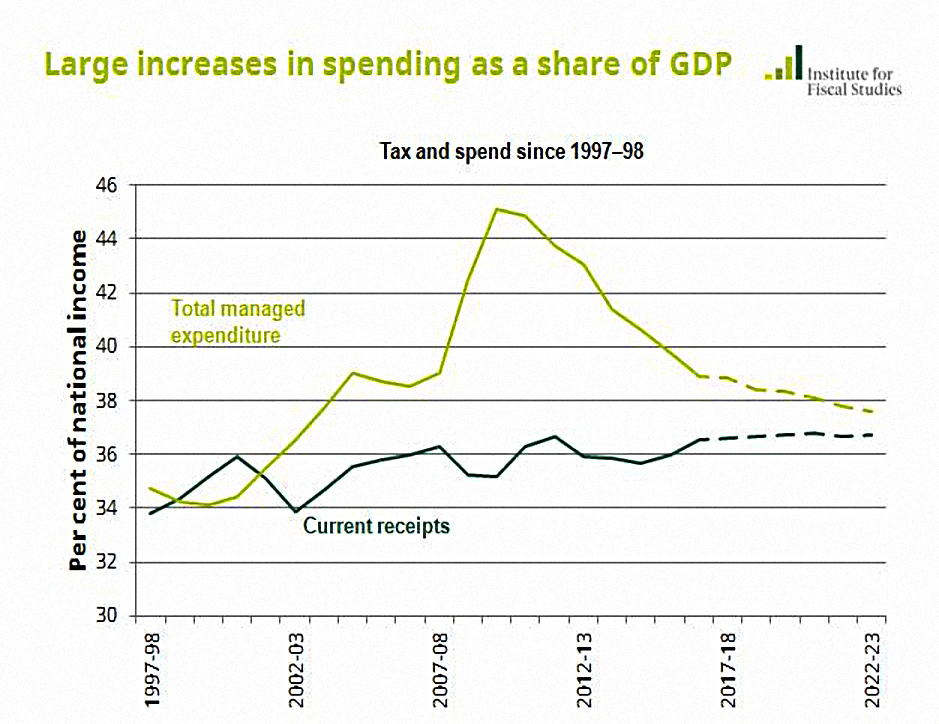
The final chart shows the large increases in UK government expenditure under the Labour administration from 1997 to 2010.
- Balancing the budget via “austerity” has in fact meant dragging expenditure back down towards 37% of GDP.
Government receipts rarely rise above this line, so it should be seen as a ceiling for expenditure.
Until next time.
Mike Rawson
Mike is the owner of 7 Circles, and a private investor living in London. He has been managing his own money for 40 years, with some success.