Weekly Roundup, 16th January 2018

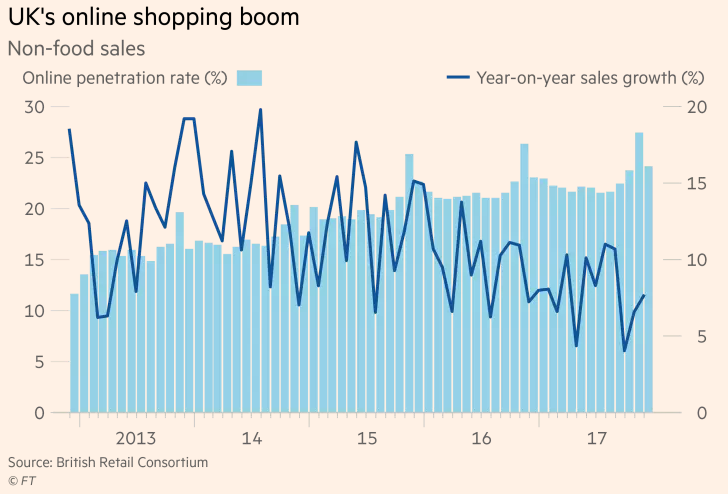
We begin today’s Weekly Roundup in the FT, with the Chart That Tells A Story. This week it was about the online shopping boom in the UK.
Online shopping

Ed Bowsher reported that non-food online sales are up from 11.6% of the market five years ago to 24.1% today.
- But the annual rate of growth is slowing, suggesting that there may be a natural saturation point.
Millenials

The main article in an edition of the Weekend FT that was once again obsessed with young people was from Claer Barrett.
- Claer wrote that millennials think that being savvy with money is boring.
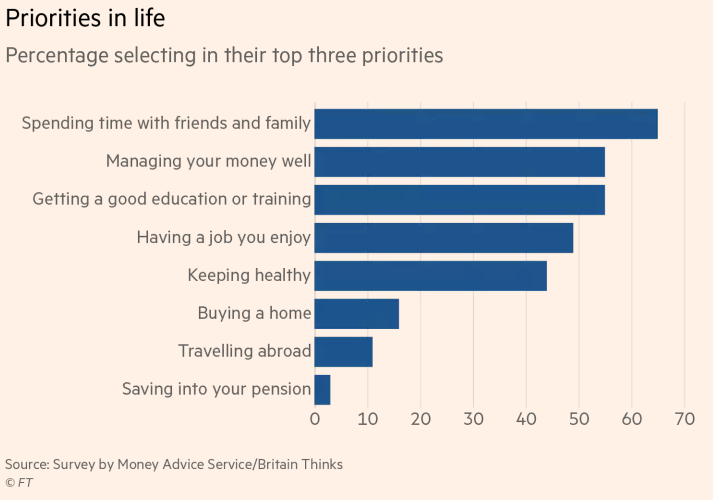
- But we can’t blame Claer for the headline – the article is based on a report from the Money Advice Service, who interviewed 500 people aged from 16 to 25.
If Millenials think that money is boring, wait until they have to eat cat food for dinner when they are sixty.
- In fairness, some of them at least think that money is important, and wish they had been taught more about it at school.
- But it comes second to a good social life, and pension saving is very low on their list of priorities.
Bitcoin

In the “should we laugh or cry” section comes news that bitcoin investors are struggling to put their new digital fortunes to good use.
- Kate Beioley and James Pickford reported that mortgage lenders are refusing to take crypto cash as deposits for fear of running foul of money laundering regulations.

Octopus VCT
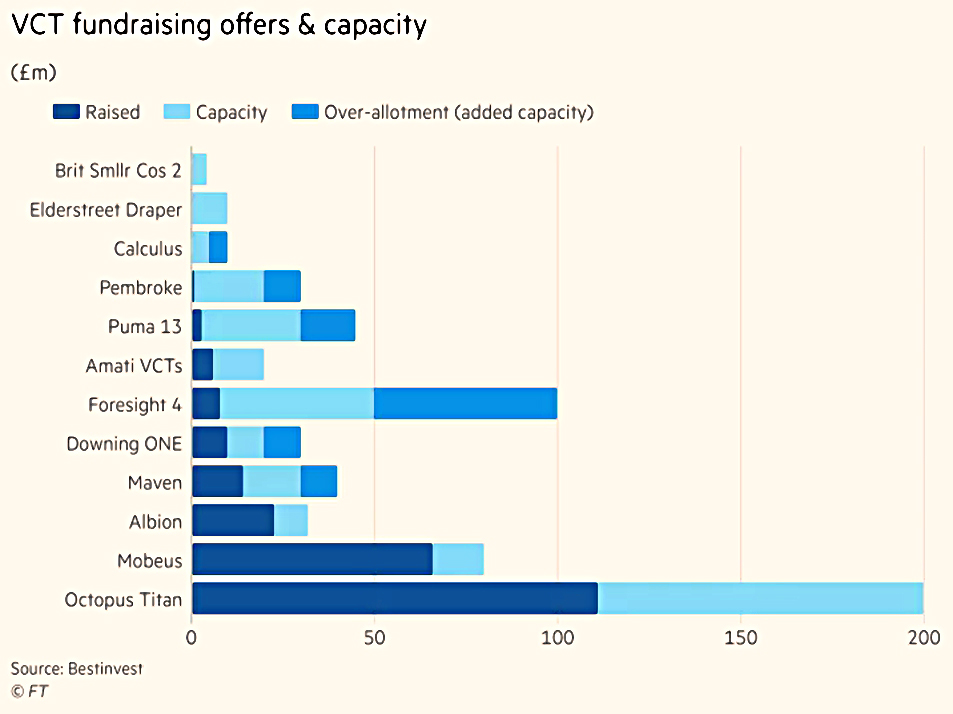
Kate also reported that the Octopus Titan VCT has broken the UK fundraising record by raising £120M in the last four months of 2017. (( DIsclosure – I am a shareholder in LON:OTV2 ))
- There’s still another £80M of capacity left, though.
- If this was filled it would take Titan – the largest VCT – up to £600M in total.
VCTs are having a resurgence as pension limits (lifetime and annual) are cut.
- Unfounded fears of a budget cutback in VCT reliefs (following this year’s Patient Capital Review) are another factor.
- The crackdown on buy-to-let and the introduction of a tiny dividend allowance are also part of it.
This year’s VCT offers total £808M, of which £431M has already been raised.
- The record for fundraising in a single tax year is £779M in 2004-05 (just before the first wave of pensions deregulation).
- £542M was raised last year – the second-highest total.
The other point to note is that offers are filling up earlier than ever.
- March used to be VCT (and ISA) season, but now a lot of people invest in VCTs – especially those with a good track record – before Xmas.
NI rise

Under a rather sensationalist headline (“National insurance ‘will need to rise’ to pay for state pension“), Josephine Cumbo reported on a review of the National Insurance Fund (NIF) by the Government’s Actuary Department (GAD).
- The NIF is largely (90%) used to fund pensions and other benefits (income support and incapacity benefit), but there are other sources of pension funding, too.
The GAD has reported that the current NIF balance is only 20% of its annual expenditure and though this will rise until 2025, the NIF will be exhausted by 2032.
- The fund can currently be topped up by the Treasury with up to 17% of the annual expenditure.
Rather than suggest that this Treasury top-up limit will be increased (which would need primary legislation) the GAD (and gullible journalists) have instead focused on alternative funding from a 5% increase in NICs (split between employers and employees).
- I find this highly unlikely in the context of rising auto enrolment workplace pension contributions (from 2% pa this tax year to 8% in April 2019).

For a more sober assessment of state pension funding, we must turn to last year’s Cridland report.
- This found that with the state pension age (SPA) rising to 68 by 2037, the proportion of GDP required to fund the pension would remain below 7% right out to 2067.
So no need to panic, really.
Rates of return
The Economist reported on a new data set which shows returns on various asset classes across sixteen countries from 1870 to 2015.
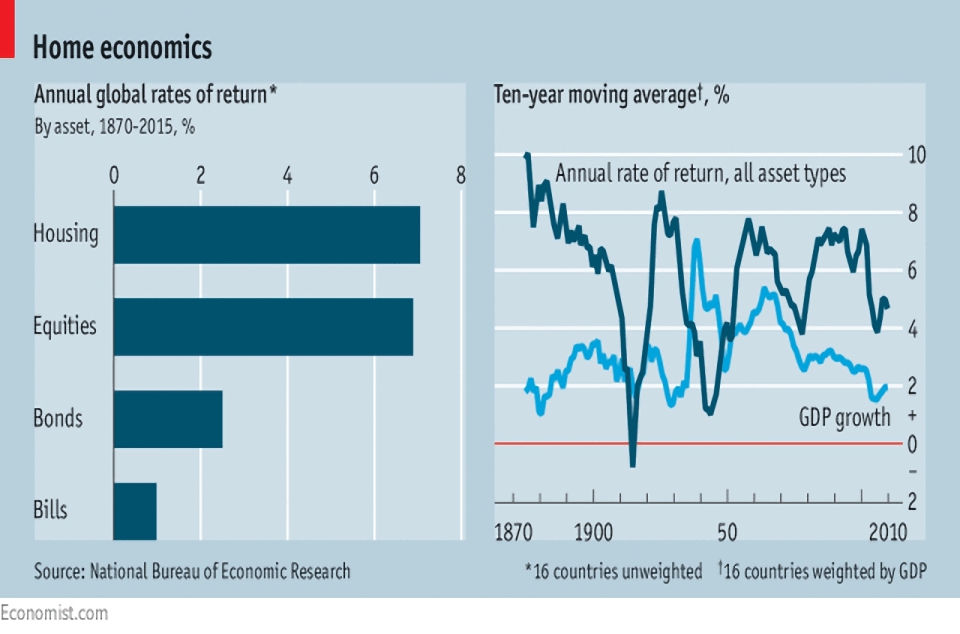
Property appears to do surprisingly well (slightly better than stocks) but there are caveats:
- This is an unweighted average of 16 countries.
- In the countries most relevant to UK private investors (the UK and the US), stocks did better.
Of course, property prices are much less volatile than equites, so in many countries they are a safe choice.
- But more than half of the return comes from rental yields, which don’t apply to a primary residence.
The report also suggests that the 30-year decline in interest rates (and consequent bull market in bonds) represents a return to normal conditions.
- Returns on bonds are generally low, and the last 30 years are an anomaly.
There are no implications for weaker growth, and the projected future low rates mean that government debt burdens may be easier to manage than people think.
There are also implications for inequality:
- Marx predicted that under capitalism, returns to capital would slow.
But this seems not to be true:
- Returns to stocks and property have stayed high while the stock of assets (as a share of GDP) has doubled.
- And also as interest rates and GDP growth rates have fallen.
This is probably because of technology:
- New firms with lots of capital and few employees are replacing old, people-heavy firms.
The implication is that workers’ employment status will become more precarious and their share of GDP will become lower.
- The numbers also back up Piketty’s statement that the return on capital is greater than the GDP growth rate. (( Which seems obvious to me – if not, why put your capital at risk? ))
The uneven distribution of capital means that when r > g, inequality must increase.
- The authors of the report calculate that r averages 6% pa, while g averages 3% pa.
- Only during times of war does r fall below g.
Which, for many, will be a depressing conclusion.
Where are we?
Our last story this week is one that’s becoming a regular feature – where are we in relation to the various market bubbles?

First up is John Authers, who warned us not to bet on higher US Treasury yields just yet.
- He points out that despite being a financial journalist since 1990, he (like most people) has no idea what a bear market in US Treasuries feels like.
- I’m even a few years too young myself.
The 10-year US yield is now 2.56% pa.
- This is almost double the low of 1.36% following the Brexit vote – but it’s also only a ruse of 1.2%.
- Back in 1981 the yield was 16%.
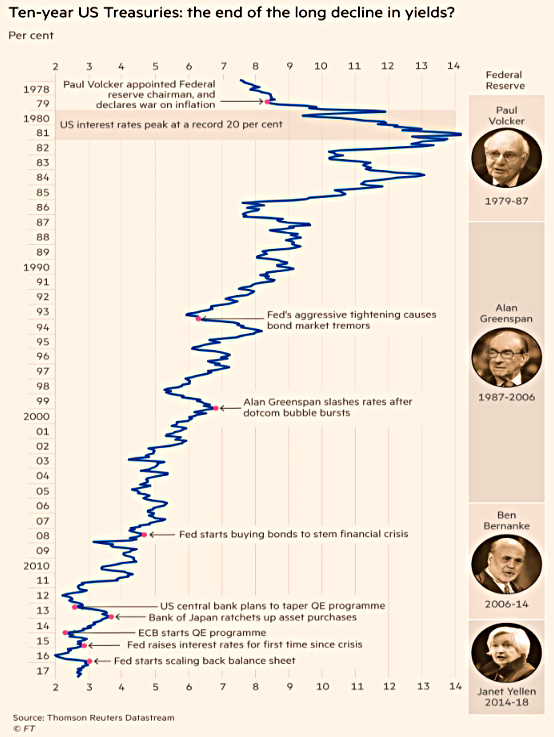
The long fall in bond yields has paralleled a similar fall in inflation, from 14% pa in 1981, to 2% pa today.
- John notes that bond market inflation expectations are 2% pa for the next decade.
The US tax cuts might be expected to increase inflation, but they are going mostly to companies rather than poorer individuals who would spend the cash.
And the headline US unemployment rate of 4.2% excludes a lot of people not actively looking for work.
- Particularly significant are the 18% of non-college educated men between 21 and 30 who are currently playing video games.
- If the economy grows and wages threaten to rise, they may stir themselves.
John is not confident that inflation will rise, and because of this, Treasury yields may stay low.

Robin Wrigglesworth also had an article on potential ending of the bull run in bonds.
- He starts from the argument that central banks are beginning to shrink their market footprint.
- We are moving into the era of “quantitative tightening”.
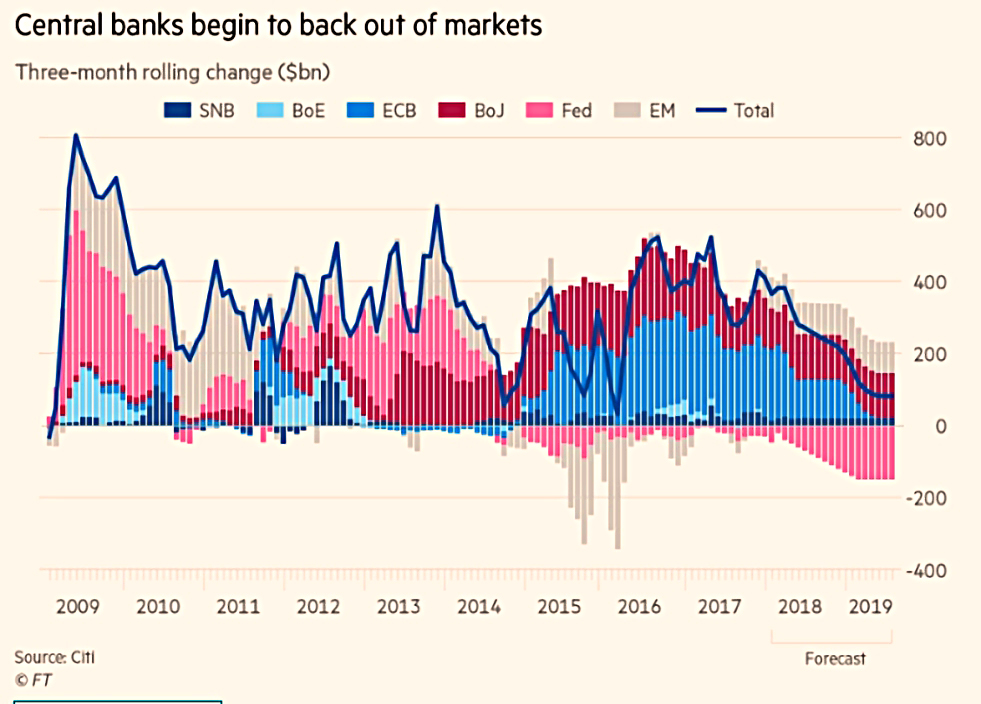
Robin also looked at the implied inflation rate from bonds, but was more bullish than John, noting that inflation-protected bond funds have had 11 straight weeks of inflows.
- He also quotes sources who believe that the Trump tax cuts will have more of an effect than John predicts.
But he admits that technology and ageing demographics provide opposing deflationary forces.

Tim Harford had an article about bubbles in general, triggered by perma-bear Jeremy Grantham’s statement that we have just begun a “melt-up”.
- The piece is mostly about people who got it wrong, but it has some tips on spotting bubbles.
The first is valuation, by comparison with the cash flows generated by the investment.
- As Tim points out, this doesn’t help with Bitcoin (or gold), which produces no cash.
The second is to look for hysteria from investors and interest from those who are not usually investors.
- I’ve been surprised recently that few non-investors are talking to me about crypto, or even US stocks.
Tim agrees than US stocks look expensive, but the hysteria is not here yet.
He also recalls how a friend tipped him off to the dot com bubble by comparing the value of Amazon to that of all the traditional booksellers combined.
- That was a bubble, but buying Amazon was still the right call.
- No-one would now compare its value to bricks and mortar bookstores.
And he closes by pointing out that Charles Mackay, author of Extraordinary Popular Delusions and the Madness of Crowds, was himself caught out by the 1840s railway boom, for which he was a cheerleader.
- This was possibly the biggest mania of all, but Mackay played down its significance (and his own role) in his book.
Bubbles are much easier to spot once they have burst.
Twitter pics
I have six for you this week.
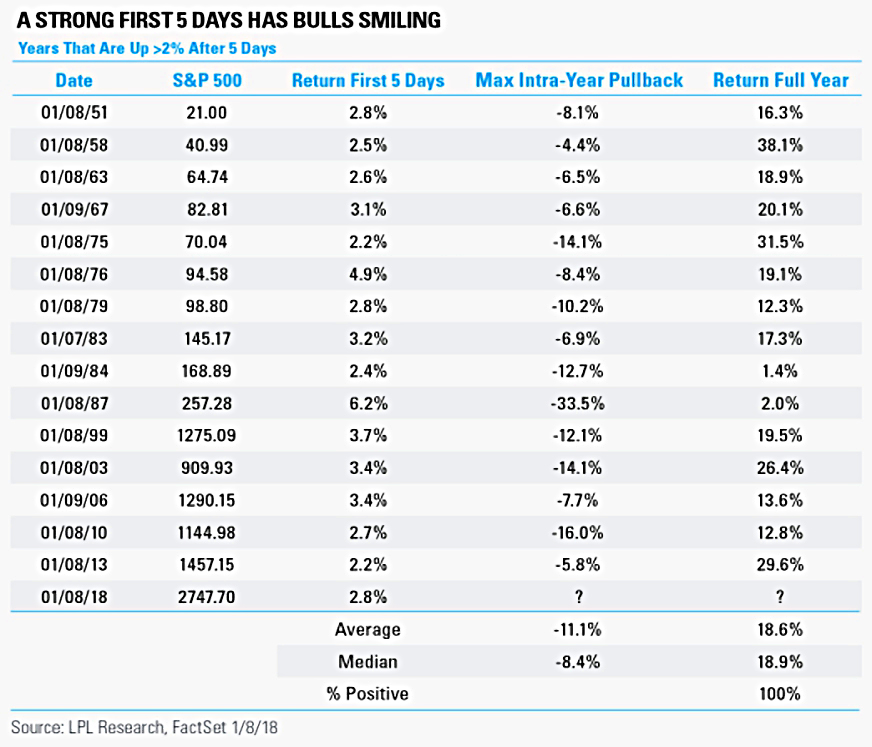
Sticking with bubbles, the first table shows how a good first five days in the US market (which we have had) usually means a good year:
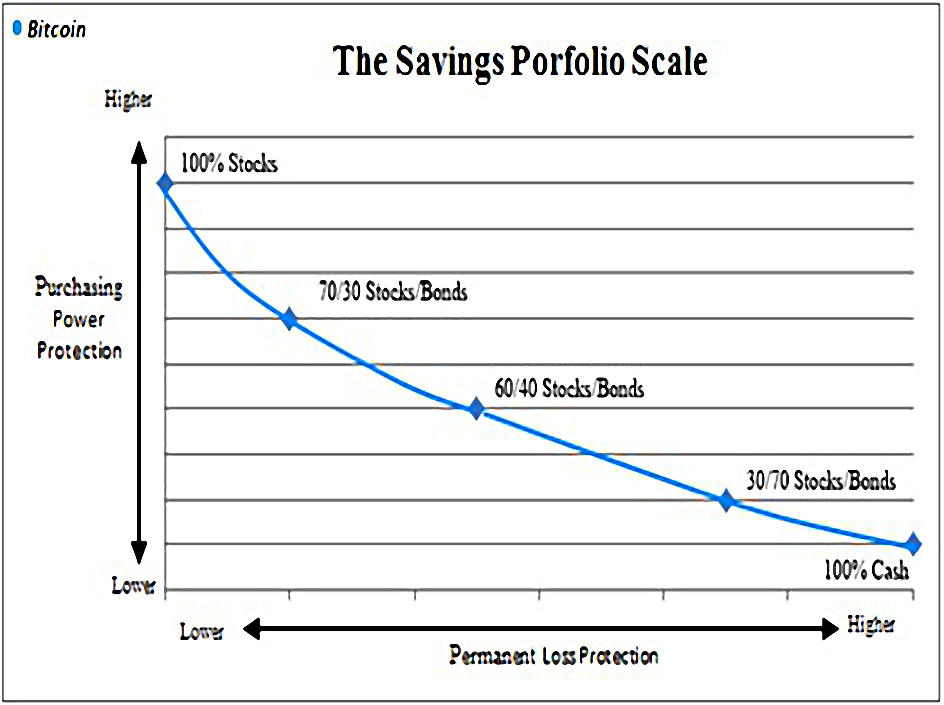
Next up is a (humourous) attempt to plot Bitcoin on a traditional portfolio chart of protection against loss vs purchasing power protection (protection against inflation):
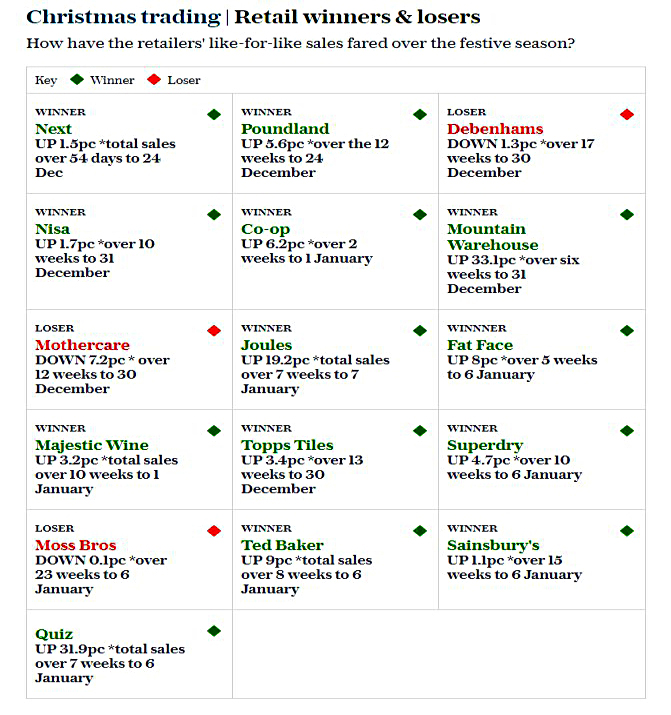
Third is a useful summary of festive trading for the major stores:
Fourth is a chart showing the increasing importance of private pensions income to retirees, compared to both the state pension and other sources:

Fifth up is a chart of property transactions by price band:
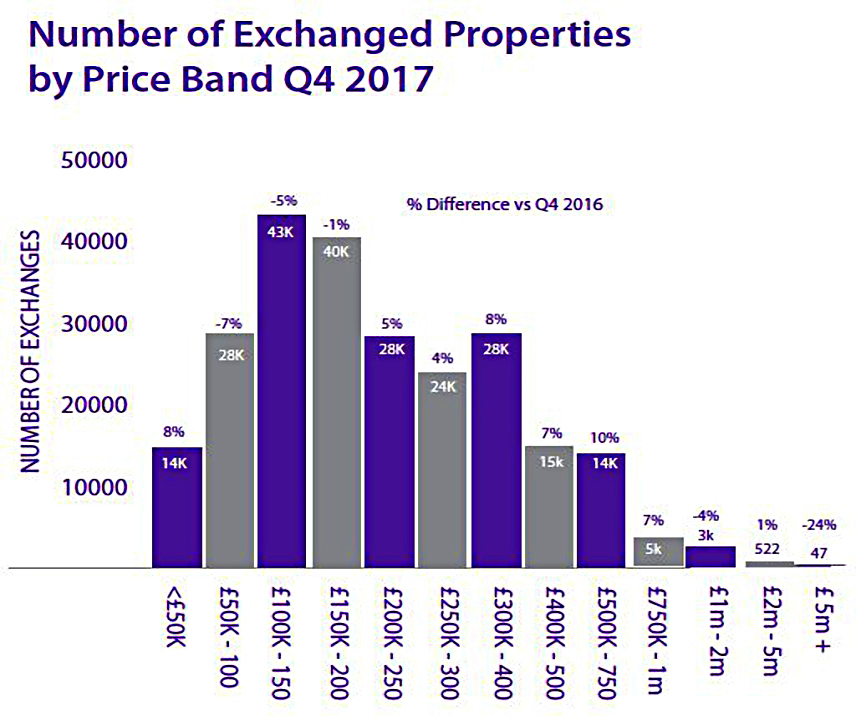
- Most transactions are for less than £200K, showing how detached the market is in London and the South East.
Finally, some evidence that Trump can take credit for a stock market boom:
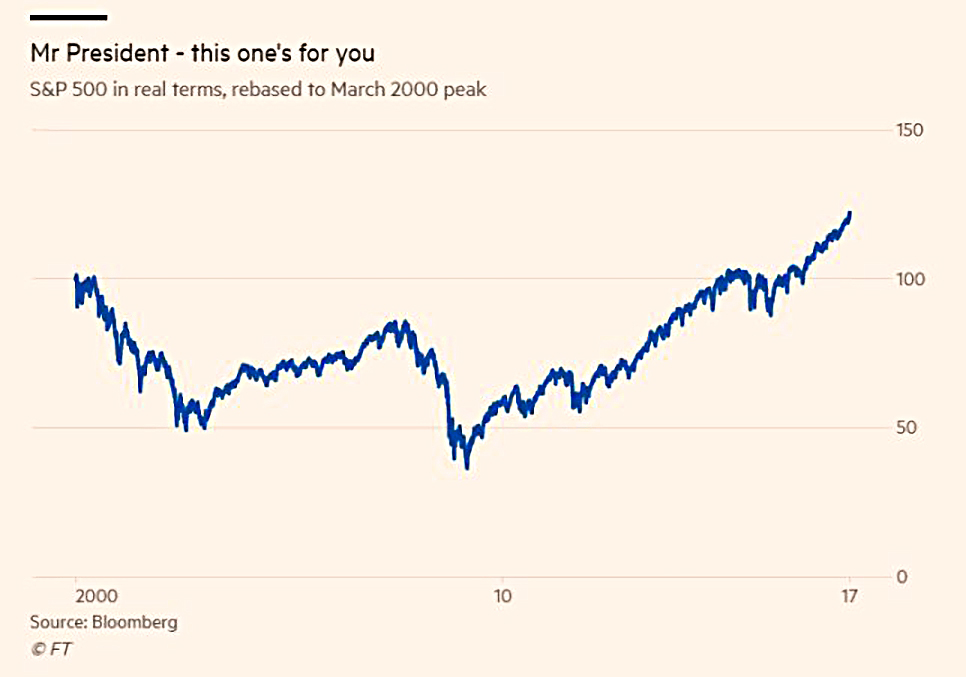
- Rebasing the S&P to the March 200 peak and subtracting inflation, we really are at new highs today.
- The recovery during Obama’s reign can also be seen in the context of the more than 50% crash during Bush’s time in power.
Until next time.
Mike Rawson
Mike is the owner of 7 Circles, and a private investor living in London. He has been managing his own money for 40 years, with some success.