Welfare Generations – Cash Flows by Cohort

Today’s post is about a report called Welfare Generations from the Resolution Foundation. It looks at the future of the Welfare State in the face of changing demographics.
Contents
Background
The welfare state is a relatively recent phenomenon, with most of the key elements (free education, the dole, the state pension, the NHS) being developed during the twentieth century.
- But most Britons see it as part of the core fabric of society, and politicians exploit this attachment with regular pledges to preserve and enhance it.
In the light of changing life and work patterns, is this even possible?
The basic relationship of an individual with the state is:
- You cost the state for education when young.
- You pay back in taxes when working, or
- You cost the state again in working-age benefits.
- You cost the state once more for pensions and health care when old.
There are two distinct life paths here, though most statistics will net off the working age options to show a single trajectory by age.
As lives get longer, and the pension / healthcare costs at the end of life begin to escalate, how can we make the system balance?
From this top-down view, the answer seems obvious (work longer, start taking the pension at a later age).
- But from my experience to date with reports from the Resolution Foundation, I suspect they will find a more complicated solution.
Pay as you go
One wrinkle in the analysis is that the welfare state (and the state in general) is funded on a Pay As You Go (PAYG) basis.
- Each generation / individual doesn’t build up a personal account of money that has been paid in, and can be paid out again later.
Instead, each working generation funds the net costs of the generation before (pensions / NHS) and the generation after (education).
- Thus demographic changes – in particular, the ratio between citizens of working age and those that are older or younger – put a strain on the system.
This increasing “dependency ratio” has underpinned the political will in recent decades to increase immigration of working age adults.
- This process has now reached the point where there is a backlash (eg. Brexit) from existing inhabitants.
Which means in turn that alternative solutions must be found.
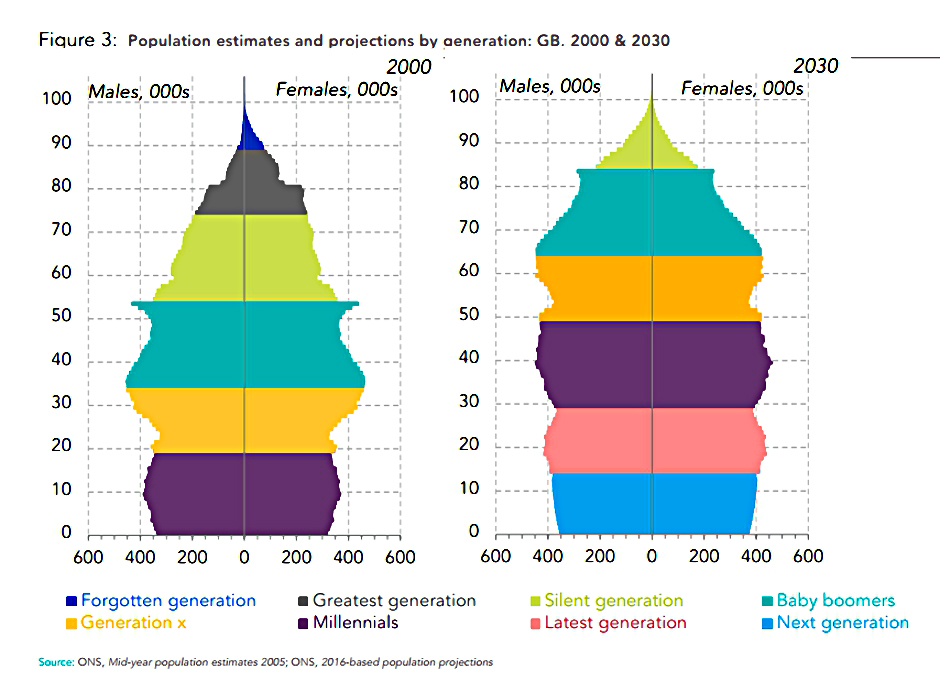
PAYG also means that some generations are winners and other are losers:
- The generations who were already old when the welfare state was developed (generally known as the forgotten generation and the greatest generation) did well, as they received benefits that they hadn’t had to fund.
- The silent generation founded the Welfare State and paid for it, but were too old to benefit from the expansion of free education, so they were much smaller beneficiaries.
- The baby boomers have done better and, on current projections, will turn a profit.
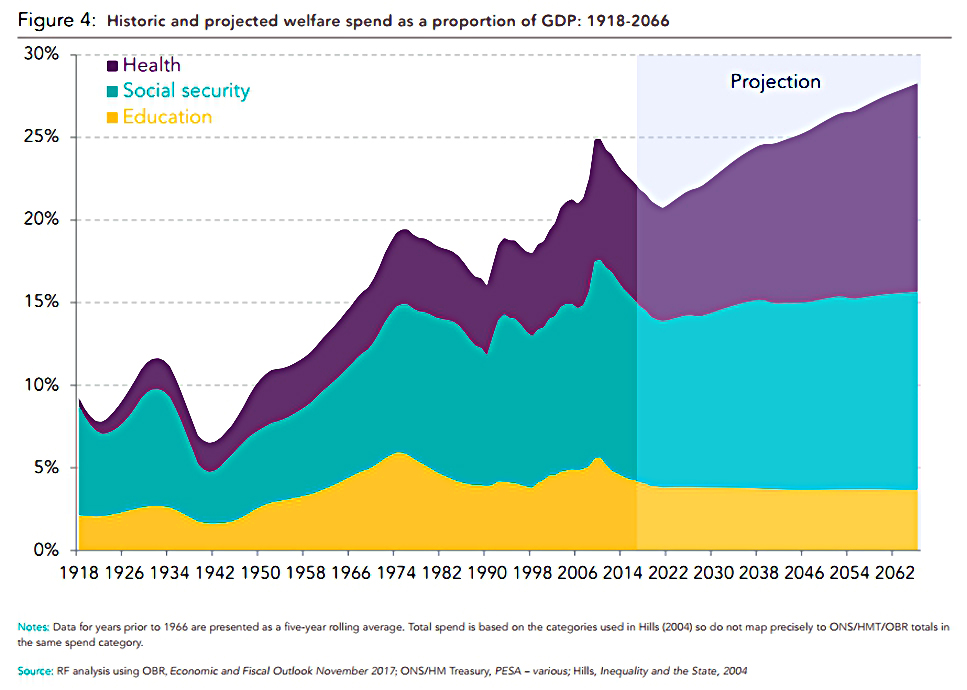
More importantly, under the existing system, each generation (from Gen X onwards) can be expected to pass on the system in a worse state than they found it in.
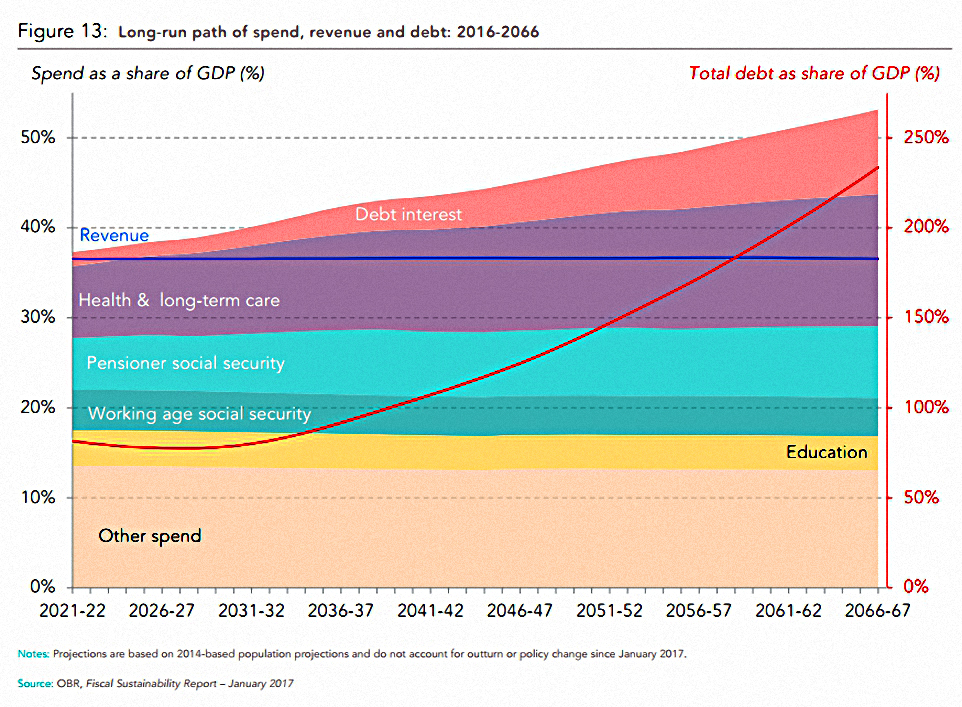
- That would mean welfare rising as a share of GDP, and probably an increase in the national debt.
So it’s more than likely that something will have to change.
Assumptions
For generations from the baby boomers (who have mostly not yet retired) onwards, assumptions are required about future taxation and spending.
- The central position taken by the Resolution Foundation is that taxes will be set to match welfare spending each year.
- As health spend on longer-lived generations increases, welfare spending will therefore take up a greater share of GDP.
I find this an odd starting point, since it implies that net withdrawals for subsequent generations will be higher than for the silent generation.
- I think this is a straw man position designed to create the need for an extra source of funding to balance the books.
Solutions
The source of extra funding could be higher working age taxation, or it could be the passing down of ever higher levels of government debt to future generations.
- Neither approach is sustainable in the long run.
The other obvious option is to cap welfare funding per head at current levels.
- This means that boomers would be the last generation to receive large net withdrawals from the system.
Ceteris paribus there is an advantage in a PAYG system to being born into a large cohort.
- The generations before and after (which you fund) are smaller.
The Resolution Foundation (RF) finds this generation inequality politically unacceptable.
- This in turn sets the stage for a deus ex machina at the end of the report – wealth taxes on the boomers.
Obstacles and opportunities
There are four other points to note:
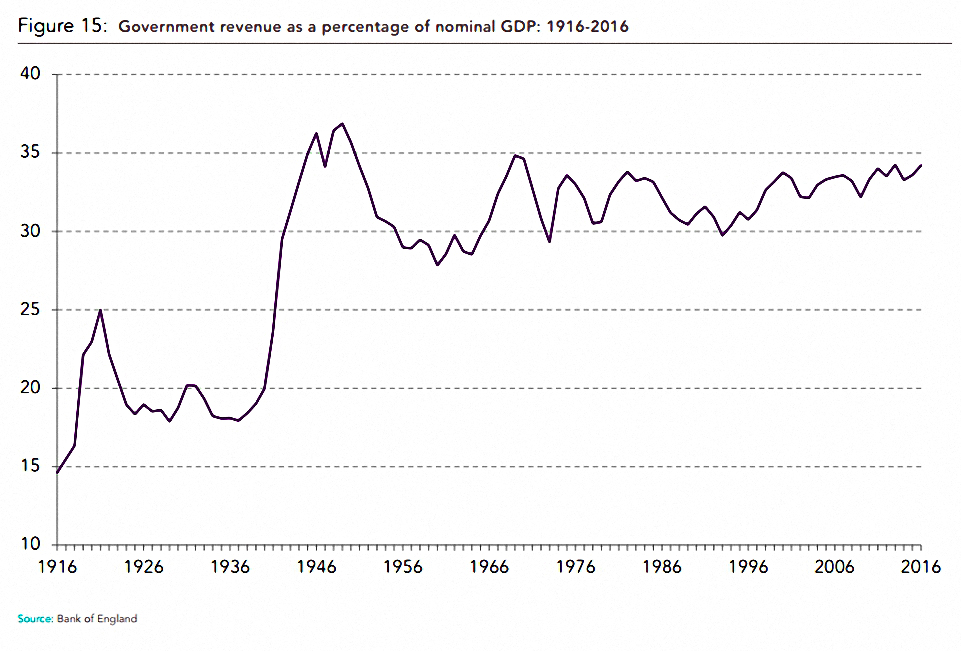
- History shows that we are close to the maximum level of government revenue (as a share of GDP) that can be successfully raised.
- This implies that higher income and / or wealth taxes cannot play the major role.
- The NHS is massively inefficient in bureaucratic terms, and healthcare is an area where major productivity gains from software automation and robotics can be expected.
- Of course, new tech is expensive to start with, and the best (most expensive) treatments may not be available to all at first introduction.
- But perhaps average health costs can be capped without a massive reduction in service levels.
- There is also plenty of scope to introduce charges into the system, to reduce both demand and net spend.
- The same applies (perhaps to a lesser extent) to education costs.
- The UK state pension is the lowest in the OECD, and its costs are easy to control through gradual increases in the state pension age (SPA).
All of the above suggest that welfare freezes are more achievable than might be thought at first glance.
In practice, some combination of the four funding gap options is likely:
- Under a right wing government, a bias to welfare freezes and income tax increases is likely.
- Under a left wing government, a bias to wealth taxes and passing down of more debt is probable.
More politics
The RF kicks off its report by showing that the current government’s tax and benefit changes help the old at the expense of the young.
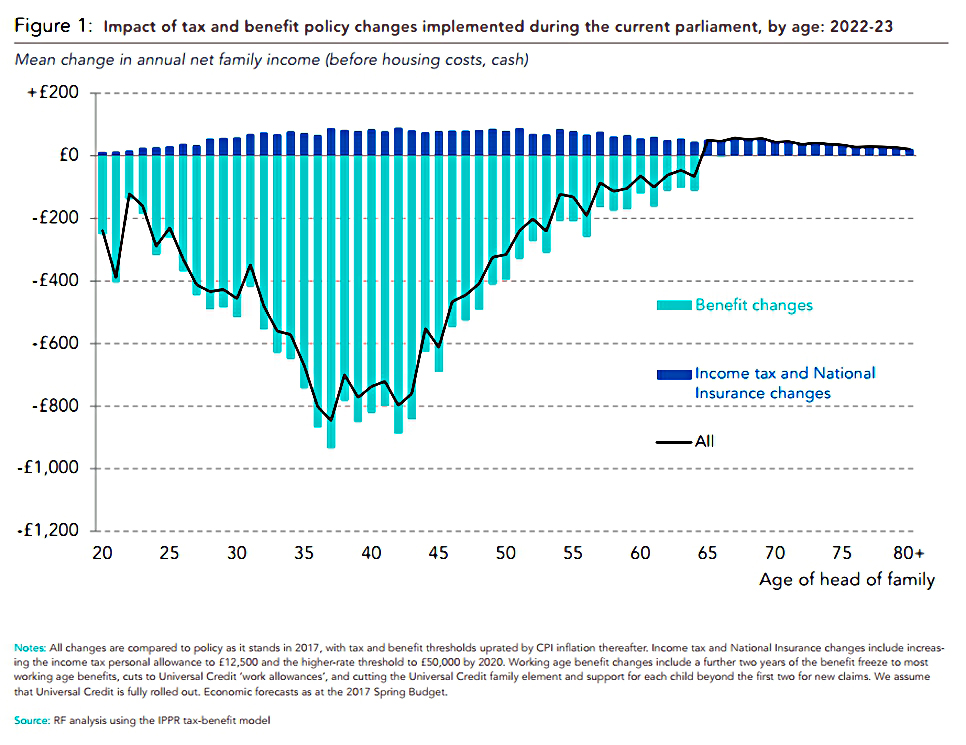
But of course, these are changes, not outcomes. If, like me, you understand that:
- the UK state pension remains the lowest in the OECD
- we have a generous working age benefits system, and
- our educational and healthcare systems are inefficient and expensive
Then there is no cause for concern in the direction of these changes.

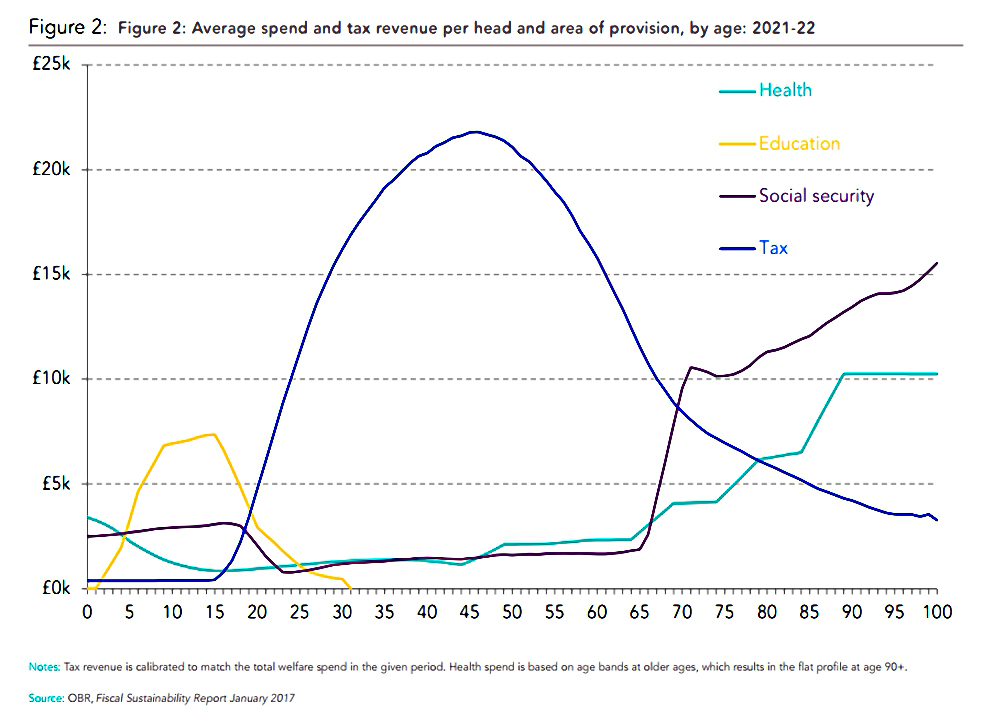
Cohort spending and tax
The report has some nice charts of spending and taxation by cohort.
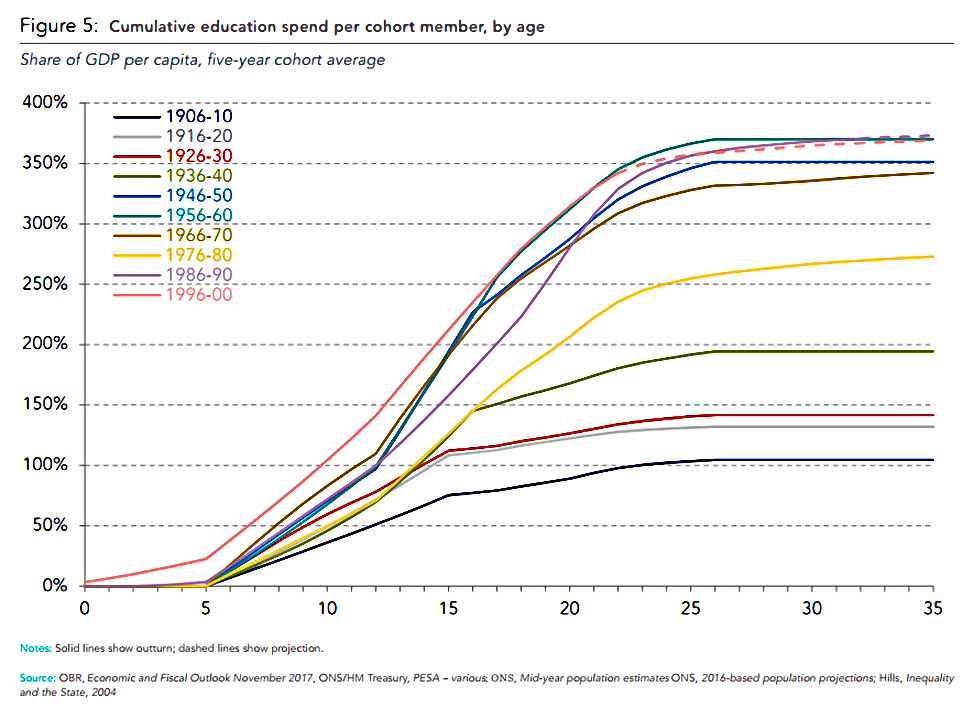
The general trend in education spend is upwards.
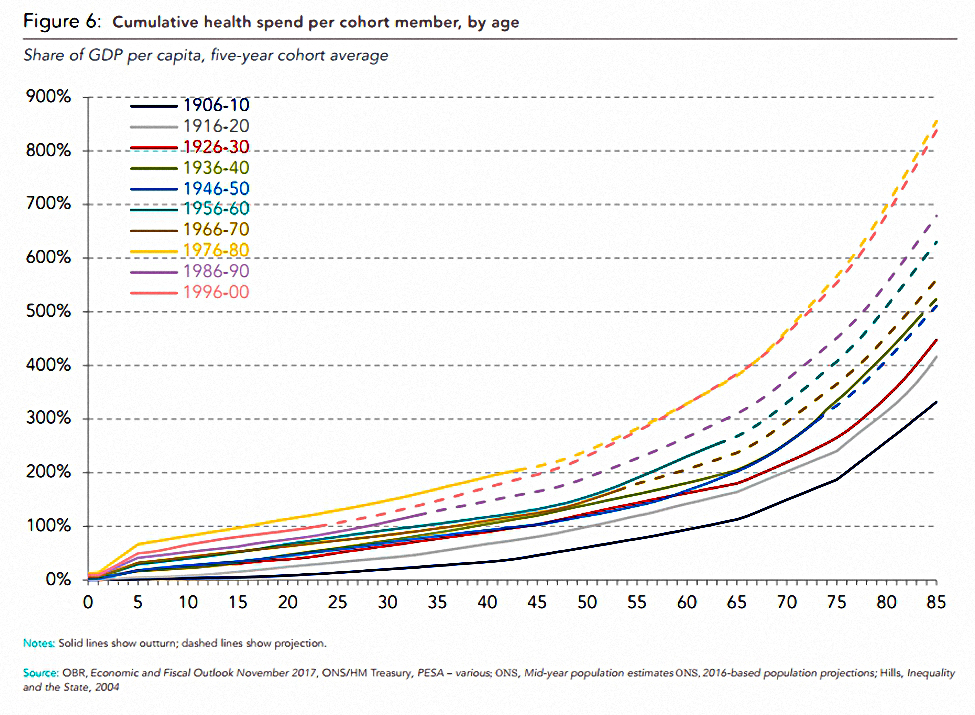
The same is true of health spend (though obviously it is spent at different ages).
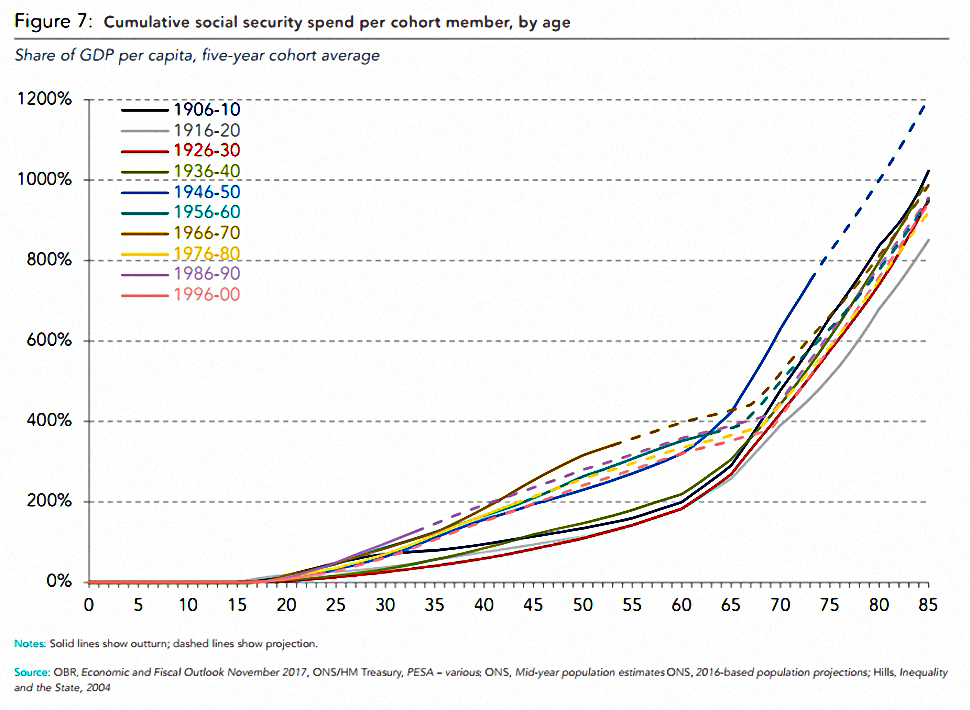
The same trend can be seen in social security spending, though the recent increases in the SPA have meant both a reduction and a deferral in the youngest cohorts.
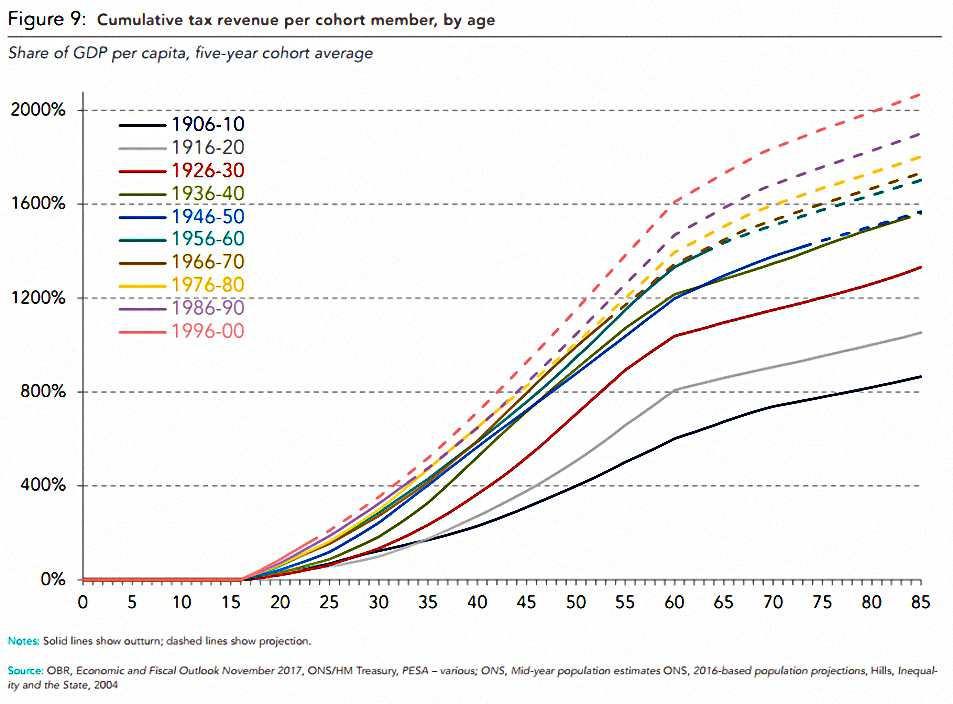
Taxation by cohort shows perhaps the neatest upward trend, which will be of no consolation to the youngest cohorts.
- Note, though, that the higher tax paid by younger generations reflects the RF’s central assumption that more welfare spending will be needed, and will be funded from working age taxes.
Net withdrawals
The RF’s examination of the net effect of all these factors begins with a detailed look at the 1976-80 cohort.
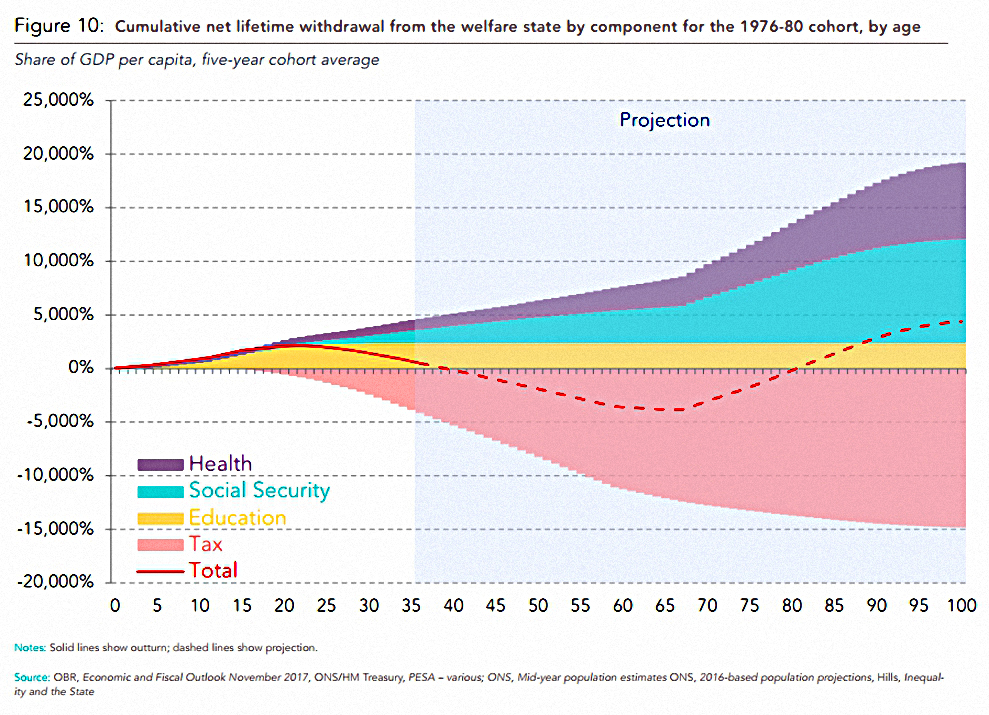
This follows the pattern described above.
- Members of this cohort who live beyond the age of 80 will go into surplus (net withdrawals).
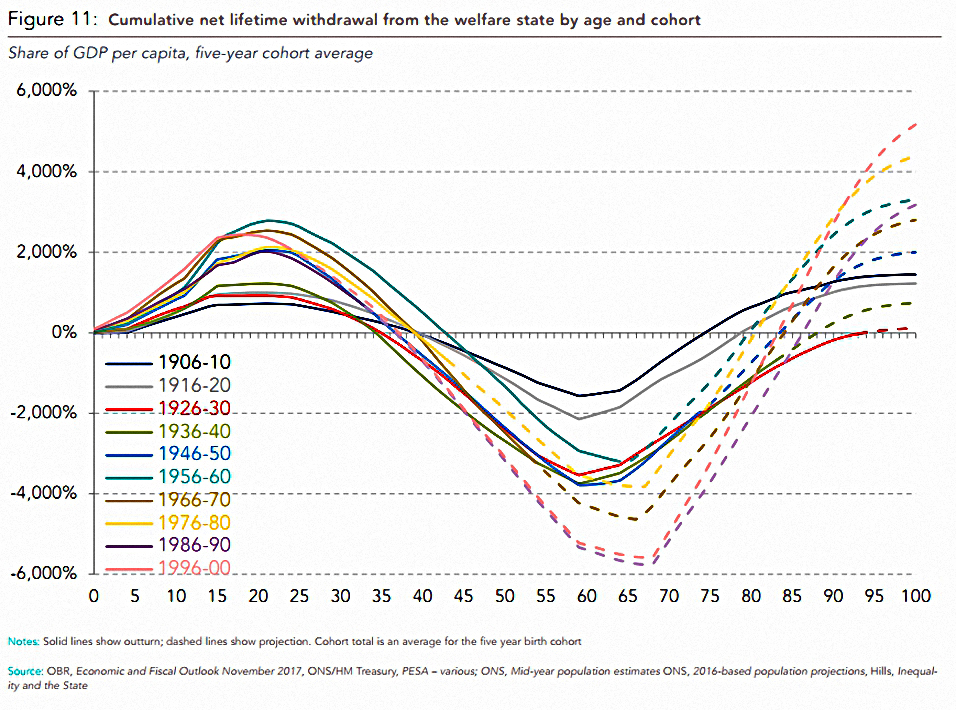
The next chart shows the same data for all cohorts.
- The break-even age varies from early 70s to early 90s.
- The potential level of surplus for the longest-lived also varies substantially.

This chart shows the same data for the average member of each cohort.
- Note that because of the RF’s central assumptions, younger generations (Gen-X and millennials) do even better than boomers.
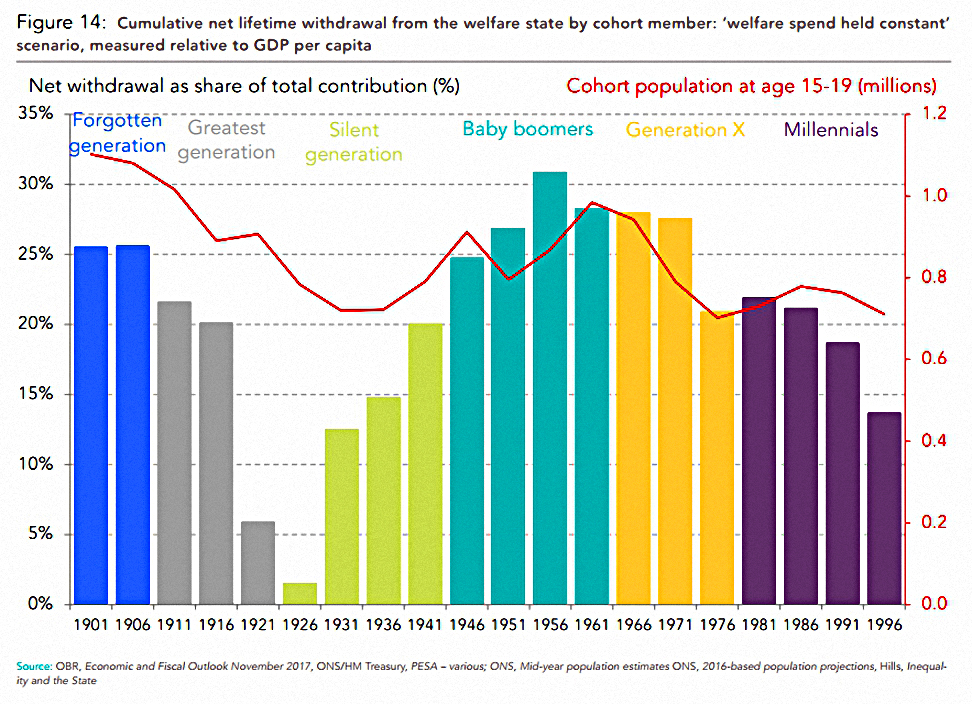
Here’s the same chart with welfare spend per head held constant.
- Now future generations do worse than the boomers.
- Though even the millenials do as well as the greatest generation and the silent generation.
Conclusions
- The current system for funding the welfare state is reaching breaking point, and changes are needed.
- There are four obvious options to plug the gap:
- a cap on per capita welfare spending
- higher working age taxation
- higher government debt passed down to future generations
- additional wealth taxes
- There are other less immediately obvious considerations:
- it’s quite possible that higher taxes (as a share of GDP) cannot be collected
- healthcare and education savings through technology advances are likely
- charges could be introduced to the NHS, to reduce both demand and net spend
- the UK’s comparatively low state pension costs can be capped relatively easily by increasing the state pension age
- There is no silver bullet to fix this problem, and a combination of approaches will be needed.
- This combination should be chosen to minimise the variance of individual outcomes from the welfare state (net surplus / net deficit).
- Cohort analysis necessarily obscures differences within age groups.
- Rather than some cohorts being winners from the system and others losers, there are winners and losers in each age group.
- Most people probably don’t know which group they fall into.
- Wealth taxes penalise good behaviour and reward bad.
- They would further penalise existing net losers within a cohort (specifically the boomer cohort) whilst letting the net winners in that group off the hook.
- Rather than lumping several million people into a single cohort – as if each of their experiences is equivalent – we should move towards a system of individual accounting for our relationship with the state.
- This is now easily possible through advances in technology.
- This data would support policy decisions to flatten out relationships with welfare state funding and benefits.
Until next time.
Mike Rawson
Mike is the owner of 7 Circles, and a private investor living in London. He has been managing his own money for 40 years, with some success.