Bessembinder 2 – Global Stocks

Today’s post is a return to the work of Hendrik Bessembinder on stock returns.
Bessembinder

A couple of years ago we looked at a paper from Professor Hendrik Bessembinder, of the WP Carey School of Business at Arizona State University.
- He examined stock returns in the US from 1926 to 2015.
He’s since written a couple more papers, and other industry practitioners have attempted to explain some of the anomalies which his work throws up.
- So it’s time for a catch-up, but first, we’ll recap what we learned two years ago.
Stocks have the best (long-term) returns of any asset class, and that this has been the case for more than 100 years.
- But lots of stocks fail in the end, and some have returns worse than bonds, or even negative returns.
Only a tiny minority of companies fight off their competition and grow large.
Bessembinder found that only 42% of listed stocks provided a better return than cash.
- The average stock was listed for just seven years, and the most common lifetime return was a loss of 100%.
The finding that the industry picked up on was that just 4% of listed stocks were responsible for all of the positive gains of stocks during the period.
Active managers

Active fund managers like James Anderson, manager of the wildly successful Scottish Mortgage Trust, publicly referenced Bessembinder.
- Anderson is understandably keen to attribute the success of the trust to his stock-picking abilities rather than the stellar run of US tech stocks that he is over-exposed to.
He says that gains will accrue to fewer and fewer dominant firms in the future.
- Two years on, and six months into a pandemic which has further enhanced the value of tech stocks, his thesis is looking pretty good.
Anderson says that winners are:
- Early entrants to markets that later became huge.
- Founder-run.
- Willing to accept/embrace uncertainty.
Growth
I agree about the dominance of the major platforms and don’t see more regulation as the answer (since incumbents have deeper pockets with which to fund compliance).
- But overpaying for growth has never worked in the past.
We’ll come back to this growth/value paradox in the next article in this series.
Responses
There are three ways in which to react to Bessembinder’s finding:
- The Anderson route – work out which characteristics will lead to future success, and buy a lot of that kind of thing.
- This is risky but could produce exceptional results (especially over the short-term).
- But it’s hard to identify the winners, and the underlying characteristics are likely to change over time.
- Make sure that you are well-diversified
- If it’s hard to pick the winners, you need to hold everything, to make sure that you include them.
- This way lies the Vanguard passive approach, and it’s proven to work.
- Identify the characteristics of stocks that underperform, and avoid them.
- If 4% of the market has all the returns, then the bottom 96% is flat (compared to Treasury bills).
- But leave out the bottom 58% (the ones that Bessembinder found did worse than cash), and you’re going to do pretty well.
- You could start by simply excluding the smallest 20% (or more) of stocks.
For most private investors, a combination of the second and third approaches – plus an allocation to active managers like Anderson (( I hold SMT, even if it doesn’t sound like it )) – is probably the most practical approach.
Global stocks
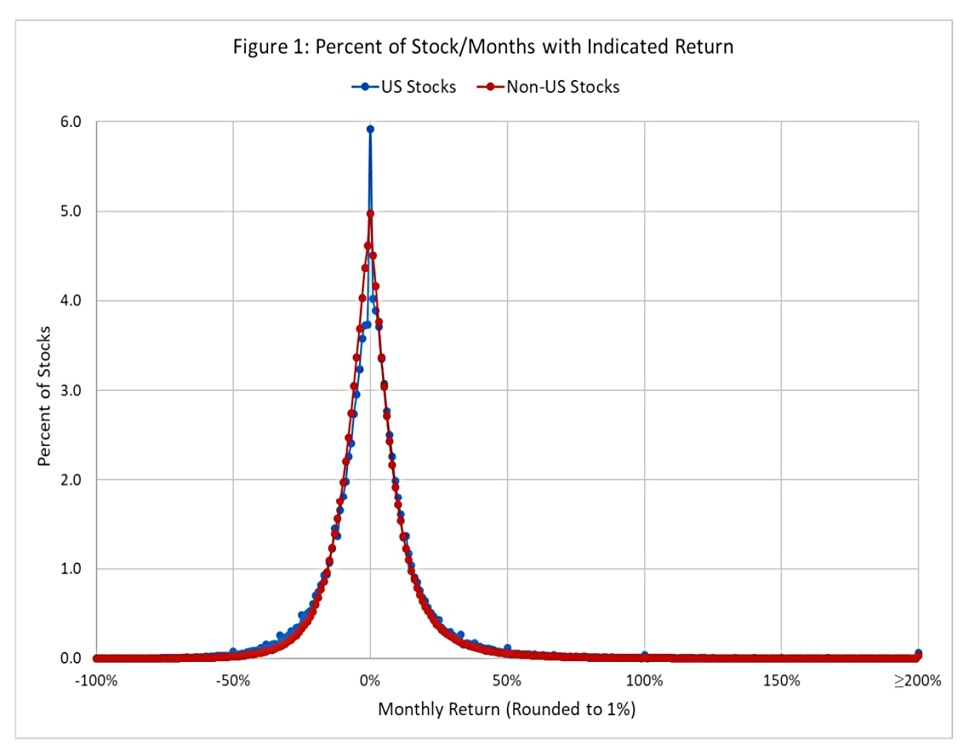
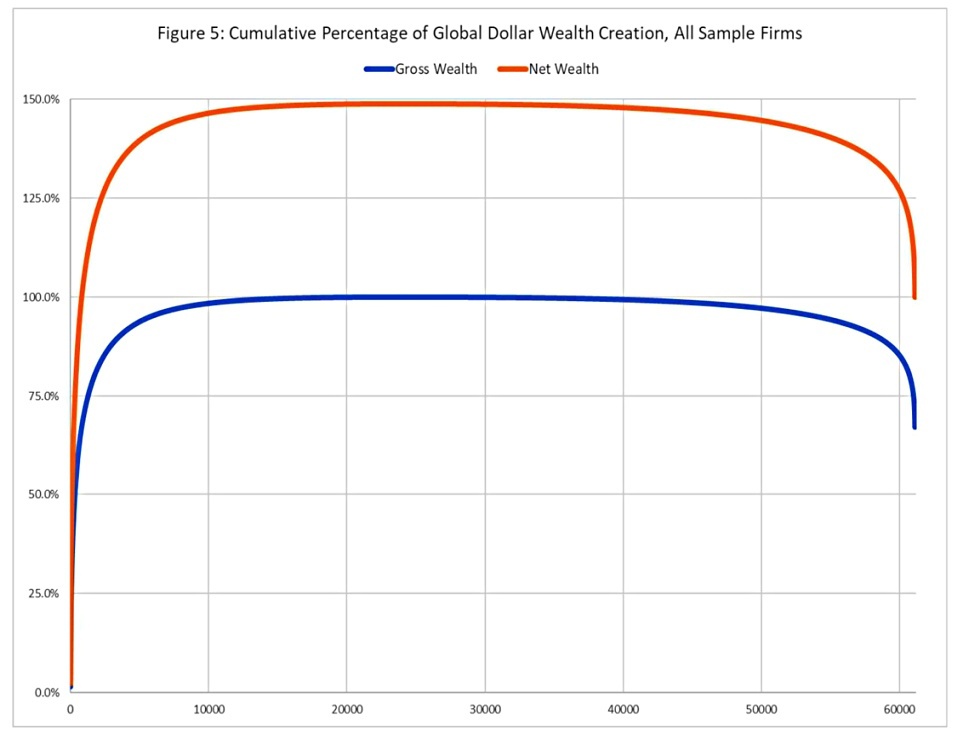
Hendrik’s second paper extended his analysis from US stocks to global stocks.
- He looked at 62,000 stocks, from 1990 to 2018.
Once again, he found that:
The distribution of long-run stock returns is strongly positively skewed.
Once again, 60% of stocks (56% in the US and 61% elsewhere) underperformed one-month Treasuries (“cash”).
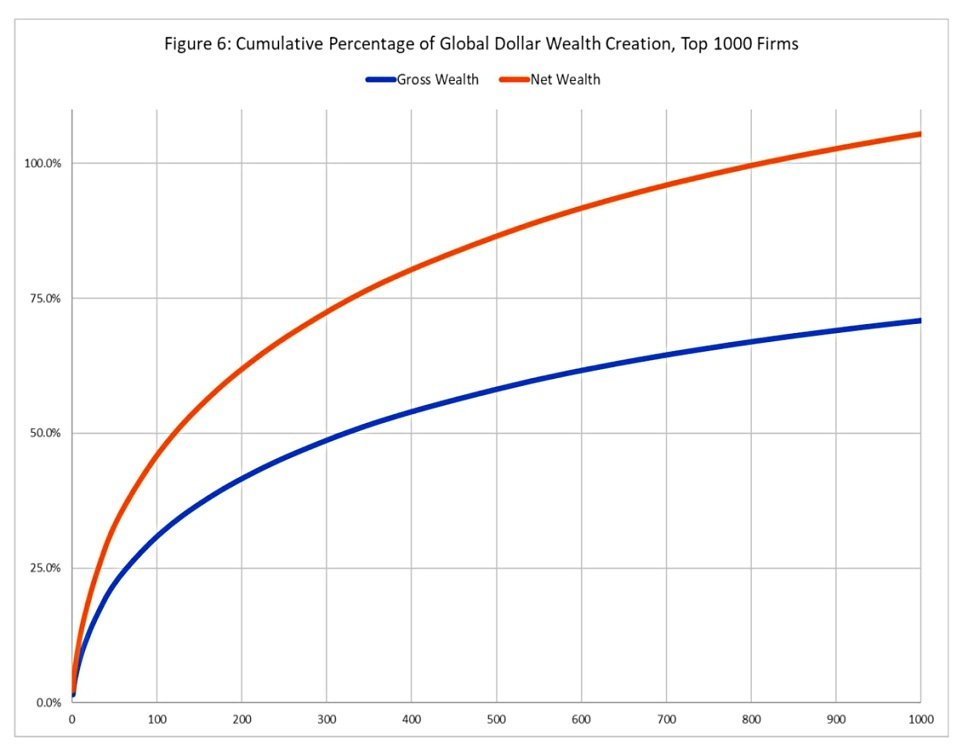
- And this time, just 1.3% of firms accounted for all of the gains.
Outside of the US, it was even worse, with less than 1% of stocks capturing the growth.
Dollar weighted returns (IRR) were even worse:
We find that the dollar-weighted return exceeds the Treasury-bill return over the matched time horizon for an even lower proportion of stocks, 39.1% globally and 37.5% for non-US stocks.
Since the period Hendrik looked at includes two complete cycles of boom and bust, there’s a fair chance that the results are representative.
Commenting at the time the report was published (August 2019), Barry Ritholz came to a similar conclusion as I had done the year before:
If screens could eliminate some of the long-term losers, it might not only improve returns, but could help to justify fees higher than simple indexing.
Finding active managers who can do this reliably is difficult, of course.
Hendrik himself makes the opposite call:
For those investors without a comparative advantage in identifying the few stocks that will create the most wealth (or in selecting a manager with the ability to do so) and without a substantial preference for positive skewness, the results reinforce the desirability of passive indexing.
But if you can pick the right stocks, you should do very well indeed.
That’s it for today – the results for global stocks are very similar to those for US stocks.
- In the next article we’ll try to resolve the paradox that historically, value stocks have outperformed the growth stocks which Hendrik says capture all the returns.
Until next time.
Mike Rawson
Mike is the owner of 7 Circles, and a private investor living in London. He has been managing his own money for 40 years, with some success.