Bessembinder 3 – Value and Growth

Today’s post is the third in our series on the work of Hendrik Bessembinder on stock returns.
Bessembinder

A couple of years ago we looked at a paper from Professor Hendrik Bessembinder, of the WP Carey School of Business at Arizona State University.
- He examined stock returns in the US from 1926 to 2015.
Stocks have the best (long-term) returns of any asset class, and that this has been the case for more than 100 years.
- But lots of stocks fail in the end, and some have returns worse than bonds, or even negative returns.
Only a tiny minority of companies fight off their competition and grow large.
Bessembinder found that only 42% of listed stocks provided a better return than cash.
- The average stock was listed for just seven years, and the most common lifetime return was a loss of 100%.
The finding that the industry picked up on was that just 4% of listed stocks were responsible for all of the positive gains of stocks during the period.
A follow-up paper (which we looked at in the second article in this series) replicated these results for global stocks.
Active managers

Active fund managers like James Anderson, manager of the wildly successful Scottish Mortgage Trust, publicly referenced Bessembinder.
- Anderson is understandably keen to attribute the success of the trust to his stock-picking abilities rather than the stellar run of US tech stocks that he is over-exposed to.
He says that gains will accrue to fewer and fewer dominant firms in the future.
- Two years on, and six months into a pandemic which has further enhanced the value of tech stocks, his thesis is looking pretty good.
Anderson says that winners are:
- Early entrants to markets that later became huge.
- Founder-run.
- Willing to accept/embrace uncertainty.
I agree about the dominance of the major platforms and don’t see more regulation as the answer (since incumbents have deeper pockets with which to fund compliance).
- But overpaying for growth has never worked in the past.
Responses
There are three ways in which to react to Bessembinder’s finding:
- The Anderson route – work out which characteristics will lead to future success, and buy a lot of that kind of thing.
- This is risky but could produce exceptional results (especially over the short-term).
- But it’s hard to identify the winners, and the underlying characteristics are likely to change over time.
- Make sure that you are well-diversified
- If it’s hard to pick the winners, you need to hold everything, to make sure that you include them.
- This way lies the Vanguard passive approach, and it’s proven to work.
- Identify the characteristics of stocks that underperform, and avoid them.
- If 4% of the market has all the returns, then the bottom 96% is flat (compared to Treasury bills).
- But leave out the bottom 58% (the ones that Bessembinder found did worse than cash), and you’re going to do pretty well.
- You could start by simply excluding the smallest 20% (or more) of stocks.
For most private investors, a combination of the second and third approaches – plus an allocation to active managers like Anderson (( I hold SMT, even if it doesn’t sound like it )) – is probably the most practical approach.
Value and Growth

When Hendrik’s paper was first published, Jack Vogel over at Alpha Architect set out to reconcile his findings with the idea that long-term (( Admittedly, not over the past decade )) value stocks tend to outperform the growth stocks which Hendrik’s work suggests capture all the gains.
Jack starts by pointing out that Bessembinder doesn’t actually come out in favour of market-cap indexing:
The Bessembinder’s paper key takeaway is that investors should definitely buy diversified portfolios, but doesn’t say much about which individual stock characteristics should be placed in these diversified portfolios.
As well as value stocks, small-cap portfolios have outperformed historically:
Although the Bessembinder results on individual small-cap stocks are scary, when held as a portfolio, investing in small stocks and equal-weighting the portfolio has generated enhanced returns.

This point was also made by Lawrence Hamtil at the time, using Ken French’s data library:
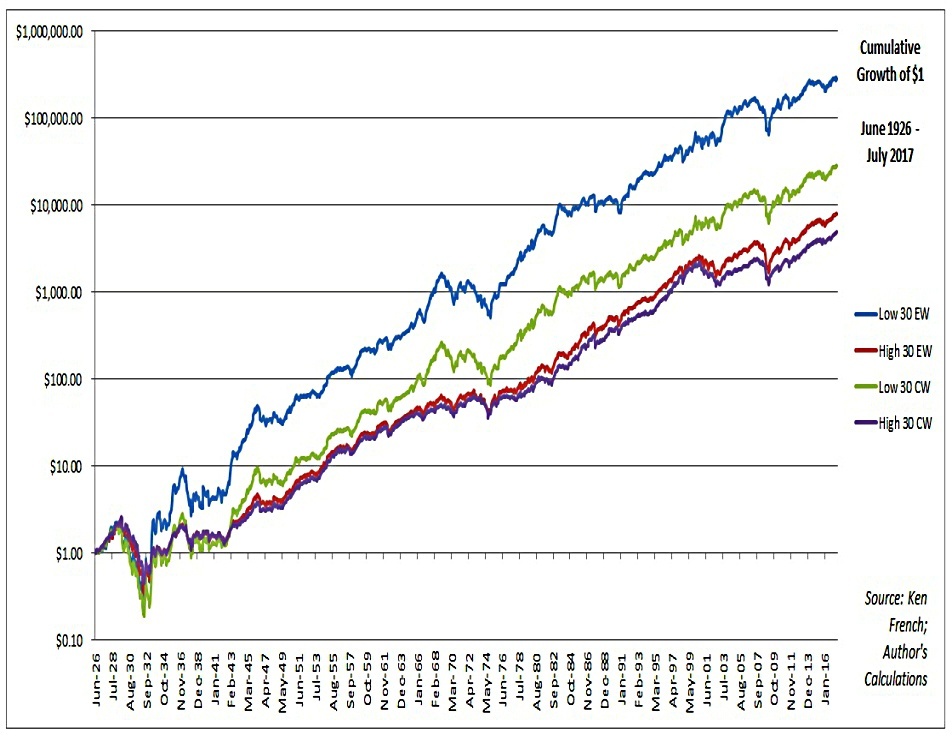
Here the Low 30 is the smallest 30% of the market and the High 30 is the largest 30% of the market.
Jack focuses instead on the growth/value paradox:
Value portfolios (cheap) beats Growth portfolios (expensive), yet the majority of the 50 best investments as of today [from Bessembinder’s work] are growth stocks.
He uses the Franch data again, comparing value and growth to the S&P 500 from 1975 to 2015:

As expected, Value beats Growth.
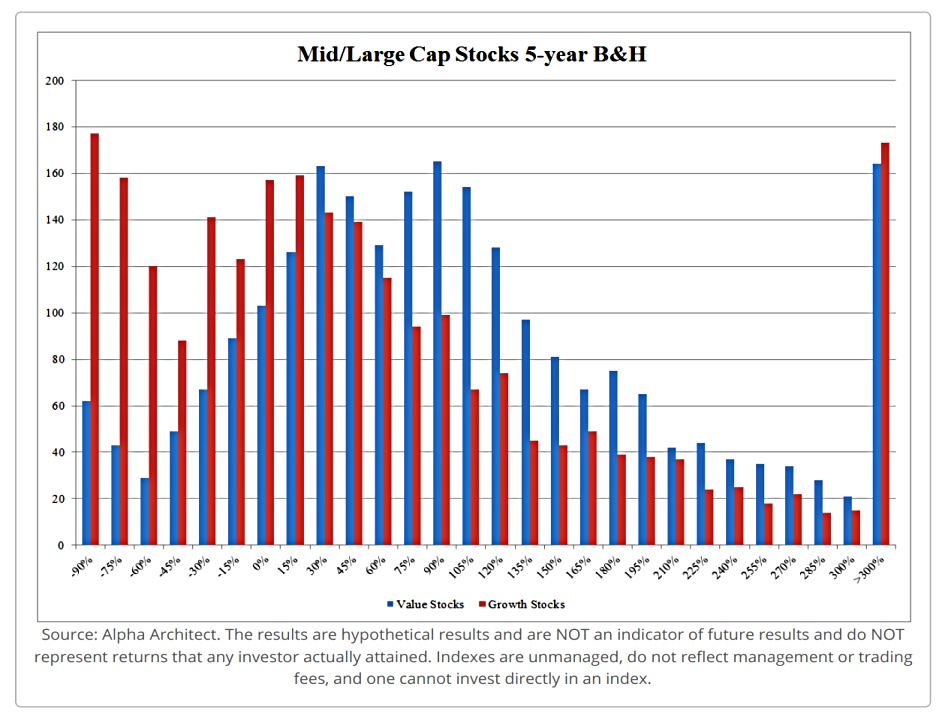
Jack next drops down to the individual stock level, looking at 5- and 10-year returns for large- and small-cap stocks.
Over five years, value wins.
- There are more negative growth stocks and more value stocks with moderate returns.
- The highest returns (> 300%) are slightly more likely to be growth stocks.
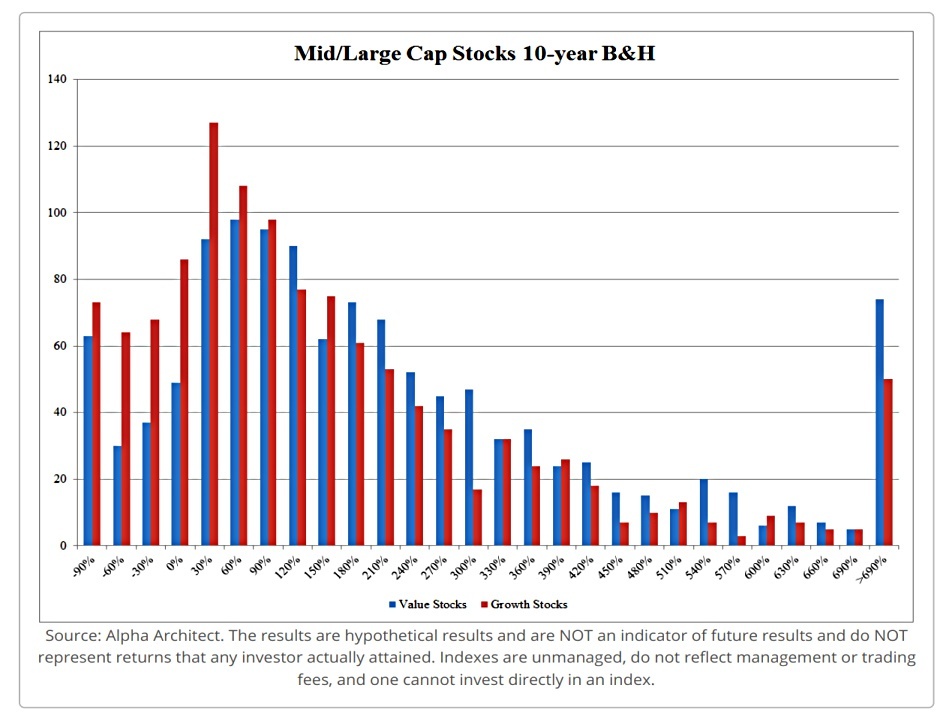
Over ten years, the distributions close up, but value still has the edge.
- And the big winners (> 690%) are now more likely to be value stocks.
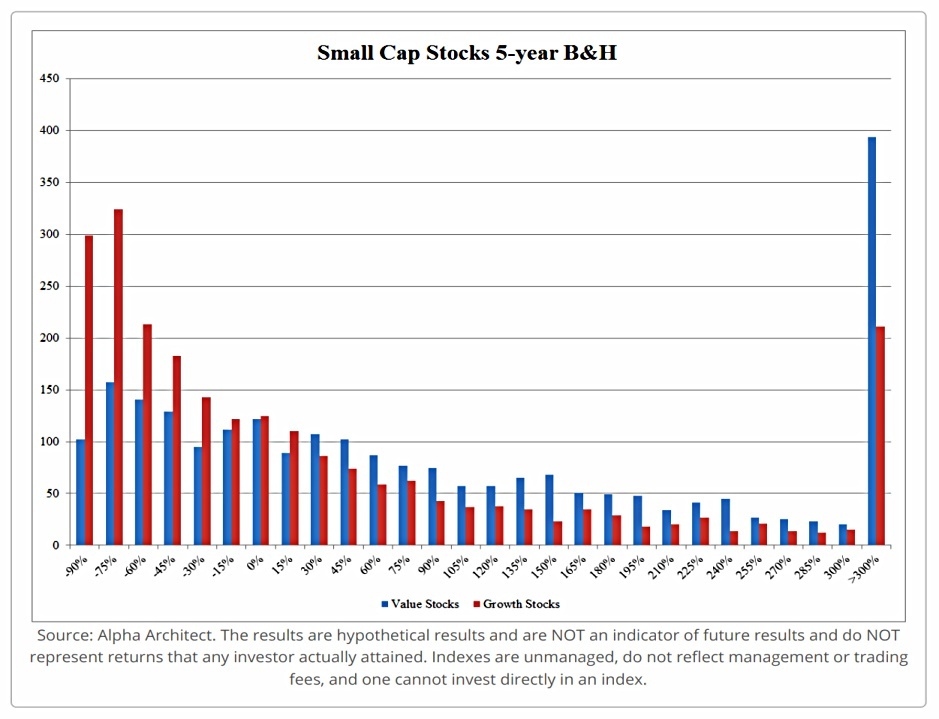
Small caps show similar but more pronounced results.
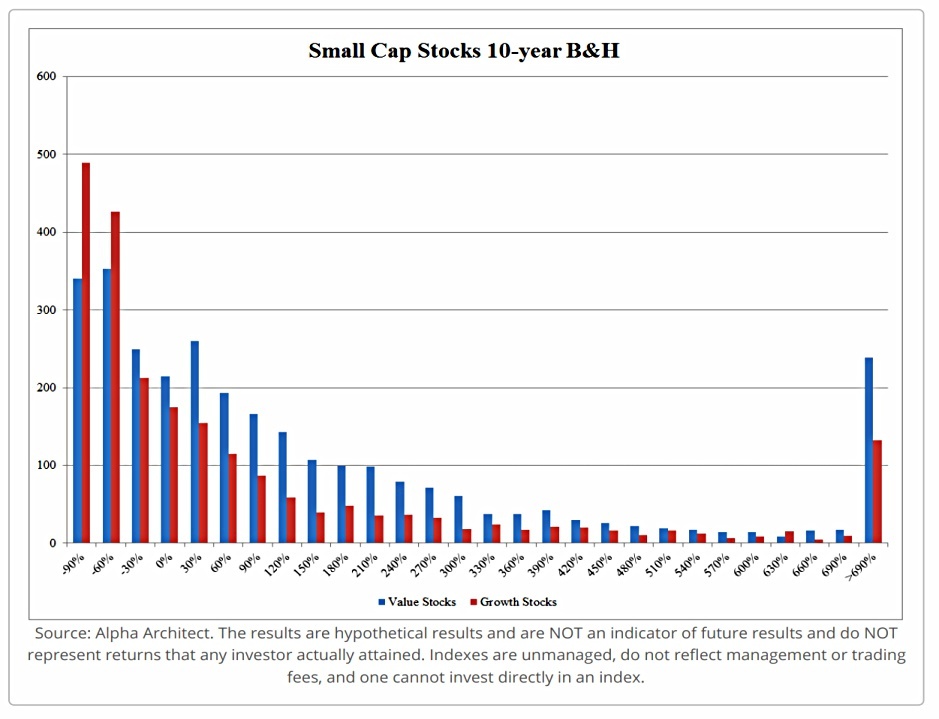
At a 5-year level, there are more Growth stock losers (highly negative returns) and at the 10-year return level there are more big winners from the Value stocks.
Conclusions
Individual stocks and portfolios of stocks don’t have the same characteristics.
Individual stocks are highly negative skewed — tons of losers, with some big winners.
Many of the big winners over the total return history of the stock are growth stocks.
- But over meaningful investment periods, portfolios of value stocks can beat portfolios of growth stocks.
And as we have seen today, individual value stocks also look better on the whole.
- Until next time.
Mike Rawson
Mike is the owner of 7 Circles, and a private investor living in London. He has been managing his own money for 40 years, with some success.