Bessembinder 6 – Finding Multi-Baggers

Today’s post is the sixth in our series on the work of Hendrik Bessembinder on stock returns.
Contents
Bessembinder

A few years ago we looked at a paper from Professor Hendrik Bessembinder, of the WP Carey School of Business at Arizona State University.
- He examined stock returns in the US from 1926 to 2015.
He found that lots of stocks fail in the end, and some have returns worse than bonds, or even negative returns.
- Only 42% of listed stocks provided a better return than cash.
The average stock was listed for just seven years, and the most common lifetime return was a loss of 100%.
- The finding that the industry picked up on was that just 4% of listed stocks were responsible for all of the positive gains of stocks during the period.
A follow-up paper replicated these results for global stocks.
Active managers

Active fund managers like James Anderson, outgoing manager of the wildly successful Scottish Mortgage Trust (SMT), publicly referenced Bessembinder.
- Anderson is understandably keen to attribute the success of the trust to his stock-picking abilities rather than the stellar run of US tech stocks that he is over-exposed to.
He says that gains will accrue to fewer and fewer dominant firms in the future and that winners are:
- Early entrants to markets that later became huge.
- Founder-run.
- Willing to accept/embrace uncertainty.
I agree about the dominance of the major platforms and don’t see more regulation as the answer (since incumbents have deeper pockets with which to fund compliance).
- But overpaying for growth has never worked in the past (see below).
I would also note that Bessembinder is now paid by Baillie Gifford (who manage SMT). so I would expect his research to support the case for active management.
Responses
There are three ways in which to react to Bessembinder’s most famous finding:
- The Anderson route – work out which characteristics will lead to future success, and buy a lot of that kind of thing.
- This is risky but could produce exceptional results (especially over the short term).
- But it’s hard to identify the winners, and the underlying characteristics are likely to change over time.
- Make sure that you are well-diversified
- If it’s hard to pick the winners, you need to hold everything, to make sure that you include them.
- This way lies the Vanguard passive approach, and it’s proven to work.
- Identify the characteristics of stocks that underperform, and avoid them.
- If 4% of the market has all the returns, then the bottom 96% is flat (compared to Treasury bills).
- But leave out the bottom 58% (the ones that Bessembinder found did worse than cash), and you’re going to do pretty well.
- You could start by simply excluding the smallest 20% (or more) of stocks.
For most private investors, a combination of the second and third approaches – plus an allocation to active managers like Anderson (( I hold SMT, even if it doesn’t sound like it )) – is probably the most practical approach.
Value and Growth

When Hendrik’s paper was first published, Jack Vogel over at Alpha Architect set out to reconcile his findings with the idea that – over the long-term – value stocks tend to outperform the growth stocks which Hendrik’s work suggests capture all the gains.
- Small stock portfolios also tend to outperform, but individual stocks don’t (over their lifetime).
At the individual stock level, over five years, there are more negative growth stocks and more value stocks with moderate returns.
- The highest returns (> 300%) are slightly more likely to be growth stocks.
Over ten years, the distributions close up, but value still has the edge.
- And the big winners (> 690%) are now more likely to be value stocks.
Small caps show similar but more pronounced results.
Individual stocks and portfolios of stocks don’t have the same characteristics.
Many of the big winners over the total return history of the stock are growth stocks.
- But over meaningful investment periods, portfolios of value stocks can beat portfolios of growth stocks.
And individual value stocks also look better on the whole.
Stock Winners
Hendrik’s third paper looked at the drawdowns in winning corporations – those with the greatest shareholder wealth creation.
-
- The average worst drawdown was 32.5%.
In the decade prior to that in which these companies were the greatest wealth creators, they suffered worst drawdowns that were on average 51.6%.
- Drawdowns lasted from one month to three years (average 10 months) in the decade of greatest performance.
In the prior decade, they lasted up to eight years (average 22 months).
- So to make money from the biggest winners, you need to be prepared to hang on through some savage drawdowns.
Identifying outperformers
Hendrik published three more papers in 2020, on the topic of identifying outperforming companies.
- The first step was to look for outperforming sectors – tech comes to mind.
Looking at the best performing 200 stocks, tech is indeed over-represented, but so are healthcare, telecoms and energy.
- The problem is that tech (and to a lesser extent, telecoms) is also over-represented at the bottom end of the scale – ever more so than at the top.
Joachim Klement notes that this makes tech a sector in which it is very important to distinguish between winners and losers, and therefore a sector in which fundamental analysis can really pay off.
The second and third papers drilled down into the most common characteristics of future performers, and then look at whether these can be used to identify winners.
The main characteristics were:
- they invested more in R&D in the previous decade (4.8% of assets compared to an average of 2.8%)
- they had serious drawdowns in the previous decade (81% compared to an average of 70%)
The worst 200 stocks had different features:
- they were losing money in the earlier decade (-10.1% of assets compared to average profits of 1.1% of assets)
- they had high growth in intangibles (19.6% over the decade compared to 8.6%)
- they were slightly more leveraged (debt to assets of 58% compared to 50%)
- they had issued more new equity in the previous decade (26% of assets compared to 9%)
Which all sounds great, apart from the fact that these two sets of features only explained 2% of the variation in returns.
- Leaving 98% unexplained – the search for the next Amazon is still quite difficult.
Finding Multi-baggers

The 2021 paper looks at multi-bagger stocks. (( As with the 2020 papers, I must thank Joachim Klement for bringing it to my attention ))
- This is good timing for me – I’ve just finished Christopher Mayer’s book “100 Baggers” and I will be writing about it soon.

![]()
Having found that fundamental factors only explain 2% of the variation in returns, this time Hendrik looks at momentum.
In particular, how likely is it that a stock which goes up in value 5x will do so again and again and again (to 25x, 125x and 625x respectively)?
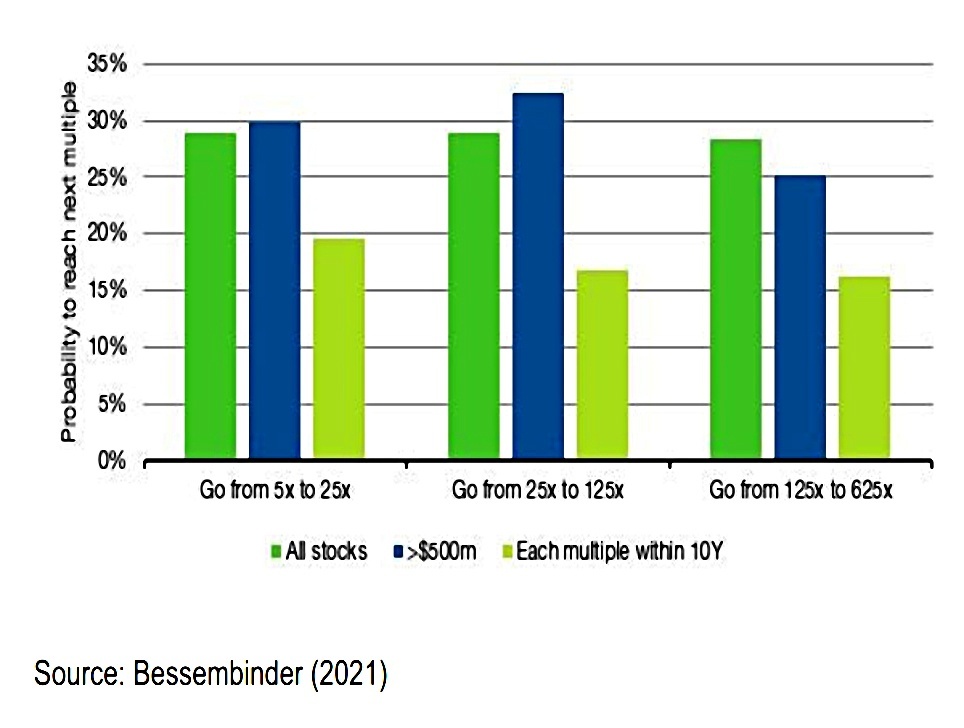
It turns out that 45% of US stocks listed between 1950 and 2020 made it to 5x (from their all-time low).
- And 30% of those get to 25x.
- And 30% of these get to 125x.
- And 30% of these get to 625x.
Multi-bagging sounds much easier than we might have thought but those percentages work out to 1 in 8 for 25x, 1 in 20 for 125x and 1 in 100 to 625x.
- Still much more common than I would have expected,
Applying a filter of minimum market-cap $500M at 5x (ie. $100M to begin with) still results in the same odds.
- You can reduce the odds somewhat by insisting on a time limit (say 10 years) for each 5x step.
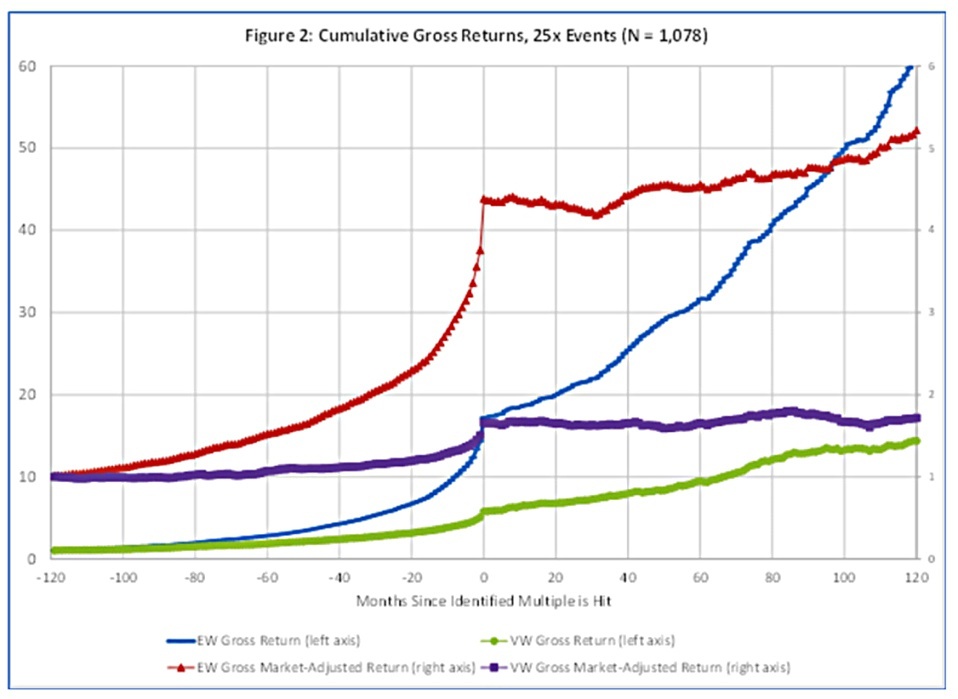
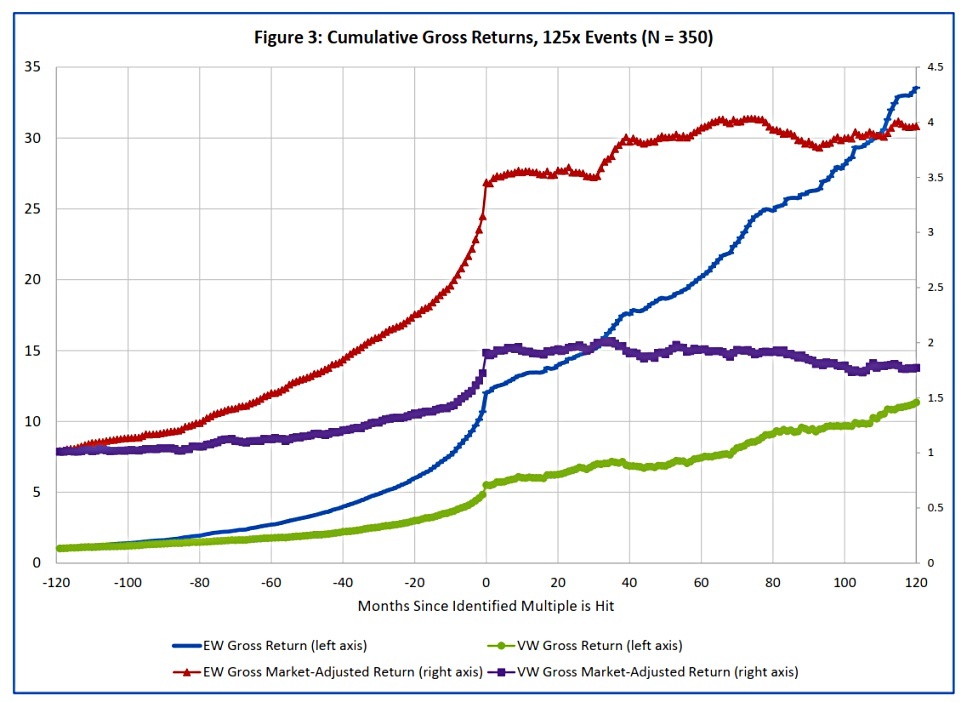
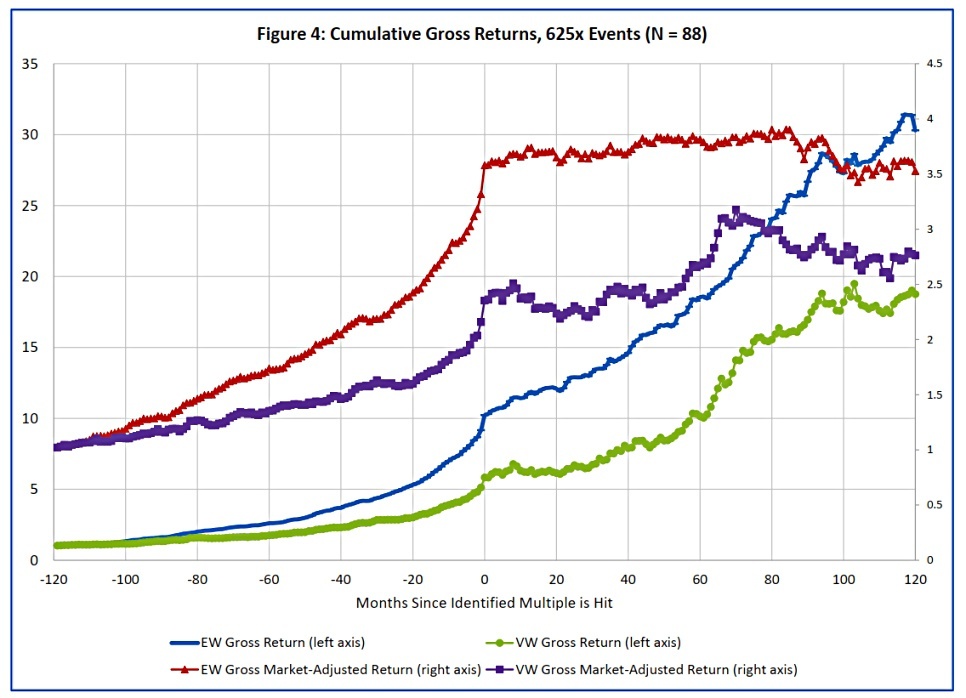
The mean time from the prior low point to a 5x multiple for those stocks that did achieve the 5x multiple was 45 months. The mean time from the prior low point to a 25x multiple was 143 months, from the prior low point to a 125x multiple was 271 months, and from the prior low point to a 625x multiple was 375 months.
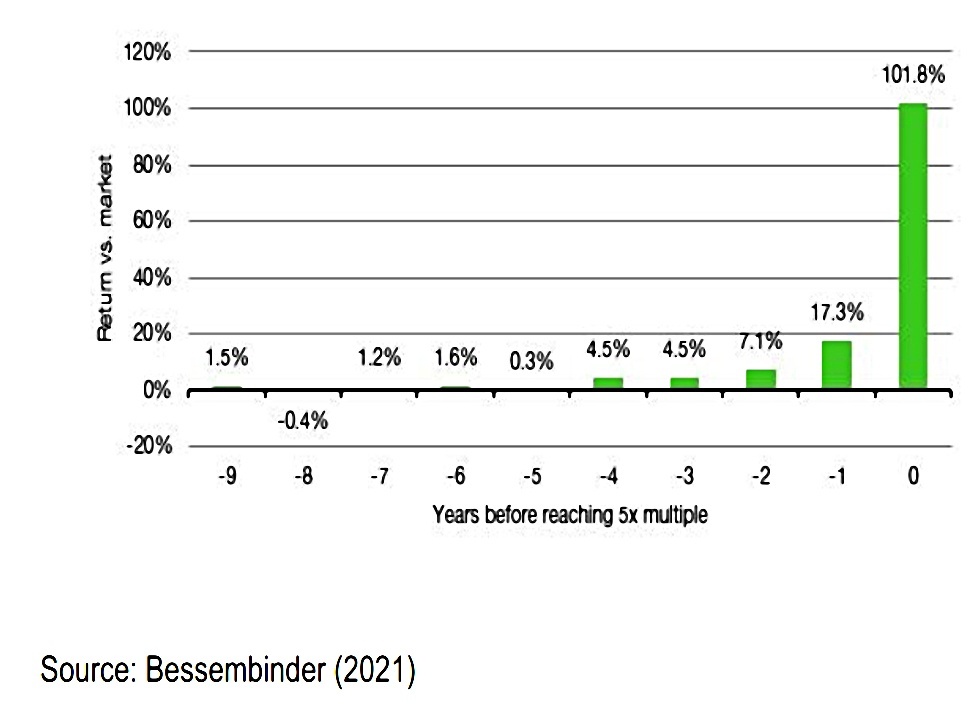
So there are a lot of multi-baggers, but can we identify them in advance?
- The multi-baggers start to outperform the market around four years before they 5x, but the outperformance accelerates massively in the last couple of years, with almost all of the outperformance coming in the final year – which is not much use.
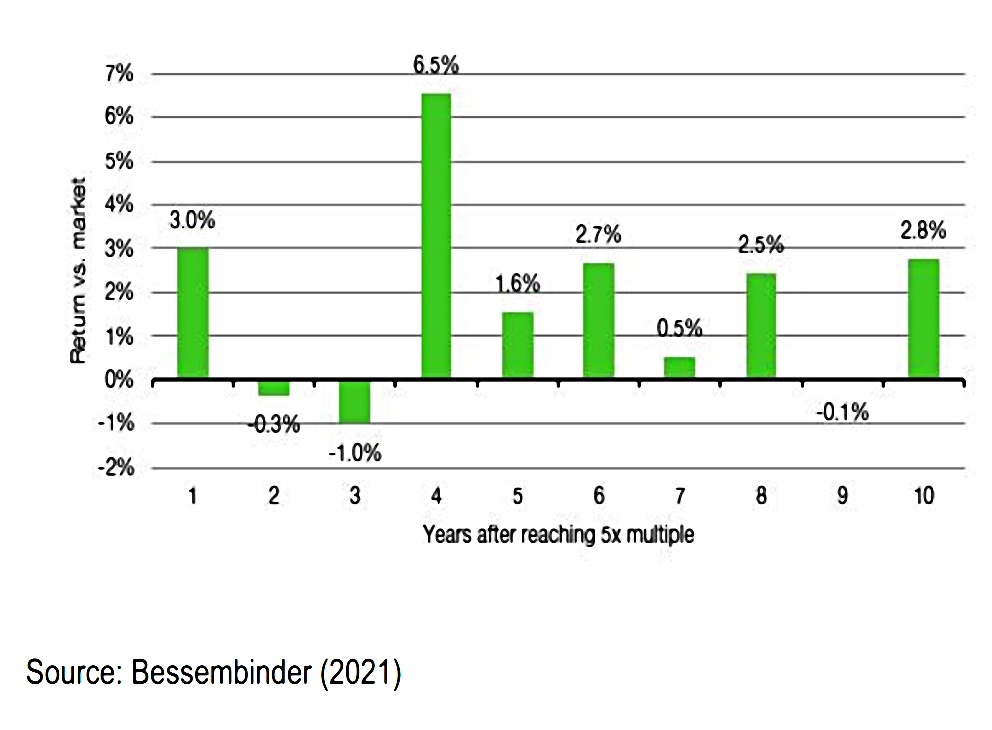
Even worse, once we hit 5x, returns are all over the place.
- There’s no long-term momentum effect to help us to hang on for the ride.
Conclusions
Hendrik agrees:
“Winner” stocks are not uncommon in the U.S. markets. However, this study reveals little or no evidence that a strategy of investing in those stocks that previously attained a given gross return multiple generates abnormal returns during subsequent months.
And as I predicted, he argues in favour of active management:
To be successful, investment strategies that involve concentrated portfolio positions require the ability to reliably discern between stocks where the current market price fully incorporates the firm’s future potential versus those that do not.
That’s it for today – we’re up to speed with Hendrik’s work once more.
- I’ll be back with another article in this series when a new paper emerges.
Until next time.
Mike Rawson
Mike is the owner of 7 Circles, and a private investor living in London. He has been managing his own money for 40 years, with some success.