Risk Parity Methods – ReSolve
Today’s post looks at a paper from ReSolve Asset Management on Risk Parity Methods and Measures of Success.
Contents
Risk Parity Methods
I’m not sure when the ReSolve paper was published, but I came across it in July 2020, and it uses data from 1985 through May 2020, so I think we can say that June or July 2020 are favourites.
- Since then, Covid has disturbed the markets somewhat, but as the vaccination programme begins to support a return to normality, I’ve circled back to looking at portfolio construction and diversification.
The paper looks at the use of risk parity to build regime-agnostic portfolios, and critiques the use of measures like the Sharpe ratio and drawdowns to evaluate their effectiveness, and to predict their effectiveness in future market scenarios.
Risk parity
Risk parity (RP) is based on two principles:
- The future is unknowable
- Diversification is the best defence
Implementation means:
- Owning assets with uncorrelated responses to different economic environments
- The impact of each asset on the portfolio’s risk and return should be balanced
We’re looking for exposure to as many different systematic risks as we can find, with minimum exposure to idiosyncratic risks.
- We expect the systematic risks to produce a similar amount of excess return per unit of risk.
Definitions
This still leaves a lot of room for interpretation:
- What are the systematic risk factors?
- How do we define the risks / economic environments?
- How do we balance between risks which occur with different frequencies?
- How do we measure success (returns/drawdowns/balance)?
ReSolve conclude:
Most reasonable investors want solutions that maximize expected risk-adjusted returns while minimizing vulnerability to any particular type of market environment.
Futures

Futures markets are a natural fit with RP because they provide a wide investment universe for diversification, and they support leverage.
- Leverage is needed to juice returns and balance assets with different volatilities.
ReSolve ignore currencies:
There is no coherent way to define long or short exposure since one can only be long one currency by being short in another.
Principal Portfolios
The paper discusses approaches to clustering markets and risk sources:
- Heuristically (stocks, bonds, commodities etc.)
- Correlations and other distance measures like returns (eg. Hierarchical Risk Parity)
- Approaches like Principal Component Analysis (PCA) which looks for underlying sources of uncorrelated risk across markets
- These are then translated into long/short portfolios across markets
- “Factors” with little explanatory power are discarded (( This is known as “eigenvalue clipping” ))
- PCA is similar to regression and portfolio optimisation and has similar instability issues
- These can be mitigated by restricting factor portfolios to long-only, which brings PCA back closer to the heuristic clustering approach.
Using 2019 data, Resolve came up with seven significant principal portfolios (PPs):
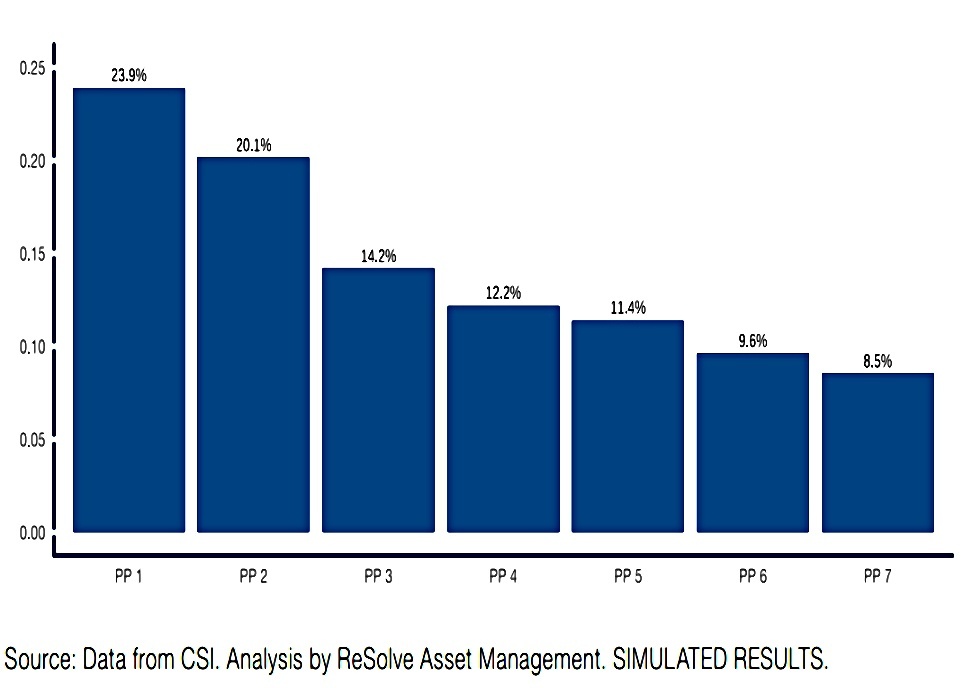
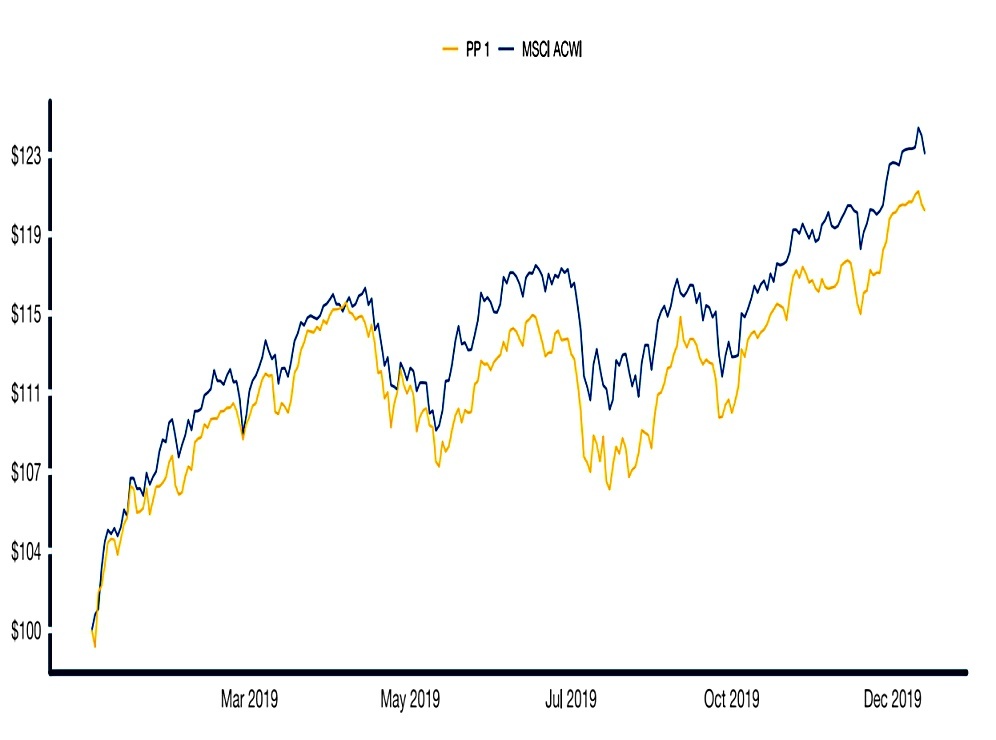
PP1 is a growth factor (equities, oil and copper):
PP2 is a bond factor:

PP5 is a commodities factor:
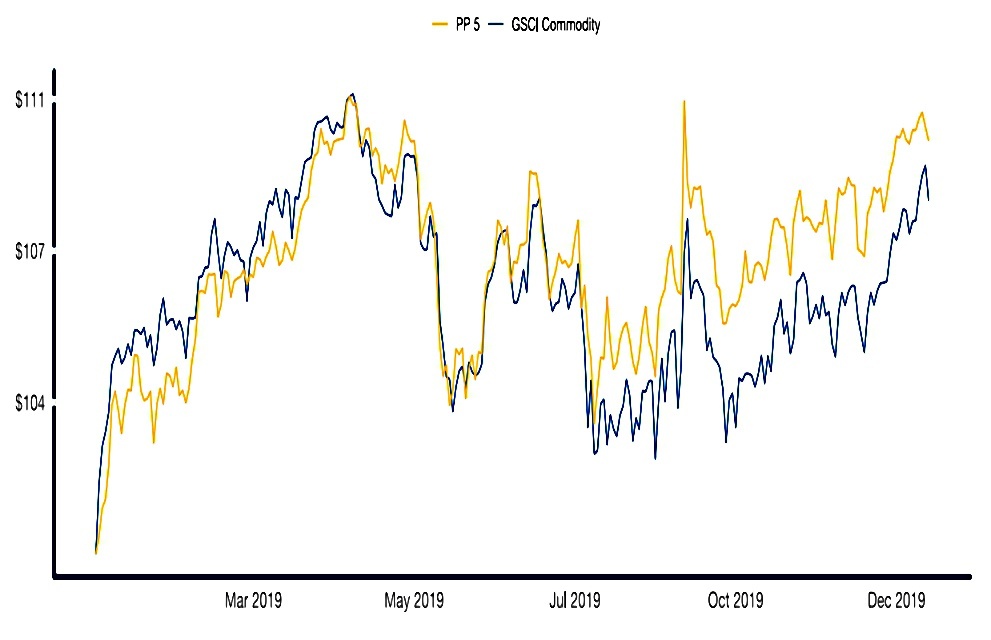
The other four factors are less clear.
Methods
The ReSolve analysis begins in 1985 because that’s when they have enough futures contracts.
- New contracts are added once they have a year of data.
They create portfolios with equal risk to the seven PPs.
We perform a walk-forward optimization which rebalances portfolios weekly in four tranches. The objective is to approximate a monthly rebalance horizon, but reduce sensitivity to end-of-month rebalance dates and reduce noise that might be introduced by good or bad timing luck.
There are lots of ways of combining the PPs:
- INV-VOL – Inverse volatility, good when Sharpes and correlations are similar
- INV-VAR – Inverse variance, good when returns and correlations are similar
- Clustering, based on similarity (this sounds like hand-crafting)
- Equal Risk (volatility) Contribution (ERC)
- Maximum Diversification (MAX-DIV), which can be highly concentrated and sensitive to co-variance estimates
- Hierarchical Sub-Space Risk Parity (HRSS), using random sub-selections
- Principal Component Parity (there are four versions of this)
- ENSEMBLE of the above seven methods
The analysis looks at returns, Sharpes and the Ulcer Ratio (duration and magnitude of drawdowns).
Results
All of the methods produced good results:
Most Sharpe ratios are close to 1. Strategies exhibit mild negative skewness and minimal excess kurtosis compared with individual markets, which averaged 0.28 and 6.25 (absolute values), respectively.
This is compelling evidence that diversification is very effective in truncating the so-called “fat-tails” of return distributions so that they may be effectively modeled under log-normal assumptions.
Variance-weighted strategies do slightly better, and the ENSEMBLE approach performs best of all.
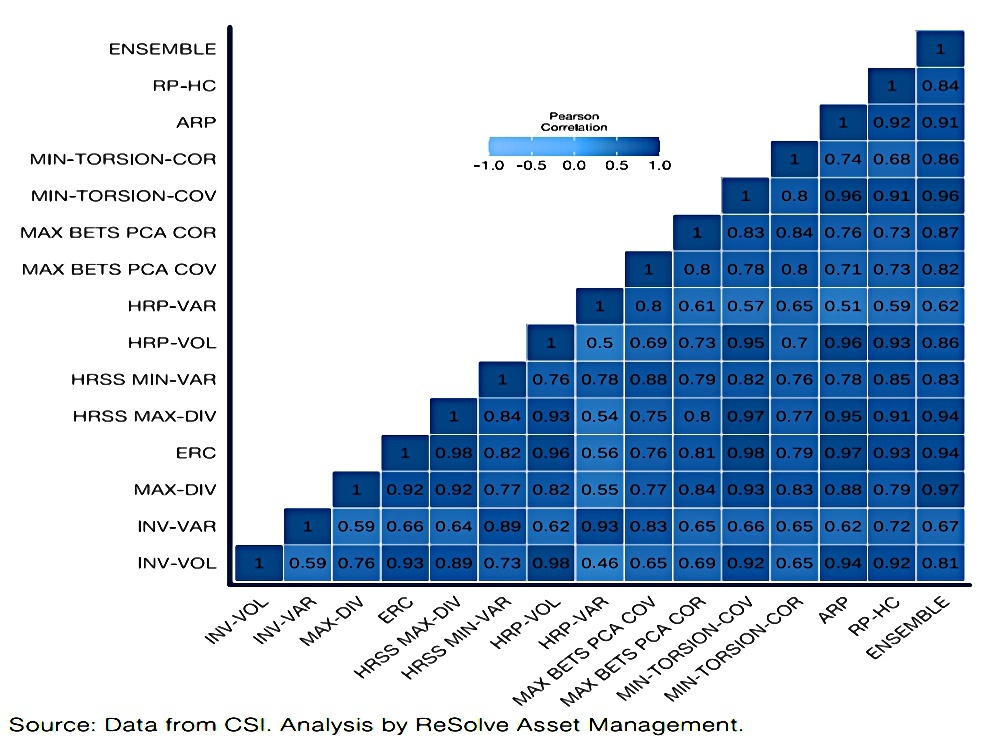
The average pairwise correlation between methods is 0.79 but they range from 0.46 at the low end to 0.98 at the upper end. It’s clear that different risk parity methods produce portfolios with surprisingly diverse qualities.
Diversity across markets
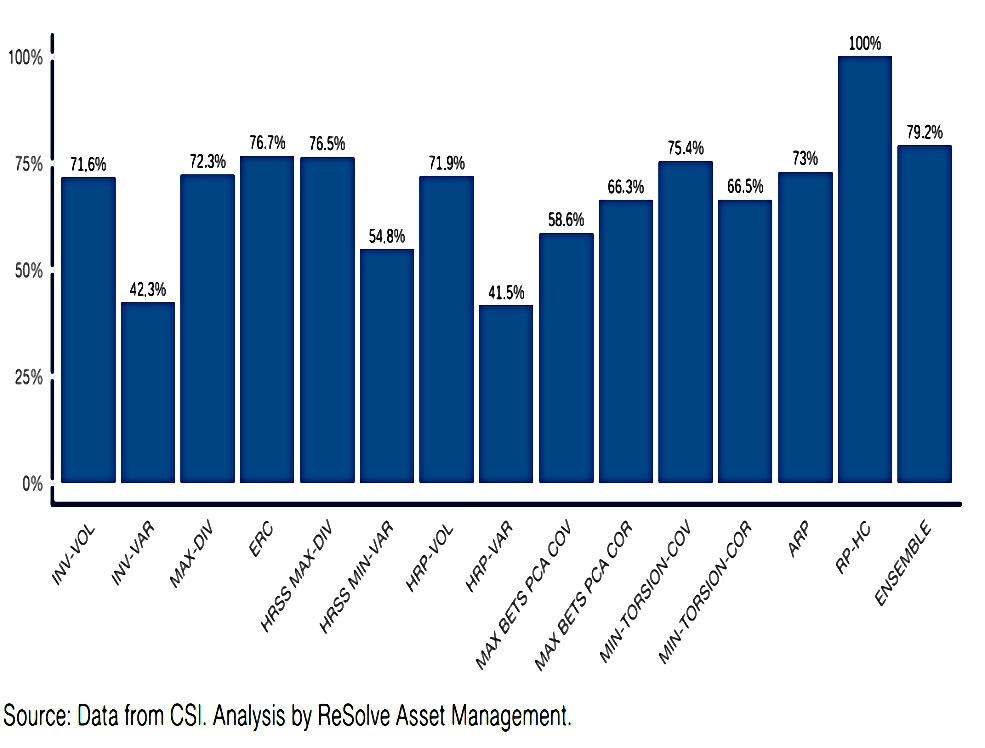
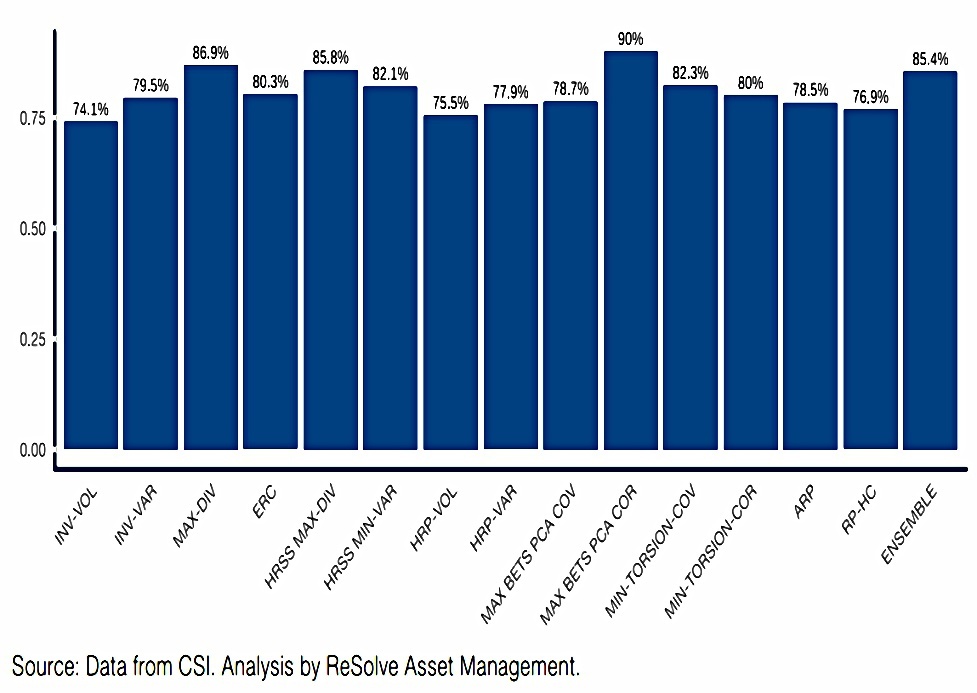
ReSolve looked at how well the methods achieved risk balance across markets:
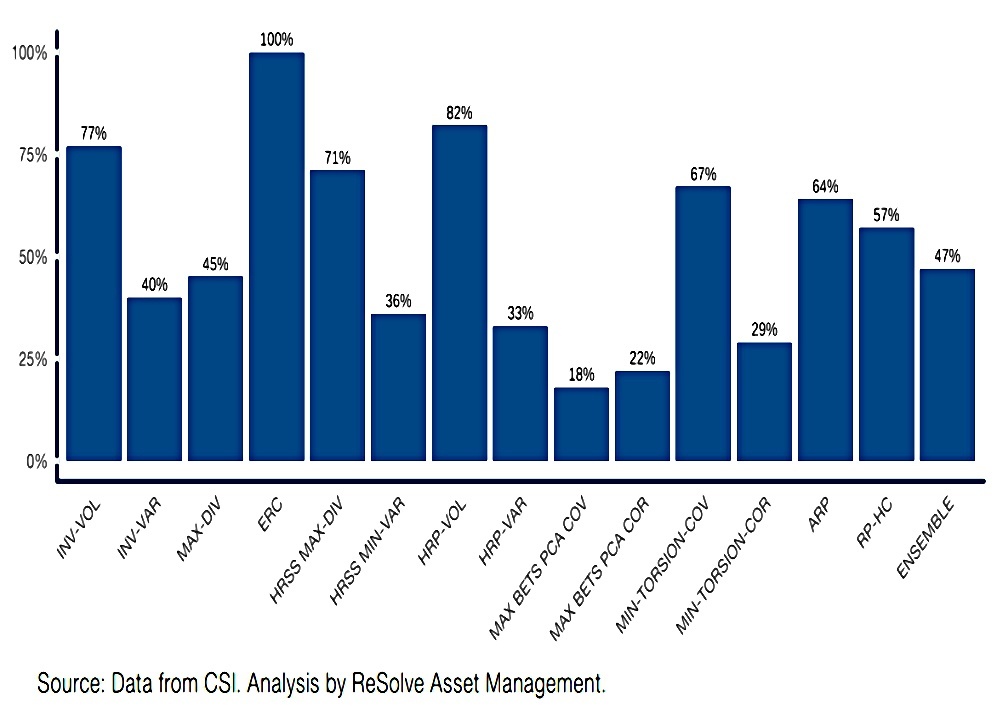
ERC will always score 100% on this one.
Diversity by independent bets
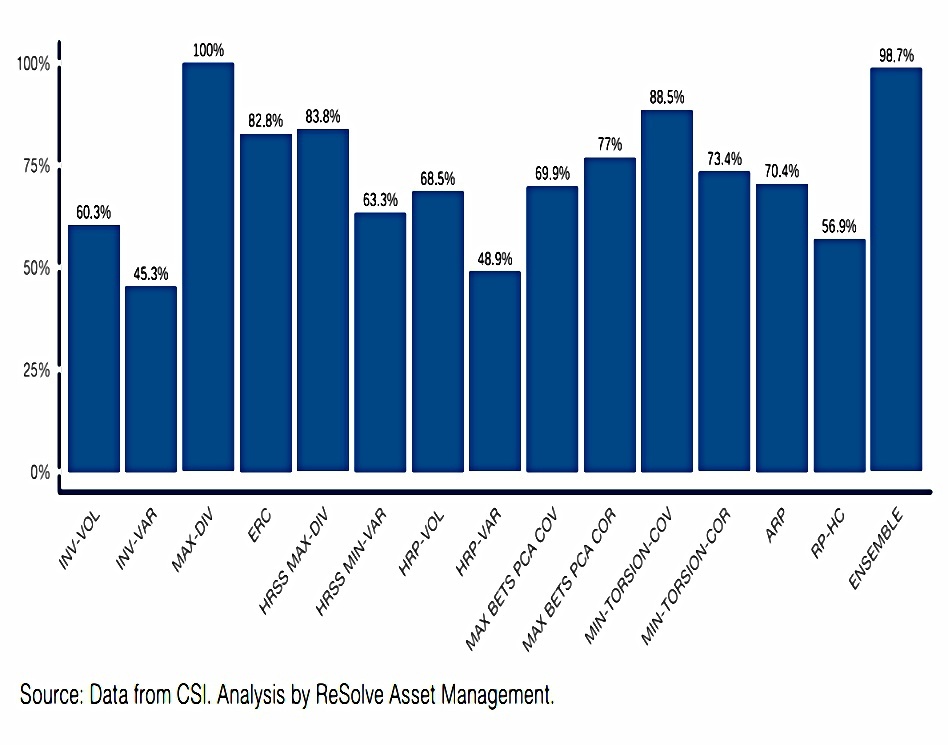
MAX-DIV is the benchmark here.
Diversity by asset class
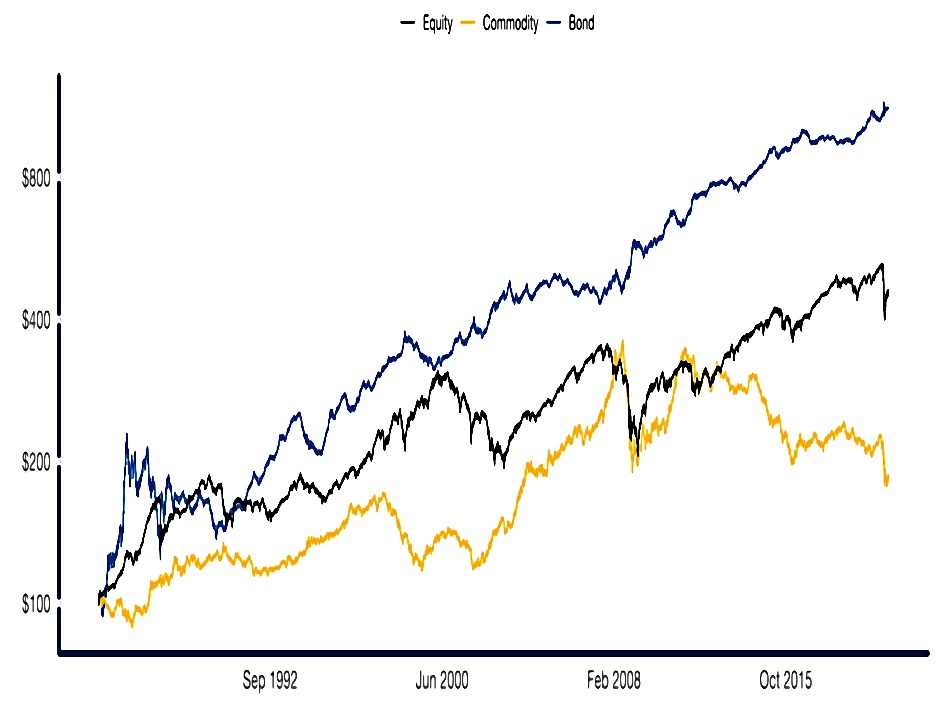
The bond cluster produced the best risk-adjusted performance over the in-sample period, with a Sharpe ratio of 0.71 vs equity and commodity cluster Sharpe ratios of 0.47 and 0.22, respectively. It was obviously preferable to overweight bonds in-sample.
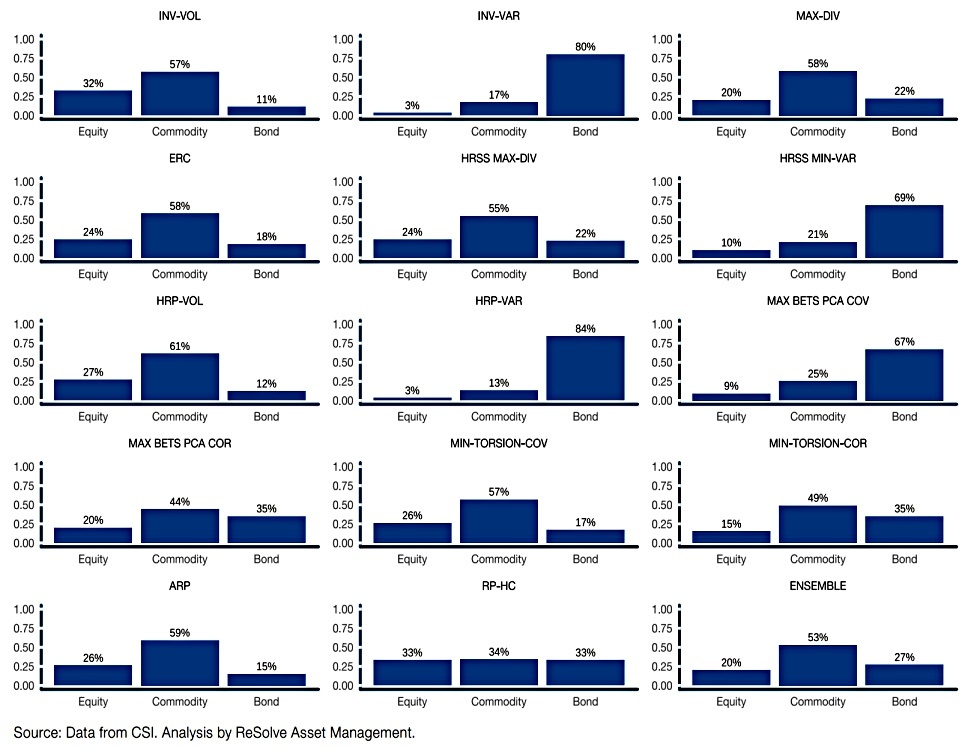
Inverse variance based methods like INV-VAR, HRSS MIN-VAR, and HRP-VAR load heavily on Bond risk. This bias would be expected to result in higher in-sample return.
However, a large bias toward bonds implies vulnerability to inflationary shocks. Given that bond yields are very near all-time historical lows, future returns to bond-heavy methods should be much lower going forward.
Diversity across economic environments
The real point about RP is its promised resilience to all economic regimes.
Asset prices do not change in response to favorable or unfavorable environments. Rather, asset prices reflect investors’ current expectations about a favorable or unfavorable environment.
Prices will only experience meaningful change if investors receive new information that represents a shock to their current expectations.
ReSolve characterise economic regimes in terms of future inflation and growth, which gives four options:
- Inflationary growth: Positive inflation shocks and positive growth shocks
- Disinflationary growth: Negative inflation shocks and positive growth shocks
- Inflationary stagnation: Positive inflation shocks and negative growth shocks
- Deflationary stagnation: Negative inflation shocks and negative growth shocks
We measure changes in inflation expectations as the difference between 12-month change in CPI and 36-month change in CPI. We measure changes in growth expectations by measuring the difference between 12-month change in GDP and 36-month change in GDP.
Note that the four regimes don’t occur with equal frequency during the sample period.
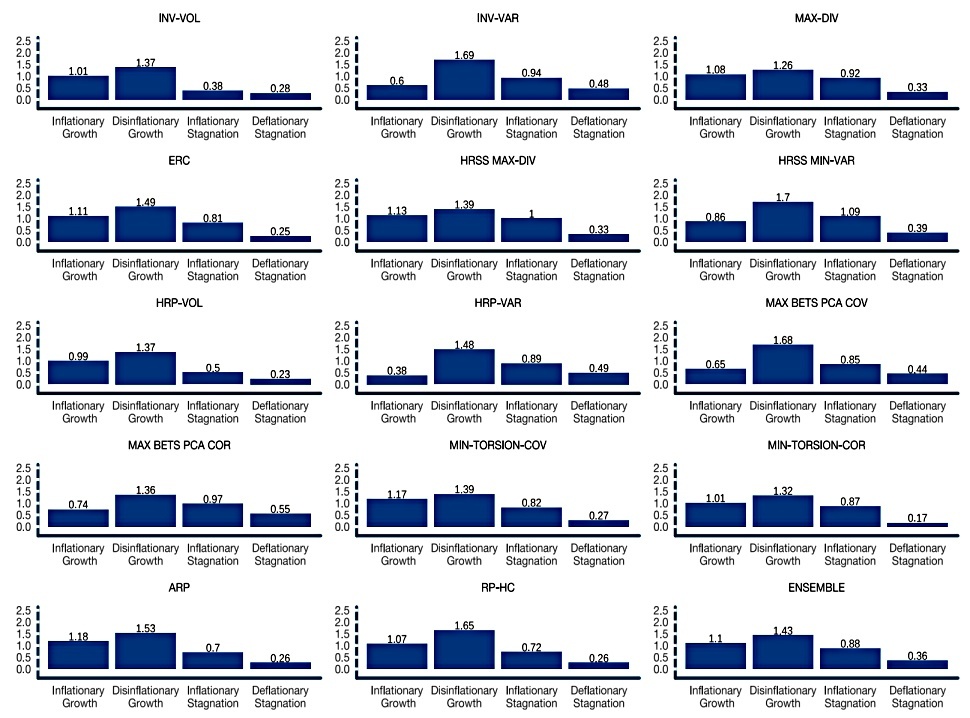
It’s clear that many methods are biased toward certain regimes.
Disinflationary growth was best for most methods (this was also the dominant regime).
Variance-based methods like INV-VAR, HRSS MIN-VAR and HRP-VAR, and MAX BETS PCA COV11 are especially predisposed to this regime. Inverse volatility oriented methods like INV-VOL, ERC, and HRP-VOL all exhibit more balanced results.
Methods that ignore variance, such as MAX-DIV, HRSS MAX-DIV, MAX BETS PCA COR and MIN-TORSION-COR all produced admirable performance across all four regimes. The ENSEMBLE also exhibited balanced exposure across regimes.
The MAX-DIV, MAX BETS PCA COR and ENSEMBLE methods stand out as providing the most stable performance across macro-economic environments.
Systematic investing
ReSolve also look at other sources of return:
- Investors are often slow to adapt to new information and are prone to extrapolate intermediate-term trends while underestimating the tendency of corporate or economic prospects to revert to the mean13.
- Many investors also express a preference for “lottery ticket”-type investments;
- eschew leverage;
- prefer investments with positive skew;
- avoid taking short positions; and
- chase performance at precisely the wrong horizon.
- They also overpay for insurance against large short-term losses
- Commodity producers are motivated to lock in forward prices to hedge their business risk, and speculators can earn a risk premium for taking on this risk.
- Other systematic profit opportunities arise due to structural factors or the actions of global institutions that may pursue non-wealth-maximizing objectives to achieve political or longer-term policy goals.
For me, this is systematic investing rather than RP, but from a practical perspective, I’m interested in all sources of potential return.
ReSolve look at six systematic strategies:
- Trend
- Carry
- Skew
- Take long(short) positions in futures markets with negative(positive) skewness measured in a variety of ways over many lookback horizons.
- Seasonality
- Value
- Volatility
- Take long(short) positions in futures markets with negative(positive) skewness measured in a variety of ways over many lookback horizons.
These are trading strategies, and ReSolve look at weekly rebalancing (in five daily tranches).
Extended RP
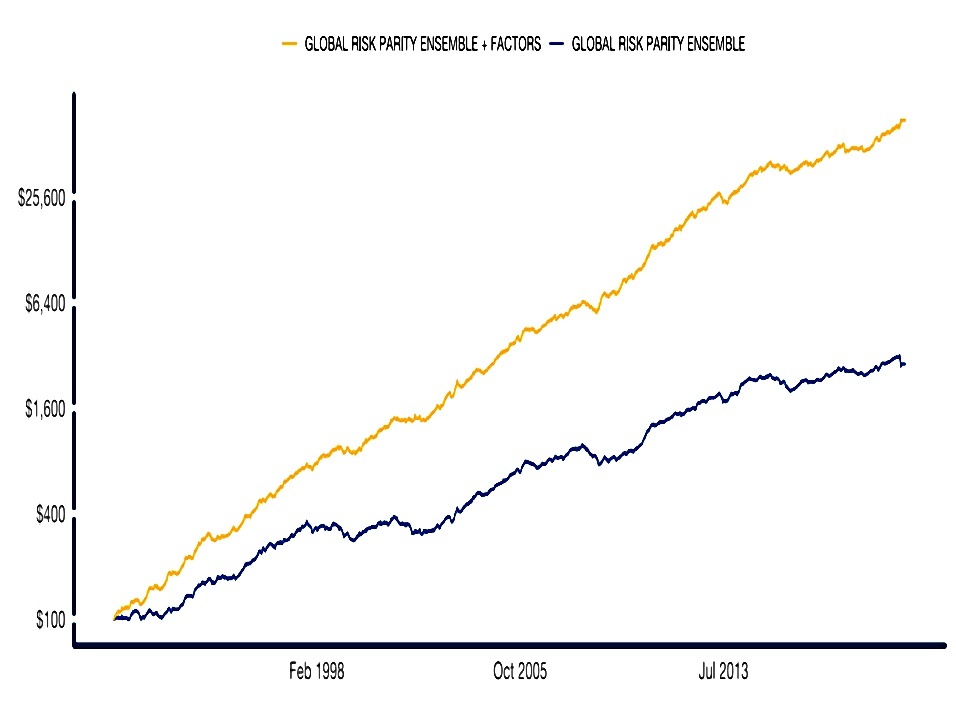
ReSolve create an “Extended RP” strategy made up of:
- A 50% risk allocation to the ENSEMBLE RP strategy
- A 50% risk allocation split equally across the six systematic strategies
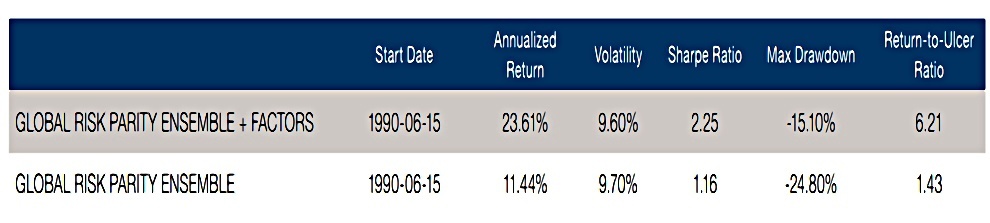
This new portfolio looks pretty good to me.
Conclusions
ReSolve draw five conclusions:
- Different risk parity methods exhibit trade-offs between different measures of diversity
- The in-sample period may not be representative of future economic regimes
- Here bonds outperformed, but they might not in the future.
- Similarly, out of sample (live) performance will reflect other biases in the “winning” strategies
- Adding systematic strategies to “traditional” RP factors gives a large improvement in performance
- Option strategies should be added to protect against “unimaginable” risks (“black swans”)
And:
The truly prepared investor shouldn’t skimp on canned goods, defensive gear, and waterproof matches.
Until next time.
Mike Rawson
Mike is the owner of 7 Circles, and a private investor living in London. He has been managing his own money for 40 years, with some success.