Buy and Hold

Today’s post looks at a paper from 2017 about the Buy and Hold approach to stock market investing.
Buy and Hold
The paper is by Professor Edward McQuarrie of Santa Clara Business School and is called Stock Market Charts You Never Saw.
- McQuarrie warns against a focus on the performance of the US stock market since 1926.
He looks at earlier and shorter periods and compares stocks with other assets.
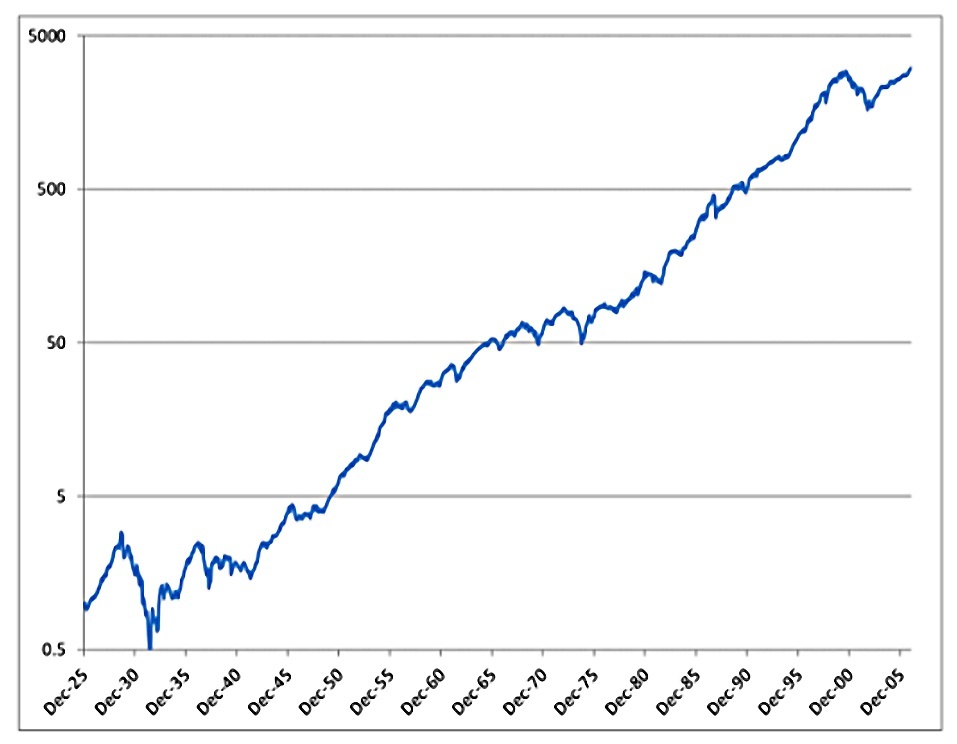
This is the kind of chart that most advocates of Buy and Hold market-cap index investing like to refer to.
- It shows 80 good years in the US stock market, starting with 1926.
Charts like this are used to argue that stocks return 6-9% pa.
- Sometimes the index investors will mention that this is after inflation and dividend reinvestment, and sometimes they won’t.
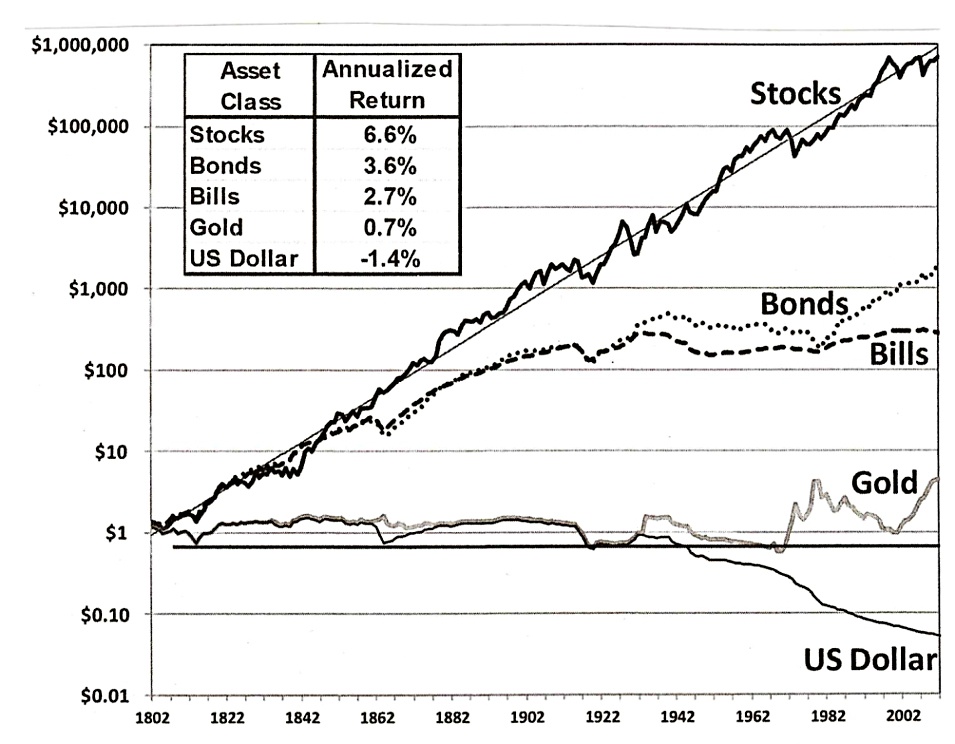
The first chart is usually paired with a chart like this one, which shows stocks outperforming the other standard asset classes (bonds, cash and gold).
Both of these charts are true representations of what happened, but the picture becomes more complicated when we look at other periods, or shorter periods, or other countries.
- Stocks don’t always do well, and they don’t always outperform other asset classes.
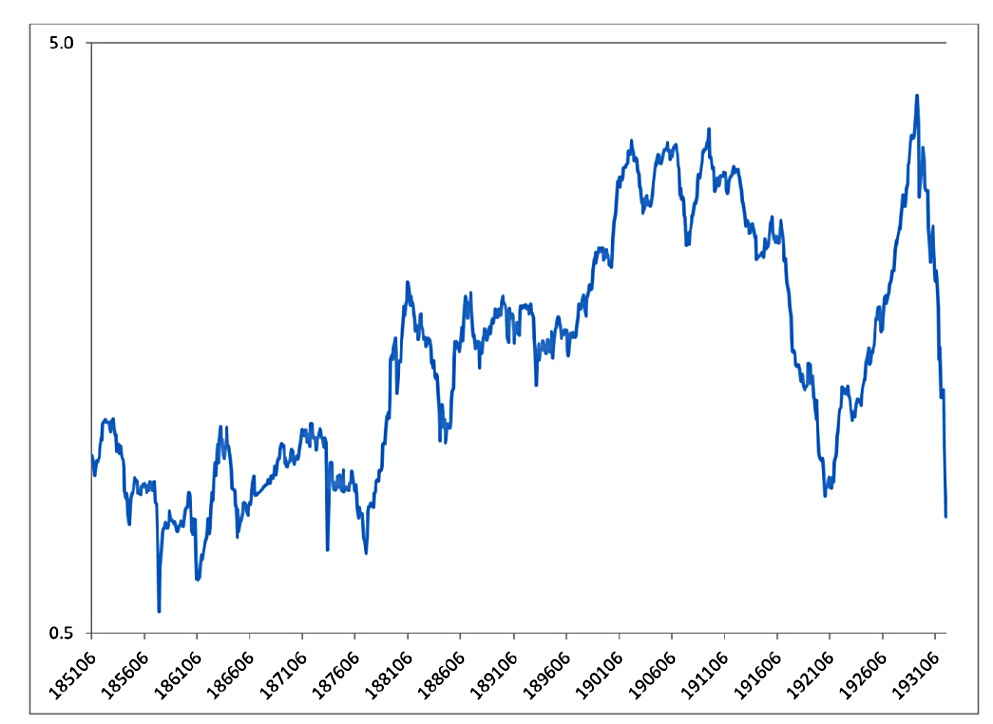
Here’s the graph for a different 80 years in the US, this time starting in 1852.
- We end up lower than we started (if inflation is deducted and dividends are excluded).
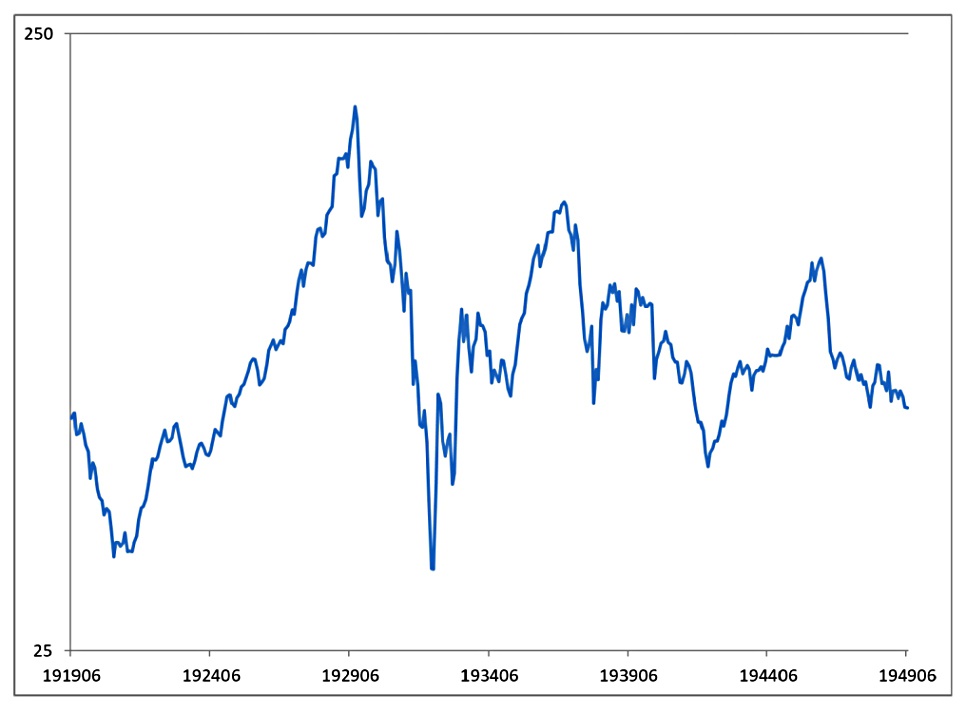
And here’s what McQuarrie calls “30 years of disappointment” which overlap with the start of the “good chart” that we began with.
- Here we end up in 1949 back where we started in 1919.
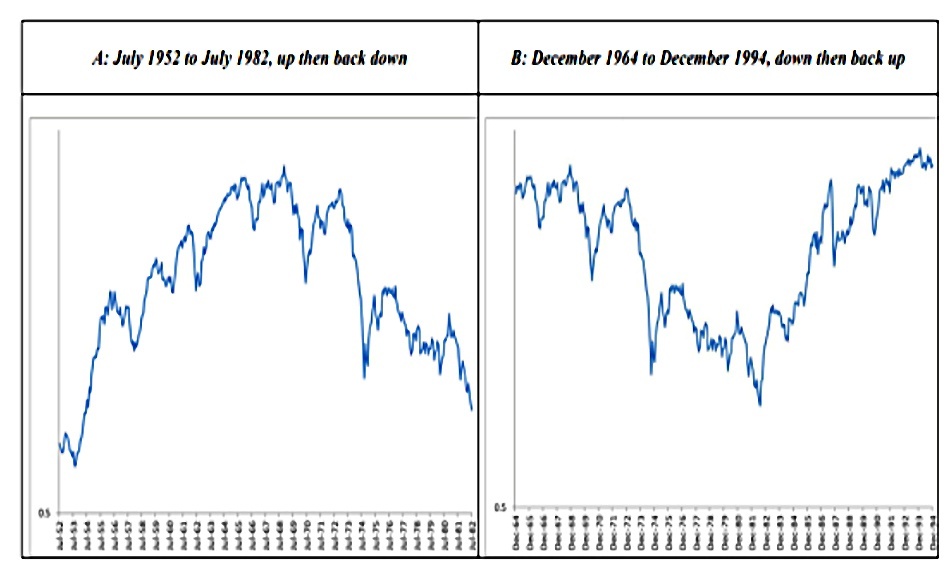
Here are two more disappointing periods from within the original 80 years:
- 1952 to 1982 – up then back down
- 1964 to 1994 – down then back up
McQuarrie’s point is that stocks are unreliable (volatile).
- The returns from Buy and Hold depend on when you buy and for how long you Hold.
Short periods of tremendous stock market performance are followed by long periods of underperformance and sometimes negative real growth.
To further hammer home this point, McQuarrie subdivides a very long-term view of the market:

This chart shows 185 years in the US market.
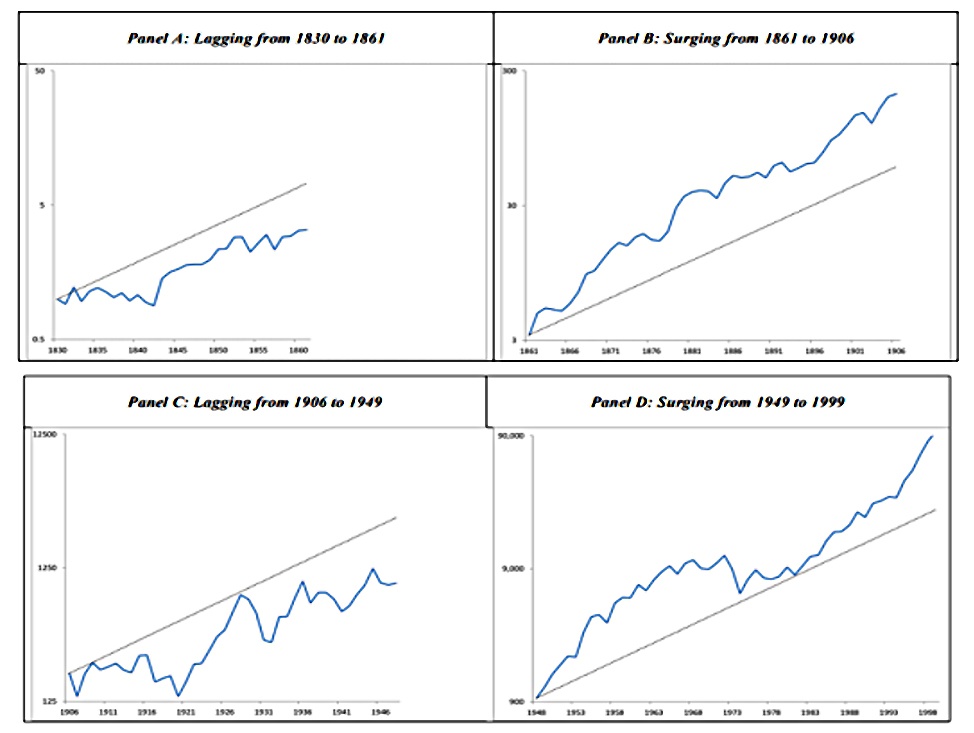
And this one subdivides the same period into four:
- 31 years of lagging
- 45 years of surging
- 43 years of lagging
- 50 years of surging
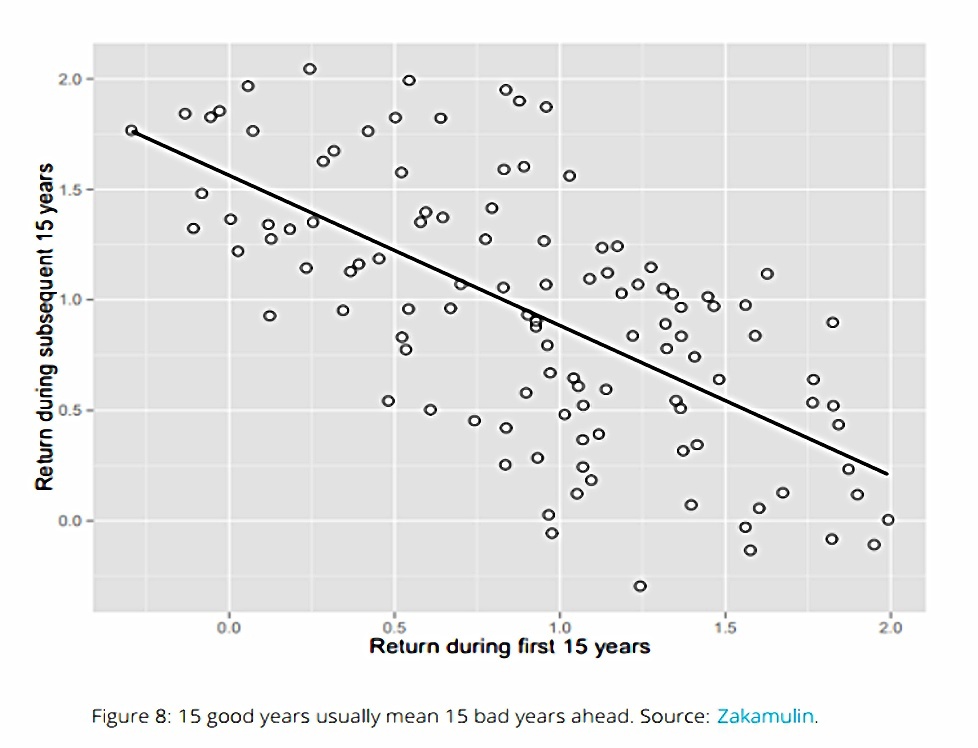
Other studies have found that this kind of reversion operates on a shorter cycle, perhaps as little as 15 years.
Other markets
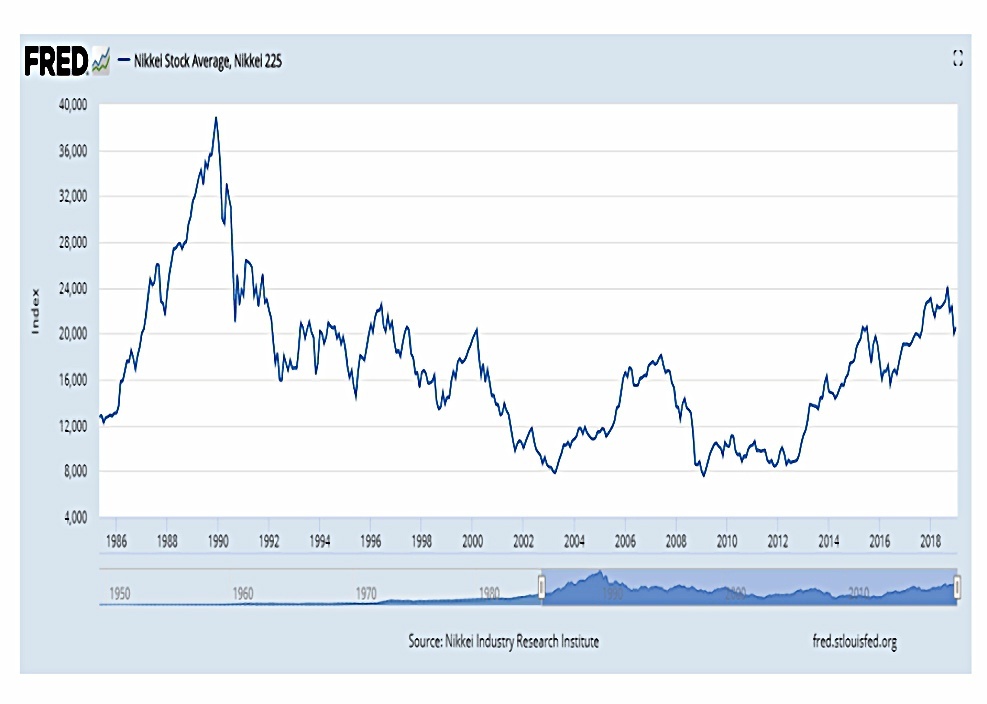
Stepping away from the US for a moment, here’s a chart of the Japanese market since 1985.
- It’s hard to recall in the present-day the extremely high regard in which the Japanese market – and Japanese business practices in general – were held in the 1980s.
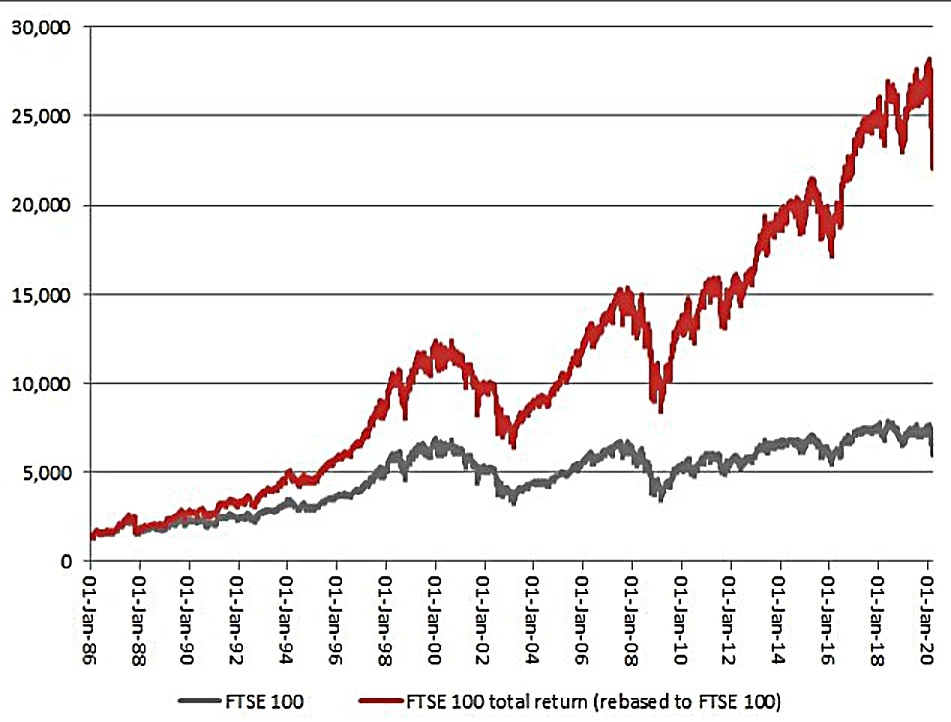
Here’s the FTSE-100 over the same period (grey line).
- The red line shows the impact of dividend reinvestment, which we’ll come on to in a moment.
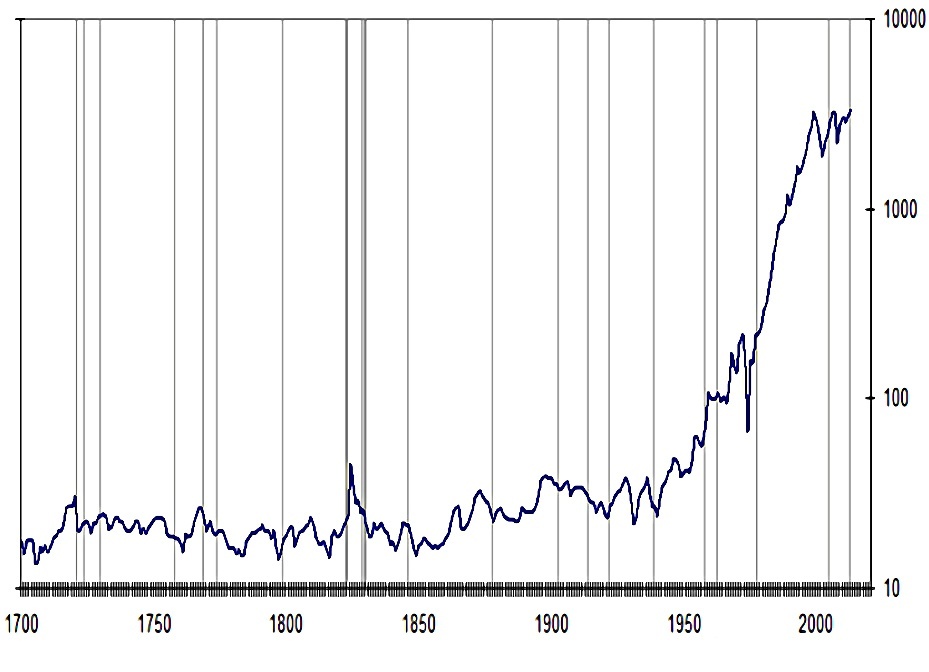
Here’s a longer-term view of the UK, showing the market flatlining for 100 years through the 18th century.
Commenting on McQuarrie’s paper, Joe Marwood at Decoding Markets says:
If you happened to live in Italy between 1900 to 1979 you may well have lost money with buy and hold. The stock market produced a real return (without reinvesting dividends) of only 0.8% during this time. And between 1960 – 1979 it lost -6%.
Likewise, Belgium saw a total real return of -1.7% for the 49 years between 1900-49. And Spain saw a return of only 0.1% between 1910 – 1979.
Reinvestment
So if Buy and Hold is more of a lottery than indexers like to admit, what can do to improve our chances of a good outcome?
The first thing is to reinvest our income rather than spend it.
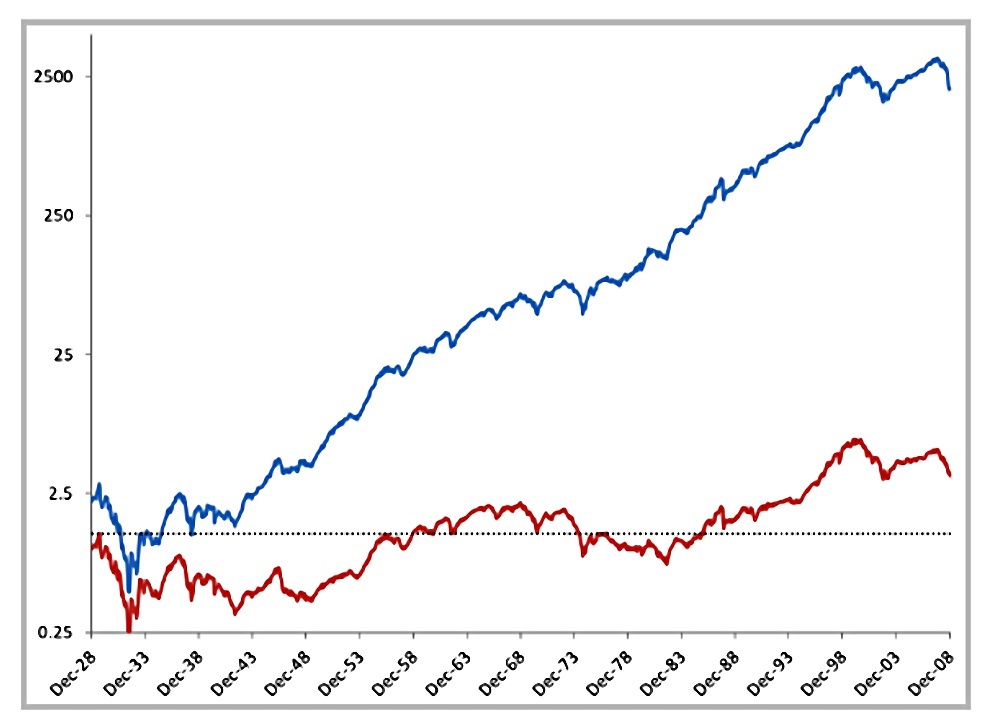
- Here’s the 80-year “good” US chart we began with – the red line shows the impact of no reinvesting dividends.
McQuarrie found that dividends and inflation were responsible for 99.7% of nominal wealth at the end of this period.
We can see the same effect on the UK chart in the previous section (where red is with dividend reinvestment).
It’s not that dividends are magic money, it’s that you need to leave your cash in the market for a long time in order for compounding to work its magic.
- Regular contributions during an extended accumulation phase (25 years or more) have a similar effect.
Valuation
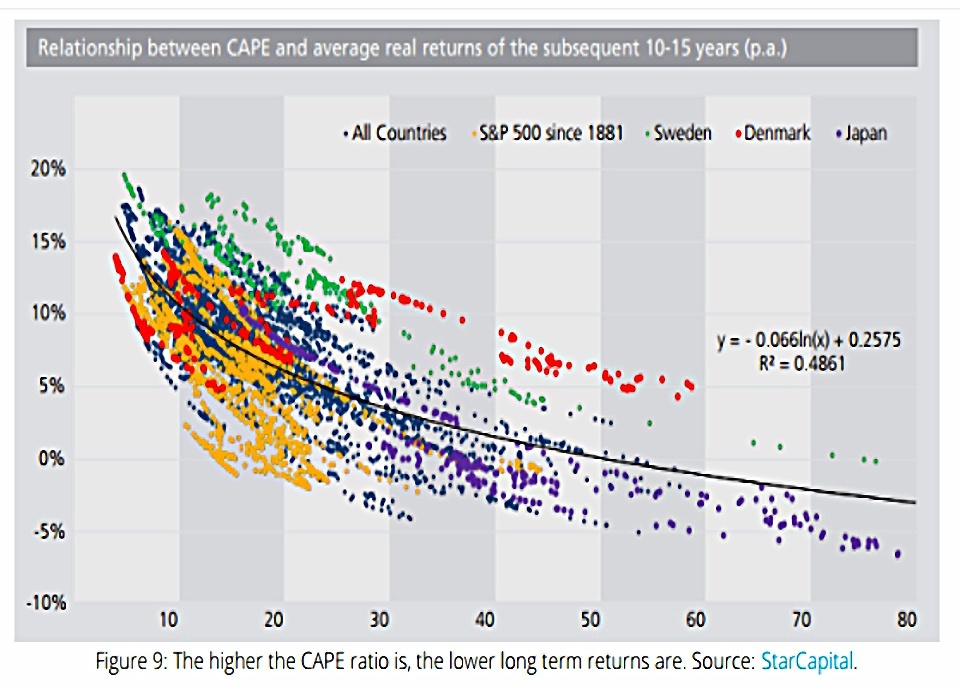
The second big factor is valuation.
- Although the CAPE ratio is notoriously useless as s short-term marking timing measure, it does have good predictive power in the 10- to 15-year time range.
So although time in the market counts, you don’t want to put all your money in when the market is expensive.
The same logic applies in reverse when you are taking your money out.
- If the market is high when you retire, future returns will be lower, which means that you can afford to take less out each year.
A failsafe withdrawal rate for a portfolio with a high equity allocation is somewhere just above 3% pa.
Time horizon
McQuarrie’s paper objected to the use of very long-term data (often 80 years or more) to justify the Buy and Hold approach.
- He suggested that 30 years was a more realistic time horizon for many investors.
I would argue that the replacement of (poor-value) annuities with a drawdown pot which must remain invested has increased this to fifty or sixty years (depending on when you get started).
- Which means that more of the long-run effects will show up in the end.
Conclusions
- Stock markets go up over the long run,
- And stock market returns beat those from other assets in the long run.
- But stocks don’t always do well over shorter periods,
- And they don’t always outperform other asset classes,
- So don’t rely on recent (personal) experience.
- Diversification across geographies and asset classes can help,
- And since valuations matter, so can time diversification (a long investing horizon spanning many different market valuations).
- You should also consider diversifying away from market-cap indexing (using factors, conviction funds, trend-following and thematic investing).
- Always reinvest your dividends (during accumulation),
- And don’t withdraw more than 3% pa (during decumulation).
Until next time.
Mike Rawson
Mike is the owner of 7 Circles, and a private investor living in London. He has been managing his own money for 40 years, with some success.