Lazy Portfolios 3 – One Fund from Vanguard

Today’s post is the third in a series of posts about of Lazy Portfolios. We’ll be looking at single fund solutions from Vanguard.
Contents
My portfolio
Let’s start with a quick recap of what we’ve covered so far.
My base portfolio is a passive global multi-asset portfolio made mostly from low-cost ETFs.
- I use 54 asset classes with an allocation based around volatility parity.
A true volatility parity portfolio is quite safe (and low return), with more than 60% in bonds.
- In order to hit my target / fail safe withdrawal rate of more than 3% pa, I need to cap the bond allocation to 20% – this allows for 75% stocks and 5% True Alternatives.
I also tweak the default allocation to accommodate global ITs and themed funds, and to support some home bias.
Lazy portfolios
Lazy portfolios are pretty much at the opposite end of the spectrum.
- Typically they involve between two and four funds, though some have more.
Their key advantage is simplicity.
- This doesn’t matter much to me – I don’t see the big difference between buying four ETFs and a dozen, or even 50.
But novice investors and those with small portfolios might find them useful.
Common portfolios
Returns are broadly proportional to volatility.
- In order to get good returns, you need to accept more volatility.
So correlations between assets – and in particular, correlations with the primary return-producing asset, stocks – are key.
- Adding poorly correlated assets can reduce the volatility of a portfolio without significantly affecting returns.
This leads to three common portfolios:
- The Max SR portfolio (volatility optimised)
- We’ll simplify this to be 60% bonds, 40% stocks.
- The Max Return portfolio, which is 80% stocks and 20% bonds
- I swap 5% of stocks for True Alternatives, to leave me with 75% stocks
- A Compromise portfolio suitable for a wide range of people,
- This might be 60% stocks, 35% bonds and 5% Alternatives.
Benchmark
We need something along the same lines as my “max return volatility parity” portfolio, but with fewer funds.
- Then we can compare the lazy allocations to our simplified portfolios.
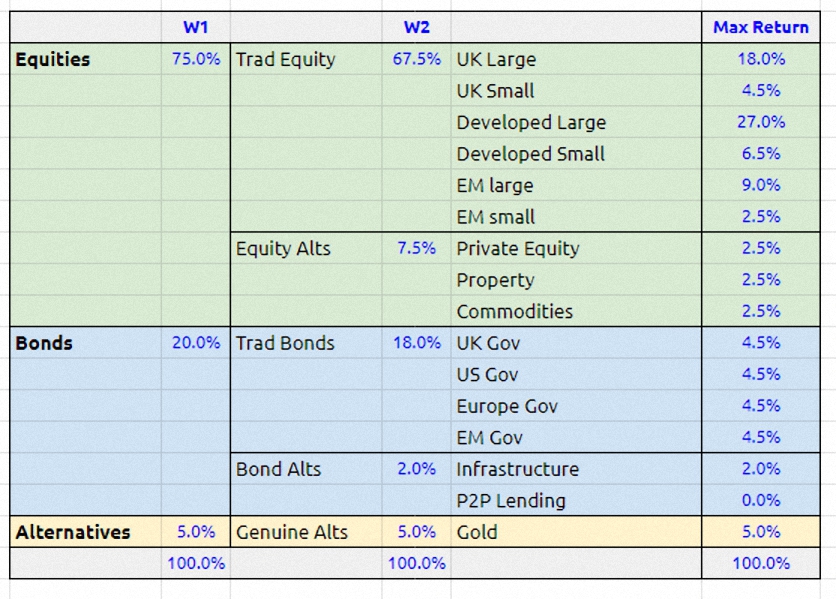
The best I could come up with was a 15-fund portfolio.
- There are six equity funds, three equity alts, four bonds funds, one bond alt and just one true alternative asset – gold.

This chart adds two more benchmarks:
- The Max SR benchmark, and
- The Compromised benchmark.
They have been derived from the max return benchmark by varying the allocations to stocks and bonds.
- Note that the two new benchmarks each include 16 funds rather than 15.
The idea is that we will compare each lazy portfolio to the three benchmarks in order to discover which type of investor it serves best (unless that is immediately obvious).
Note that it isn’t possible to produce high and stable returns from a static portfolio under all economic conditions conditions.
- Long-term investors should stick with stocks as the core of their portfolio, using diversifiers (bonds and true alternatives) to smooth their path a little.
So we will be measuring the lazy portfolios on how well they perform this task.
One fund portfolios
The only one-fund portfolios I come across in the UK are the Vanguard LifeStrategy funds.
- This is a series of fairly cheap (0.22% pa) index funds (not ETFs) that maintain a set allocation between global equities and global bonds.
The range of five funds runs from 20% stocks to 100% stocks, in steps of 20%.
- The three that match most closely to our three benchmark portfolios are the 40%, 60% and 80% equity funds.
Transparency
Vanguard don’t make it particularly easy to work out what’s inside the fund (beyond the headline allocation).
- They use their own benchmarks, and
- They fill the fund with other funds from Vanguard.
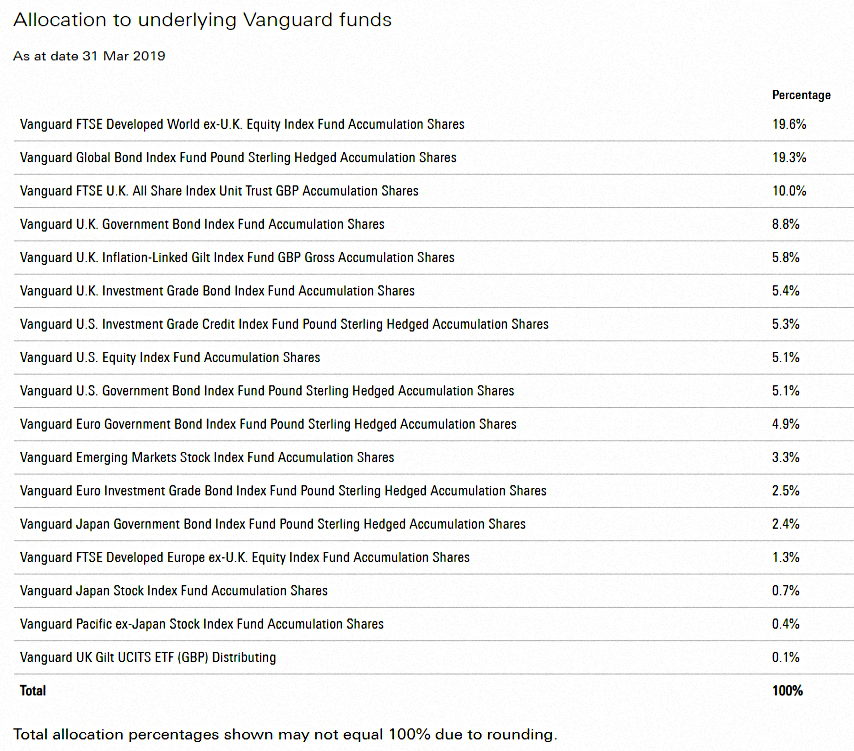
The table above shows the allocations for the 40% stocks fund.
So we’ll need to make some assumptions.
- My plan is to make benevolent assumptions that bring the allocations as close to our benchmarks as is reasonable.
The only area where this might not be the case is home bias.
- I’ve seen discussions on bulletin boards to the effect that that the LifeStrategy series has a “harmful” home bias to the UK.
I can’t easily find the evidence for this, so I will assume a global market cap allocation.
- Of course, since I approve of some home bias, this actually works against the funds.
The numbers
The allocations I’ve used are:
- UK = 6%
- EMs = 10%
- Developed = 84%
- Small cap = 10% of each market
I’ve split bonds equally by region to match our benchmarks.
Here’s how those assumptions work out:
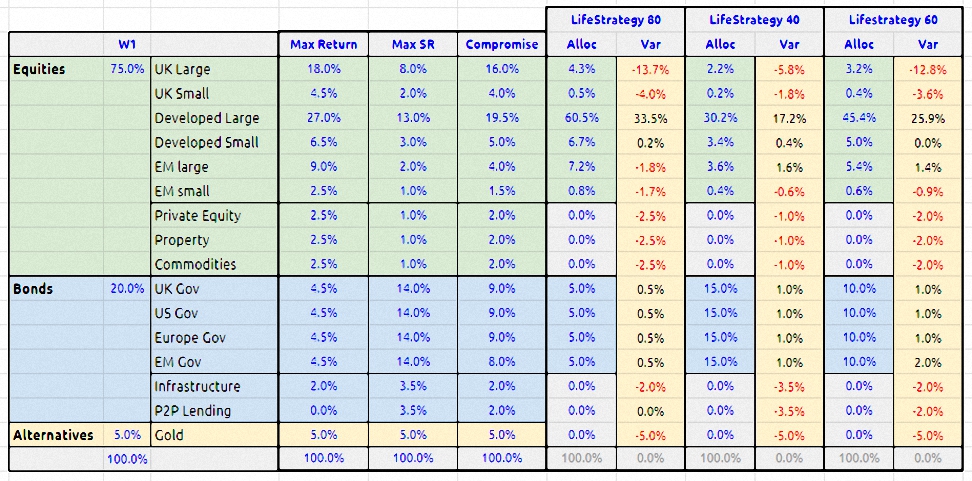
Relative to the appropriate benchmark:
- UK stocks are low
- Developed stocks are high
- EM is mixed – low for LifeStrategy 80, high for the other two.
- Bonds are a bit high but not too bad.
- There are no alternatives of any kind.
One number
In order to compare these variances with those of all the other lazy portfolios from future articles, we need to come up with some metrics, which can ideally be reduced to a single number.
I use three measures when comparing the asset allocation in my passive portfolio with my target allocation:
- I average the variances across 17 “super-categories” of the 37 assets in the portfolio
- I produce an absolute average for the same 17 variances (by ignoring whether the variance is positive or negative)
- And I look at the standard deviation of the variances.
I then convert these three numbers into one by taking the geometric mean of them.
- I don’t claim that this mean has any statistical significance – it’s just a “speedometer” to let me track when my portfolio is drifting too far from it’s target allocation.
When I calculate these numbers for the Vanguard funds, the first two are identical.
- I think this is because the allocations sum to 100%, whereas my passive portfolio often has cash to be allocated or funds to be sold, and doesn’t match its target value.
So we’ll drop one of the averages and calculate the geometric mean of the remaining two numbers.

So what do these numbers mean?
- From my perspective, they look horrific.
I use 17 categories, and these benchmarks have 16 funds, so the numbers should be comparable with the ones I see everyday.
- For my own portfolio, I get twitchy when the geometric mean gets up towards 1.5%.
- I don’t start to relax until it’s below 1%, and ideally less than 0.5%.
Dropping the smallest of the three numbers to match the treatment of the Vanguard funds converts these thresholds to approximately 2.4%, 1.5% and 0.8%.
- So there’s no way I could live with these errors of 3.7% to 6.5%.
I’ve proved to my own satisfaction that the Vanguard funds don’t make suitable portfolios.
- And I think it will be interesting to see how the other lazy portfolios shape up.
I’m hoping that some of them will have errors below 2%, ideally against the Max return benchmark.
That’s it for today.
- In the next article we’ll look at some two fund portfolios.
Until next time.
Mike Rawson
Mike is the owner of 7 Circles, and a private investor living in London. He has been managing his own money for 40 years, with some success.


Interesting comparison and results.
FYI, Trustnet breakdowns show the following approximate [Vanguard LS] allocation to UK Equities:
LS80 20%
LS60 15%; &
LS40 10%
I went through a detailed breakdown of LS80 a few years back, and at that time my results showed about 25% allocated to UK equities.
Good piece. I agree my research showed a home is for life strategy too.
I would value a piece in explaining the maths for those these less mathematically inclined. I’m fascinated by this don’t understand how to follow the number crunching to truly understand what’s being illustrated.
To be honest, it’s not real maths. I’m just trying to turn several alternate measures of “distance” from an “ideal” neutral asset allocation into a single number – so that we can more easily compare the various portfolios.
I find it a bit of a pain monitoring and rebalancing 35 asset classes in my portfolio, and I wanted to be sure that I couldn’t achieve the same objective with far fewer funds.
Thanks Mike – do you mind sharing the formula for the Std Dev that you use on the tables please – as an example looking at the 7C 14 one from the ETF deck as a baseline. However when I do SD I get 0.6% and not 0.9% so in trying to adapt and apply just wanted to check my understanding thanks
You’re jumping ahead a bit – we won’t get to the 7C-14 portfolio for another four articles.
I also wouldn’t get too hung up on the absolute numbers – it’s the relative numbers between portfolios that counts. As it says in the article, the geometric mean is just a speedometer to show how far a portfolio has drifted from a benchmark allocation. It has no statistical significance.
The 7C-14 “SD” is the SD of the variances across the 17 asset classes of the 7C-14 allocations compared to the Max Return benchmark allocations. It’s not the SD of the allocations themselves – I only care about the distance from the benchmark.
The formula is simple: stdev(range of variances) in Google Sheets.
ahhhh, do I spy some bistromaths?
It’s not far off, but not quite.
I’m sure there must be an approved method of measuring the average distance of each of many sets of variances from a common reference point, but I don’t imagine that using it would make things any more clear to the average private investor.
Would some type of regression analysis help?
P.S. for anyone unfamiliar with bistromathics, see e.g. https://hitchhikers.fandom.com/wiki/Bistromathics
I’m not sure what you think needs help. I just need a single number to quantify the distance of each portfolio from my target.
The geometric mean of the two calculations I’m using works fine for me. It’s what I use to decide when my real portfolio needs rebalancing, so this has the advantage of me knowing exactly how horrified I would be to use one of these Lazy Portfolios.
Everyone is free to come up with their own measure, but I find that the simplest ones are best, as you actually calculate them and use them every day.
Or to put it another way: “All models are wrong, but some are useful.”
I’m not sure that anything needs help, per se.
I was just making a suggestion to your “I’m sure there must be…..”
Working with formulas/approaches [and, of course the numbers that they generate] that you are personally familiar with has many advantages.
Most metrics (e.g. Pugh matrices) are constructed largely for convenience and as long as you understand their limitations then that is just fine.
After all, to slightly re-phrase Doctor Box’s saying all models are just approximations – but some are better approximations than others.
Thanks. Apologies for jumping ahead. Had looked at the ETF deck.
I’ll try again in google sheets. I think I’m using the same way of looking / using the numbers as you are suggesting and plugged in your numbers to sense check.